UNIVERSITI TEKNIKAL MALAYSIA MELAKA
FIBER OPTIC SENSOR FOR PALM OIL DETECTION
This report submitted in accordance with requirement of the Universiti Teknikal Malaysia Melaka (UTeM) for the Bachelor Degree of Electronic Engineering Technology
(Telecommunications) with Honours
by
MUHAMMAD FAIZ HAFIZUDDIN BIN MOHD NAWI
B071210065
930425-03-5155
BORANG PENGESAHAN STATUS LAPORAN PROJEK SARJANA MUDA
TAJUK: Fiber Optic Sensor for Palm Oil Detection
SESI PENGAJIAN: 2015/16 Semester 2
Saya MUHAMMAD FAIZ HAFIZUDDIN BIN MOHD NAWI
mengaku membenarkan Laporan PSM ini disimpan di Perpustakaan Universiti Teknikal Malaysia Melaka (UTeM) dengan syarat-syarat kegunaan seperti berikut:
1. Laporan PSM adalah hak milik Universiti Teknikal Malaysia Melaka dan penulis.
2. Perpustakaan Universiti Teknikal Malaysia Melaka dibenarkan membuat salinan untuk tujuan pengajian sahaja dengan izin penulis.
3. Perpustakaan dibenarkan membuat salinan laporan PSM ini sebagai bahan pertukaran antara institusi pengajian tinggi.
4. **Sila tandakan ( ) SULIT
TERHAD
TIDAK TERHAD
(Mengandungi maklumat yang berdarjah keselamatan atau kepentingan Malaysia sebagaimana yang termaktub dalam AKTA RAHSIA RASMI 1972)
(Mengandungi maklumat TERHAD yang telah ditentukan oleh organisasi/badan di mana penyelidikan dijalankan)
(TANDATANGAN PENULIS) Alamat Tetap:
No 23, Jalan Kuala Krai,
Kampung Pek, 18500 Machang,
FAKULTI TEKNOLOGI KEJURUTERAAN
PENGKELASAN LAPORAN PSM SEBAGAI SULIT/TERHAD LAPORAN PROJEK SARJANA MUDA TEKNOLOGI KEJURUTERAAN ELEKTRONIK
(TELEKOMUNIKASI)(BETT): MUHAMMAD FAIZ HAFIZUDDIN BIN MOHD NAWI
Sukacita dimaklumkan bahawa Laporan PSM yang tersebut di atas bertajuk “Fiber
Optic Sensor for Palm Oil Detection” mohon dikelaskan sebagai *SULIT /
TERHAD untuk tempoh LIMA (5) tahun dari tarikh surat ini.
2. Hal ini adalah kerana IANYA MERUPAKAN PROJEK YANG DITAJA OLEH SYARIKAT LUAR DAN HASIL KAJIANNYA ADALAH SULIT.
Sekian dimaklumkan. Terima kasih.
Yang benar,
_________________________ Tandatangan dan Cop Penyelia
* Potong yang tidak berkenaan
NOTA: BORANG INI HANYA DIISI JIKA DIKLASIFIKASIKAN SEBAGAI SULIT DAN TERHAD. JIKA LAPORAN DIKELASKAN SEBAGAI TIDAK TERHAD, MAKA
iv
DECLARATION
I hereby, declared this report entitled “Fiber Optic Sensor for Palm Oil Detection” is the results of my own research except as cited in references.
Signature :……….
Author’s Name :...
v
APPROVAL
This report is submitted to the Faculty of Engineering Technology of UTeM as a partial fulfillment of the requirements for the degree of Bachelor of Engineering Technology (Type your department’s name here) (Hons.). The member of the supervisory is as follow:
………
vi
ABSTRACT
vii
ABSTRAK
viii
DEDICATIONS
This humble effort specially dedicated to my beloved parents, family, lecturers and friends, whose love can never be forgotten for their support, guidance and
encouragement upon completing this project and report.
Special dedicated to my family MOHD NAWI BIN UMAR
ix
ACKNOWLEDGMENTS
In the name of Allah S.W.T, The most Merciful and The most Passionate, I am thankful to Allah for enabling me to complete this report.
First and foremost, I would like to thanks to Mr. Md Ashadi Bin Md Johari as my supervisor, lecturer of Faculty Technology Engineering for giving me a full cooperation and supervision during the making of this final year report. Not to be forgotten, I would like to thanks my family and my friends for contributing their ideas and also encourage me by giving moral support in completing this report.
x
TABLE OF CONTENTS
DECLARATION...iv
APPROVAL...v
ABSTRACT...vi
ABSTRAK...vii
DEDICATION...viii
ACKNOWLEDGEMENT...ix
TABLE OF CONTENTS...x
LIST OF FIGURE...xiii
LIST OF TABLE...xvi
CHAPTER 1 INTRODUCTION...1
1.1 Project Background...1
1.2 Objective...2
1.3 Problem Statement...3
1.4 Scope...3
1.5 Limitation...3
CHAPTER 2 THEORETICAL BACKGROUND...4
2.1 Fiber Optical & Fiber Optical Sensor...4
2.1.1 Optical Fiber Basics...4
xi
2.2 Biodiesel...7
2.2.1 Overview...7
2.2.2 Transesterification Process...8
2.2.3 Biodiesel Demand...11
2.3 Palm Oil...11
2.3.1 Overview...11
2.3.2 Palm Biodiesel...13
2.4 Light Source...15
2.4.1 Light Emitting Diodes (LED)...15
2.4.4.1 Overview...15
2.4.1.2 Input – Output Response...15
2.4.1.3 Advantages Using LED...16
2.4.2 Lasers...16
2.4.2.1 Overview...16
2.4.2.2 Semiconductors Lasers...17
2.5 Splicing Technology...19
2.5.1 Core Alignment Fusion Splicer...19
2.5.2 Mass Fusion Splicer for Ribbon Fiber...21
2.5.3 Specialty Fiber Fusion Splicer...24
CHAPTER 3 SYSTEM DESIGN AND DEVELOPMENT...27
3.1 Background...27
3.2 Overview of Proposal...27
3.3 Research of Title...28
3.4 Literature Review...29
3.5 Research The Best Hardware and Equipment Needed...29
3.5.1 OSA (Optical Spectrum Analyzer)...29
3.5.2 ASE (Amplified Spontaneous Emission)...30
3.5.3 Single Pigtails Optical Fiber and Fiber Optic Cable...31
3.5.4 Palm Oils...32
3.5.5 Splicer...33
xii
3.6 Overview of Fiber Optical Sensor...35
3.7 Testing & Experiment in Laboratory...36
CHAPTER 4 RESULT & DISCUSSION...45
4.1 Introduction...45
4.2 Block Diagram of Project...45
4.3 Experiment Result...46
4.3.1 The Power Measurement Fiber Optics Sensor for Palm Oil………..46
4.3.2 The Sensitivity (W/%) and Linearity (%) in Fiber Optics Sensor for Palm Oil Detection………48
CHAPTER 5 CONCLUSION & FUTURE WORK...52
5.1 Introduction...52
5.2 Conclusion for Chapter 1...52
5.3 Conclusion for Chapter 2...52
5.4 Conclusion for Chapter 3...53
5.5 Conclusion for Chapter 4...53
5.3 Suggestion for Future Work...54
APPENDIX...55
xiii
LIST OF FIGURE
CHAPTER 2
Figure 2.1: Basic structure of an optical fiber………..4
Figure 2.2: Total internal reflection in an optical fiber………5
Figure 2.3: Different types of optical fibers……….5
Figure 2.4: Basic components of an optical fiber sensor system……….6
Figure 2.5: Extrinsic and intrinsic types of fiber optic sensors………...6
Figure 2.6: Procedure of manufacturing biodiesel through transesterification with vegetable oil………9
Figure 2.7: Transesterification reaction of methanol and triglyceride in manufacturing of biodiesel………..10
Figure 2.8: Flowchart of commercialized palm biodiesel production……….13
Figure 2.9: An LED is a p-n semiconductor device that emits light when a voltage is applied across its two terminals………...15
Figure 2.10: An LED behaves like a diode……….16
Figure 2.11: Core Position Measurement………19
Figure 2.12: Alignment with Movable V-groove and Fusion Splice………..20
Figure 2.13: Core Alignment Fusion Splicer FSM-60S………..21
Figure 2.14: Splicing Method with Fixed V-groove………...22
Figure 2.15: Self-alignment effect by Surface Melting Tension……….22
Figure 2.16: Heating Ribbon Fiber with Electric Discharge………...23
Figure 2.17: FTTH Application Fusion Splicer………..23
Figure 2.18: Specialty Fiber Fusion Splicer………25
Figure 2.19: Adjustable Clamping Mechanism for Optical Fibers……….25
Figure 2.20: Discharge Electrodes Vibrating Mechanism………..26
xiv CHAPTER 3
Figure 3.1: Flow Chart of Proposal...28
Figure 3.2: Block Diagram of Fiber Optic Sensor………...29
Figure 3.3: Optical Spectrum Analyzer (OSA)...30
Figure 3.4: Amplified Spontaneous Emission (ASE) ...31
Figure 3.5: Single Mode Pigtails………..32
Figure 3.6: Fiber Optical...32
Figure 3.7: Palm Oils………...33
Figure 3.8: Splicer Optical Fiber………..33
Figure 3.9: Concentration solvent is hexane...34
Figure 3.10: Flow Chart of Project...36
Figure 3.11: The equipments needed to construct the fiber sensor for detections of palm oil...37
Figure 3.12: The pigtails fiber optical cable was cut by cutter to remove of cladding for the core………..37
Figure 3.13: The single mode optical cable was cut by cutter to remove of cladding for the core………..38
Figure 3.14: The core for both fibers optical cables was cut by fiber cleaver to avoid the core of optical cablesinverse when grafted use splicer………...38
Figure 3.15: The both of fiber optic cables were clean up by using the alcohol to avoid the dust on the core………...39
Figure 3.16: The two core alignment with Movable V-groove and Fusion Splice………….39
Figure 3.17: Splicing Method the two ore fiber optic cables with Fixed V-groove…………40
Figure 3.18: Self-alignment the core effect by Surface Melting Tension………40
Figure 3.19: Core Alignment Fusion Splicer………...41
Figure 3.20: Heating Ribbon Fiber the two of core fiber cables with Electric Discharge………...41
Figure 3.21: The two cores apply on the fusion splicer with the loss measurement………...42
Figure 3.22: The core single mode fiber optic cable combine together with pigtails cable after process fusion splicer………...42
Figure 3.23: The connection fiber optics sensors for palm oils detections………..43
xv
Figure 3.25: The value measurement of fiber optic sensors for palm oils
detection in power measurement (dB……….44
CHAPTER 4 Figure 4.1: Block Diagram of the Fiber Optic Sensor for Palm Oil Detection………..45
Figure 4.2: Power vs. PPM……….47
Figure 4.3: The graph shows the 1st slope 850nm in sensitivity and linearity………49
Figure 4.4: The graph shows the 2nd slope 850nm in sensitivity and linearity………...49
Figure 4.5: The graph shows the 1st slope 1300nm in sensitivity and linearity………..50
Figure 4.6: The graph shows the 2nd slope 1300nm in sensitivity and linearity……….50
Figure 4.7: The graph shows the 1st slope 1550nm in sensitivity and linearity………..51
xvi
LIST OF TABLE
CHAPTER 2
Table 1: Sources of fuels of plant origin and their yields in alcohol and oil………..12 Table 2: Composition of fatty acids in palm oil………..12 Table 3: Physical-chemical properties of palm biodiesel and petroleum diesel……….14
CHAPTER 4
Table 4: Power fiber optic sensor value for palm oil detection use palm oil
that is different the concentration...46 Table 5: The table shows the sensitivity (W/%) and linearity (%) in
1
CHAPTER 1
INTRODUCTION
1.1 PROJECT BACKGROUND
In the past 50 years, fiber-optical sensing has been one of the most successful and powerful applications of both fiber optics and sensing technology [Spillman, 2001]. Fiber optic sensing is facilitated by its salient features, which make it prominent among other sensing methods. These fiber optic sensors successfully meet the requirements like high sensitivity and quick response in sensing different chemical and physical variables. Using optical fiber sensing devices one can measure or monitor different physical and chemical parameters in terms of one of the principal parameters that describes the light beams. These principal parameters include light intensity, phase, polarization and wavelength. The characteristic features and promising capabilities of fiber optic sensors make them attractive and place them in the forefront of the Photonics technology. In the fiber optic sensing system, the sensed signal is immune to electromagnetic interference (EMI) and radio frequency interference (RFI). Since optical fibers offer low loss to the signal propagating through it we can use this method for remote sensing applications.
After the energy crisis in the mid 1970s, every country has tried to find a new energy that can replace petroleum by using their district energy; specifically, vegetable oil, the most promising alternative fuels. Vegetable oils cannot be used directly in diesel engines because of the problem associated with it of the using pure vegetable oils as fuels in diesel engines. There are more than 350 oil bearing crops identified, among which only sunflower, soybean, cottonseed, rapeseed and peanut oils are considered as potential alternative fuels for diesel engines [C. Charoenphonphanich, 2004]. The most detrimental properties of these oils are their high viscosity, low volatility, poor atomization and auto-oxidation [C. Y. May, 2005].
2
security and agricultural economy. The two most common types of bio-fuels are ethanol and bio-diesel [A. A. Aziz, 2006]. Chiyuki and Jun-ichi (1998) concluded that de-acidified rapeseed oil could be used in a single cylinder Yanmar IDI diesel engine but degummed and crude rapeseed oil were unsuitable for use as fuel due to the high level of incombustible materials in the oil. Suporn (1987) found that using 100% refined palm oil in a Kubota diesel engine model KND 5B resulted in the best power output and best emission while using 70% refined palm oil blended with 25% diesel resulted in the best specific fuel consumption [T. Apichato, 2003]. For vehicles powered with diesel engines, an alternative substitute of diesel fuel has been developed namely, biodiesel. It is produced from the chemical bonding of an alcohol with oils, fats, greases or chemically known alkyl esters [R. Zanzi, 2006]. These esters have similar properties as the mineral diesel fuel and even better in terms of its cetane number. In addition, biodiesel is better than diesel fuel in terms of sulfur content, flash point and aromatic content [C. Y. May, 2005]. As a liquid fuel, biodiesel is simple to use and can be used in compression ignition (diesel) engines without modifications. It also can be blended at any level with petroleum diesel to create a biodiesel blend [A. Aziz, 2005]. Regarding these qualities of vegetable oils, Malaysia has committed to investigate the use of biodiesel with blends of palm oil as an alternative fuel for diesel engines. This paper presents palm biodiesel as an alternative green renewable bio-fuel for diesel engines.
This project is about to develop the palm oil concentration detection using the fiber sensor. The main part is the functional of optical fiber in telecommunication system. The optical fiber can use to detect the concentration of palm oil using the high-index of oil.
1.2 OBJECTIVE
The main objective of this project:
a. To study fiber optical sensor for palm oil concentration detection.
b. To development fiber optical sensor for palm oil concentration detection.
3 1.3 PROBLEM STATEMENT
Nowadays, the use biomass as an energy source should be part of the climate change solution as long as it is developed in a truly sustainable way. The problem occur in our world is the production of biodiesel or bio-fuels are decrease. The biochemistry makes research and analysis to find new liquor fuels to replace biodiesel using biomass. Palm oil is now starting to be used as an ingredient in bio-diesel and as a fuel to be burnt in power stations to produce electricity. This project is implementation using the application of fiber optical sensor to detect the concentration of palm oil. Reason why we must detect different concentration? This is because very different power value in every concentration for performance of palm oil biodiesel as bio-fuel energy.
1.4 SCOPE
The scope of this project is to study and develop fiber optical sensor for palm oil concentration detection. This project to ensure the project is heading in the right direction to achieve its objective. The scopes of this project are to study and develop the Fiber Optical Sensor, Fiber Optical Sensor for Liquor and also Concentration of Palm Oil.
1.5 LIMITATION
The limitations of the study are those characteristics of design or methodology that impacted or influenced the interpretation of the findings from a research. They are the constraints on generalize ability, applications to practice, and/or utility of findings that are the result of the ways in which there initially chose to design the study and/or the method used to establish internal and external validity. Some of limitations are:
4
CHAPTER 2
THEORETICAL BAKGROUND
2.1 FIBER OPTICAL & FIBER OPTICAL SENSOR
2.1.1 Optical Fiber Basics
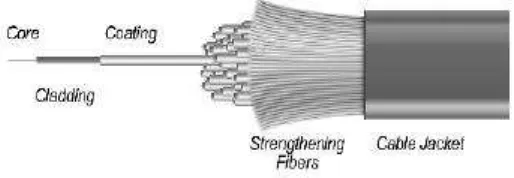
An optical fiber is composed of three parts; the core, the cladding, and the coating or buffer. The basic structure is shown in Figure 2.1. The core is a cylindrical rod of dielectric material and is generally made of glass. Light propagates mainly along the core of the fiber [Jones, 1998].
Figure 2.1: Basic structure of an optical fiber.
The cladding layer is made of a dielectric material with an index of refraction. The index of refraction of the cladding material is less than that of the core material. The cladding is generally made of glass or plastic. The cladding executes such functions as decreasing loss of light from core into the surrounding air, decreasing scattering loss at the surface of the core, protecting the fiber from absorbing the surface contaminants and adding mechanical strength [Jones, 1998].
5
Figure 2.2: Total internal reflection in an optical fiber.
Optical fibers are divided into two groups called single mode and multimode. In classifying the index of refraction profile, we differentiate between step index and gradient index. Step index fibers have a constant index profile over the whole cross section. Gradient index fibers have a nonlinear, rotationally symmetric index profile, which falls off from the center of the fiber outwards [Jenny, 2005]. Figure 2.3 shows the different types of fibers.
6 2.1.2 Fiber Optic Sensor Principles
The general structure of an optical fiber sensor system is shown in Figure 2.4. It consists of an optical source (Laser, LED, Laser diode etc), optical fiber, sensing or modulator element (which transducers the measured to an optical signal), an optical detector and processing electronics (oscilloscope, optical spectrum analyzer etc.).
Figure 2.4: Basic components of an optical fiber sensor system.
Fiber optic sensors can be classified under three categories: The sensing location, the operating principle, and the application. Based on the sensing location, a fiber optic sensor can be classified as extrinsic or intrinsic. In an extrinsic fiber optic sensor (see Figure 2.5), the fiber is simply used to carry light to and from an external optical device where the sensing takes place. In these cases, the fiber just acts as a means of getting the light to the sensing location.
7
On the other hand, in an intrinsic fiber optic sensor one or more of the physical properties of the fiber undergo a change (see Figure 2.5). Perturbations act on the fiber and the fiber in turn changes some characteristic of the light inside the fiber [Tracey, 1991].
Based on the operating principle or modulation and demodulation process, a fiber optic sensor can be classified as intensity, a phase, a frequency, or a polarization sensor. All these parameters may be subject to change due to external perturbations. Thus, by detecting these parameters and their changes, the external perturbations can be sensed [Yu, 2002]. Based on the application, a fiber optic sensor can be classified as follows:
Physical sensors: Used to measure physical properties like temperature, stress, etc.
Chemical sensors: Used for pH measurement, gas analysis, spectroscopic studies, etc.
Bio-medical sensors: Used in bio-medical applications like measurement of blood flow, glucose content etc.
2.2 BIODIESEL
2.2.1 Overview
8 2.2.2 Transesterification Process
Biodiesel is a very versatile transport fuel and can be produced from local raw material or collection of used vegetable or frying oil in rural regions of developing countries. There are three basic routes to biodiesel production from oils and fats [R. Ranzi, 2006]:
Base catalyzed transesterification of the oil Direct acid catalyzed transesterification of the oil Conversion of oil to its fatty acids and then to biodiesel
Transesterification reaction is a stage of converting oil or fat into methyl or ethyl esters of fatty acid, which constitutes to biodiesel. Biodiesel (methyl ester) is obtained through the reaction of triglycerides of vegetable oils with an active intermediary, formed by the reaction of an alcohol with a catalyst. The general reaction for obtaining biodiesel through transesterification is [U. H. Bezerra, 2007]:
Oil or Fat + Methanol ⎯⎯→ Methyl Esters +Glycerol
Or
Oil or Fat + Methanol ⎯⎯→ Ethyl Esters +Glycerol