PIC BASED FIBER OPTIC PRESSURE SENSOR
SUKRULNIZAM BIN ISMAIL
This report is submitted in partial fulfilment of requirements for the award of
Bachelor of electronic Engineering (Telecommunication Electronics)
With Honours
Faculty of Electronic and Computer Engineering
Universiti Teknikal Malaysia Melaka
i
DECLARATION
“I hereby declare that this report is result of my own effort except for works that have been cited clearly in the references.”
Signature : ……….
SUPERVISOR APPROVAL
“I hereby declare that I have read this report and in my opinion this report is sufficient in terms of scope and quality for the award of Bachelor of Electronic
Engineering (Telecommunication) with Honours”
Signature : ……….
iii
DEDICATION
ACKNOWLEDGEMENT
Assalamualaikum and Alhamdulillah.Praise to Allah S.W.T The Most Gracious, The Most Merciful, there is no power no strength save in Allah, The Higher and The Greatest, whose blessing and guidance have helped me through the process of completing this Final Year Project. Peace and blessing of Allah be upon our prophet Muhammad S.A.W who has given light to mankind.
Firstly my deepest gratitude goes to my supervisor Mr. Chairulsyah Bin Abdul Wasli for all the knowledge, motivation, guide and support that had given me in completing this report. Lot of love from deepest of my heart goes to my family especially my parents whom always given me their love and warm support.
I sincerely and almost thank to all the persons that helping me directly or indirectly for this project especially to my teacher, my friends and etc.Thank for all the support.
v
ABSTRAK
ABSTRACT
vii
TABLE OF CONTENT
CHAPTER
TITLE
PAGE
PLC BASED FIBER OPTIC PRESSURE SENSOR
DECLARATION
i
SUPERVISOR APPROVAL
ii
DEDICATION
iii
ACKNOWLEDGEMENTS
iv
ABSTRAK
v
ABSTRACT
vi
TABLE OF CONTENT
vii
LIST OF TABLE
x
LIST OF FIGURE
xi
LIST OF TERM
xiii
I
INTRODUCTION
1
1.1
OBJECTIVE
3
1.2
SCOPE OF WORKS
3
1.3
PROBLEMS STATEMENT
4
1.4
METHODOLOGY
5
1.5
REPORT STRUCTURE
6
II
LITERATURE REVIEW
7
2.1
INTRODUCTION
7
2.2
FIBER OPTIC CABLE
8
2.5
PROPAGATION OF LIGHT ALONG A FIBER
13
2.5.1 Ray Theory
13
2.5.2 Mode Theory
13
2.6
PLANE WAVES
14
2.7
OPTICAL FIBER TYPES
16
2.7.1 Single Mode Fibers
16
2.7.2 Multimode Fibers
17
2.8
PROPERTIES OF OPTICAL FIBER TRANSMISSION
18
2.9
ATTENUATION
19
2.10 ABSORPTION
20
2.10.1 Intrinsic Absorption
20
2.10.2 Extrinsic Absorption
21
2.11
SCATTERING
21
2.12
BENDING LOSS
22
2.13 DISPERSION
24
2.13.1 Intramodal Dispersion
24
2.13.2 Intermodal Dispersion
25
2.14 PROGRAMMABLE INTERFACE CONTROLLER
26
2.14.1 Data space (RAM)
26
2.14.2 Code space
28
2.14.3 Word size
27
2.14.5
Stacks
27
2.14.5 Instruction set
28
ix
III
RESEARCH METHODOLOGY
32
3.1 THEORY
32
3.2
HARDWARE DEVELOPMENT
35
3.3
FLOWCHART OF PRESSURE SENSOR
36
3.4
SENSOR MODELLING CALCULATION
36
3.5
TRANSMITTER CIRCUIT OPERATION
38
3.6
RECEIVER CIRCUIT OPERATION
38
3.7
PIC 16F873 CIRCUIT WITH BUZZER
39
IV
RESULT
41
4.1
INTRODUCTION
41
4.2
CALCULATION
42
4.3
SIMULATION
48
4.4
MEASUREMENT OF THE BENDING LOSS
50
4.5
CALCULATIONS OF BENDING LOSS
51
4.6
PROTEUS DESIGN
54
V
DISCUSSION & CONCLUSIONS
55
5.1
DISCUSSION
55
5.2
CONCLUSION
58
5.3
FUTURE WORK
59
REFERENCES
60
APPENDIX A: CODING FOR PIC 16F873
61
LIST OF TABLE
TABLE
TITLE
PAGE
xi
LIST OF FIGURE
FIGURE
TITLE
PAGE
1
Original diagram of microbending fiber optic sensor
2
2.1
Structure of single-core fiber optic cable
11
2.2
Light fefraction at a glass-air boundary
11
2.3
Critical angle of incidence
12
2.4
Plane-wave propagation
14
2.5
Wavefront propagation along an optical fiber
15
2.6
The spreading of light pulse
16
2.7
Fiber transmission properties
19
2.8
Fiber Losses
20
2.9
Light scattering
22
2.10
Microbend loss
23
2.11
Pulse overlap
24
2.12
Distance travelled by each made over the same time span
26
3.1
Project flow chart
34
3.2
Microbending sensor
35
3.3
Design of PIC based fiber optic pressure sensor
35
3.4
Flow chart of the pressure sensor
36
3.5
Plastic fiber optic sensor; Microbend pattern generation
37
3.6
Schematic of transmitter circuit
38
3.7
Schematic of receiver circuit
39
3.8
Buzzer circuit design with PIC
40
4.1
Graph bending loss vs bending radius
42
4.2
Bending losses
43
4.5
Fundamental mode field in curved optical fibre
46
4.6
Simulation circuit for transmitter
48
4.7
DC analysis result (transmitter)
48
4.8
AC analysis result (transmitter)
48
4.9
Simulation circuit for receiver circuit
49
4.10
DC analysis results (receiver)
49
4.11
AC analysis results (receiver)
49
4.12
Transmitter circuit schematic foot print
54
4.13
Transmitter circuit schematic foot print
54
5.1
Diagram of microbend sensor
55
xiii
LIST OF TERM
a
core radius
Aeff
effective (modal) area of fiber
B
data rate
Bn
noise bandwidth of amplifier
c
vacuum velocity of light
D
fiber dispersion (total)
I(r)
power per unit area guided in single mode fiber
k
Boltzmann’s constant
Jm
Bessel function of order m
Km
modified Bessel function of order m
k0
vacuum wave vector
l
fiber length
LD
dispersion length
M
modulation depth
N
order of soliton
n
actual number of detected photons
Neff
effective refractive index
n0
core index
n1
cladding index
P
optical power guided by fiber
PIC
Programmable Interface Controller
PE
error probability
Pf
probability of fiber failure
Ps
received signal power
Ps
signal power
P0
peak power
RL
load resistor
R(r)
radial dependence of the electric field
S
failure stress
SNR
signal-to-noise ratio measured in a bandwidth Bn
S0
location parameter
t
time
T0
pulse width
U
normalized pulse amplitude
profile exponent
f
frequency chirp
R
attenuation of Raman-shifted mode
˜
complex propagation constant
1
propagation constant
2
dispersion (2d order)
peak index difference between core and cladding
f
frequency deviation
L
change in length of fiber under load
phase difference between signal and local oscillator
source spectral width
time delay induced by strain
strain
HET
heterodyne efficiency
c
critical angle
( )
azimuthal dependence of the electric field
vacuum wavelength
c
cut-off wavelength
normalized distance
(r, , z)
scalar component of the electric field
1
CHAPTER I
INTRODUCTION
1.0 INTRODUCTION
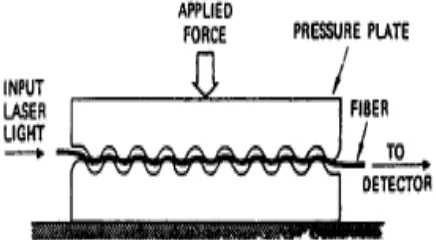
PIC (Programmable Interface Controller) based fiber optic pressure sensor is a technology that combine the function of fiber optic cable and PIC. This project would be develop based on the theory of microbend sensor. The microbend sensor was one of the earliest fiber optic sensors. Microbend loss have always been curse to the fiber optic cable designer, but it is this very same microbend loss effect in optical fiber which was exploited by the microbed sensor designer who adapted the microbend effect to the measurement of many physical parameter and physical variables such as temperature and pressure. Microbend sensors are very interesting sensor with some outstanding performance characteristic that have made them successfully in commercial application.
The early interesting in microbending sensor was for hydrophone application and this work was driven by the Navy’s FOSS (Fiber optic sensor systems) program. Since that time, over 100 different studied on microbend sensor have appeared in the literature and the sensor have been adapted to many different measurement application
A micro bender is called an intrinsic fiber optic sensor because light is not permitted to exit from the fiber into free space. The micro bender is a displacement sensor. When the separation between the tooth blocks changes (figure 1), the
through the clamped region is a very sensitive function of the sinusoidal amplitude of the bent fiber. [1]
Figure 1: Original diagram of microbend fiber optic sensor
The project would be developing the simple sensor, pressure sensor, acceleration sensor and etc. The project would be developing the simple sensor, system that used light, PIC and fiber optic cable. In the free condition or normal, the certain level is measured as a main point. Then, when the pressure is given ,the cable would be bend the angle of the light would be change and cause the change of measurement level .When the pressure is increase , the bend also become higher, and the differential of the angle at based point would be change and level measure is gets lower. This will be indicator that the cable is in bent condition and the system is in pressure condition.
3
1.1 OBJECTIVE
The main objective in this project is to design and develop the pressure sensor by using Programmable Interface Controller (PIC) and fiber optic cable.
1.2 SCOPES OF WORK
The scopes of works in this project are:
I. To study and understanding the basic operation of the Programmable interface controller and communication of fiber optic cable.
II. Study the related formula of the micro bending loss and make the calculation, measurement and comparison of the attenuation, bending loss.
III. Construct the circuit of the receiver and transmitter of fiber optic cable. This circuit would become as PIC based fiber optic pressure sensor.
IV. Create the coding for the programmable logic circuit to detect the bending loss of pressure sensor.
Other scopes of work include:
I. Maintain good log book results. II. Prepare the necessary document III. Publishing final report
The conventional pressure sensors use film resistor, strain gauges, metal alloys, or polycrystalline semiconductor as the resistive media. These materials conduct more or less electricity based on geometric deformations in their structure and make the measurement of the pressure become inaccurately. The disadvantages of conventional pressure sensor is the data that been transmit are in analog. So, it must be converting from the analog to digital at the electronic signal processing and the measurement that obtain would be effect. Nowadays, it is well known that optical fiber sensors play a major role on the performance of various state of the art measurement devices and systems, namely: gyroscopes, accelerometer, strain and temperature sensors, among many other. In order to increase the range of applications of such kind of sensors a great deal of researcher activities has been guided towards the design and implementation of low-cost sensors. This work addresses design, implementation and characterization of a plastic optical fiber microbend sensor, and points out its potential as a low-cost anti-squeeze sensor. Quite reasonable results were obtained using plastic optical fiber sensor and standard optoelectronic detection scheme.
5
1.4 METHODOLOGY
Phase 1:
Meet and discuss with supervisor Mr. Chairulsyah Bin Abdul Wasli about this project. Show the project progress to him and then get more information about programmable interface controller (PIC) and fiber optic from internet, jurnal, e-book and so on. Firstly try to understand the concept and expected result for this project.
Phase 2:
For this phase, discuss with supervisor and do survey on the project process. Try to get and understand the related formula especially about micro bending. Try to find the calculation in this project and the expected results.
Phase 3:
For this phase, obtain the actual diagram of the project design and try to understand the operation of PIC based fiber optic pressure sensor. Then, by using software adobe flash CS4 professional, and create the animation. Show the animation to supervisor and make correction of the design. Then, we could be constructing the circuit of receiver and transmitter in multisim andbreadboard.
Phase 4:
1.5 REPORT STRUCTURE
This report was divided into five chapters. The first chapter is focusing on the introduction of the project. The introduction consist of the project brief introduction, objective of the project, the project statement, scope of work, project methodology and the report structure.
The second chapter is about the literature review. This chapter is focusing on the documentation of the theory that related in designing receiver. The reviews of the previous case study are also included in this chapter.
The third chapter is mainly about the research methodology. All the progress and work flow are describe in this chapter.
The fourth chapter is about the project progress focusing on the results of the simulation. All the data that were obtain during this semester will be documented in this chapter. The full project results are shown.
7
CHAPTER II
LITERATURE RIVIEW
2.0 INTRODUCTION
Over the past 20 years two major product revolutions have taken place due to the growth of the optoelectronics and fiber optic communications industries. The optoelectronics industry has brought about such products as compact disc players, laser printers, bar code scanners, and laser pointers. The fiber optic communications industry has revolutionized the telecommunications industry by providing higher performance, more reliable telecommunication links with ever decreasing bandwidth cost. This revolution is bringing about the benefits of high-volume production to component users and a true information superhighway built of glass.
In parallel with these developments, fiber optic sensor technology has been a major user of technology associated with the optoelectronic and fiber optic communications industries. Many of the components associated with these industries were often developed for fiber optic sensor applications.
Fiber optic sensor technology, in turn, has often been driven by the development and subsequent mass production of components to support these industries. As component prices have fallen and quality improvements have been made, the ability of fiber optic sensors to displace traditional sensors for rotation, acceleration, electric and magnetic field measurement, temperature, pressure, acoustics, vibration, linear and angular position, strain, humidity, viscosity, chemical
early days of fiber optic sensor technology, most commercially successful fiber optic sensors were squarely targeted at markets where existing sensor technology was marginal or, in many cases, nonexistent. The inherent advantages of fiber optic sensors, which include their
(1)ability to be lightweight, of very small size, passive, low power, and resistant to electromagnetic interference;
(2)high sensitivity; (3)bandwidth;
(4)Environmental ruggedness, were heavily used to offset their major disadvantages of high cost and end-user unfamiliarity.
The situation is changing. Laser diodes that cost $3000 in 1979 with lifetimes measured in hours now sell for a few dollars in small quantities, have reliability of tens of thousands of hours, and are widely used in compact disc players, laser printers, laser pointers, and bar code readers. Single-mode optical fiber that cost $20/meter in 1979 now costs less than $0.10/meter, with vastly improved optical and mechanical properties. Integrated optical devices that were not available in usable form at that time are now commonly used to support production models of fiber optic gyros. Also, they could drop in price dramatically in the future while offering ever more sophisticated optical circuits. As these trends continue, the opportunities for fiber optic sensor designers to produce competitive products will increase and the technology can be expected to assume an ever more prominent position in the sensor Marketplace. In the following sections the basic types of fiber optic sensors being developed are briefly reviewed, followed by a discussion of how these sensors are and will be applied. [2]