i
ACKNOWDGEMENT
I would like to express my gratitude to my supervisor, Professor Madya Abd Salam bin Md Tahir for his indispensable guidance and advice. It is honor for me to have such a great supervisor who willing to spend his precious time to give advices, guidance, support and encouragement to me throughout the course of this Project Sarjana Muda.
I own my deepest gratitude to my beloved family who raise me up and give selfless contribution to me. I own their forgiveness as I seldom accompany them in the period of this project. Their finance and spirit support to make this project successful.
ii
ABSTRACT
iv
ABSTRAK
v
vi
TABLE OF CONTENT
CHAPTER TITLE PAGES
ACKNOWDGEMENT i
ABSTRACT ii
ABSTRAK iv
TABLE OF CONTENT vi
LIST OF TABLES ix
LIST OF FIGURES x
LIST OF ABBREVIATIONS, SYMBOLS AND NOMENCLATURE
xii
1 INTRODUCTION
1.1 Background 1
1.2 Problem statement 3
1.3 Objective 3
1.4 Scope of study 4
2 LITERATURE REVIEW
2.1 Cyclic loading 5
2.1.1 Constant amplitude loading 7
2.1.2 Variable amplitude loading 8
2.2 Aluminum-alloy 9
2.2.1 Types of Aluminum-alloy 9
vii
2.2.3 Wrought Aluminum 10
2.2.4 Properties of Aluminum and its alloys
11
2.2.4.1 Properties of Aluminum 11
2.2.4.2 Properties of Aluminum- alloys
13
2.3 Stress concentration and stress raisers 14
2.3.1 Stress concentration factors 15
2.3.2 Designing to minimize stress concentration
18
2.4 S-N curve 20
2.5 Definition of fatigue 23
2.6 Fatigue crack nucleation and growth 24
3 METHODOLOGY
3.1 Specimen design and specification 25
3.1.1 The design of notched specimen 26
3.1.2 Fatigue test specimen 27
3.2 Number of test specimens 30
3.3 Test materials 31
3.4 Fabrication and machining process of test specimen
31
3.5 Stress concentration factors 33
3.5.1 Stress concentration factors for test Specimens
33
3.5.1.1 SCFs of U-notch in tensile and fatigue test specimen
33
3.5.1.2 SCFs of V-notch in tensile and fatigue test specimen
35
3.6 Stress –based approach 37
3.7 Tensile test 38
3.7.1 Experimental procedure of tensile test
viii
3.8 Fatigue test 40
3.8.1 Experimental procedure of fatigue test
40
4 DATA AND RESULTS
4.1 Tensile test results 42
4.2 Fatigue test results 44
5 ANALYSIS AND DISCUSSION
5.1 Analysis of tensile test results 54
5.2 Analysis of fatigue test results 55
5.3 Factors influencing fatigue test results 56
5.3.1 Effect of stress raisers 57
5.3.2 Effect of surface condition 59 5.3.3 Effect of applied stress 61
5.4 Fracture behavior of tested materials 61
5.4.1 Fracture behavior of materials under tensile test
62
5.4.2 Fracture behavior of materials under fatigue test
63
6 CONCLUSION AND RECOMMENDATION
6.1 Conclusion 68
6.2 Recommendation 69
REFERENCES 70
APPENDICES 75
ix
LIST OF TABLES
Table 2.1: Series of casting aluminum………...………..10
Table 2.2: Series of wrought aluminum………...….11
Table 2.3: Stress Concentration Factors for U notch in a thin beam element…...16
Table 2.4: Stress Concentration Factors for V notch in a thin beam element…...17
Table 3.1: The numbers of test specimens for tensile test………...30
Table 3.2: The numbers of test specimen for fatigue test………30
Table 3.3: Chemical composition for Aluminium Alloy 5083………. .32
Table 3.4: Data of Kt for tensile and fatigue test specimens………36
Table 4.1: Tensile test results for U and V-notched specimen……….43
Table 4.2: Results of Fatigue test for U-notched Specimen……….…45
Table 4.3: Results of Fatigue test for V-notched Specimen……….46
Table 4.4: Experimental and Theoretical Value of Fatigue Strength……….……..53
x
LIST OF FIGURES
Figure 2.1: Visual Examples of Axial stress, Torsional stress and bending
stress………....6
Figure 2.2: Example of Constant amplitude loading……….6
Figure 2.3: Example of Variable amplitude loading……….….6
Figure 2.4: Nomenclature of Constant amplitude loading……….…8
Figure 2.5: The degree of corrosion and its effect on strength in two different environments………...………..……....13
Figure 2.6: Thin beam element with U notch on one side………..….…16
Figure 2.7: Thin beam element with V notch on one side………..…….17
Figure 2.8: Stress raisers and the effect of their shape on stress concentration.(a) If no stress raiser is present, the stress is constant across cross section A. (b) If a rounded notch is present, the stress is constant over most of the cross section. (c) As the notch becomes sharper, the stress concentration becomes greater………..………..……18
Figure 2.9: Two parts with the same shape (step in cross section) but differing stress flow patterns can give totally different notch effects and widely differing stress levels at the corner step: (a) stress flow is smooth; (b) sharp change in the stress flow direction causes high stress………...19
Figure 2.10: (a) sharp contour gives high stress concentration.(b) smooth the contour to alleviate the stress concentration………..……....19
Figure 2.11: S-N curves for aluminum and low-carbon steel………...…….20
xi
Figure 2.13: The fatigue strength for notched and unnotched specimen…...….22
Figure 3.1: The geometry and dimension of U-notch………..26
Figure 3.2: The geometry and dimension of V-notch………...27
Figure 3.3: Bend specimen – Standard Proportions and Tolerances………..….28
Figure 3.4: U-notch fatigue test specimen………...………..………..29
Figure 3.5: V-notch fatigue test specimen………..……...………..29
Figure 4.1: S-N curve for U-notched specimen (Maximum stress against Number of cycles to failure with log scale)……….47
Figure 4.2: S-N curve for U-notched specimen (Stress amplitude against Number of cycles to failure with log scale)……….48
Figure 4.3: S-N curve for V-notched specimen (Maximum stress against Number of cycles to failure with log scale)……….49
Figure 4.4: S-N curve for V-notched specimen (Stress amplitude against Number of cycles to failure with log scale)……….50
Figure 4.5: S-N curve for U and V-notched specimens (Maximum stress against Number of cycles to failure with log scale)………...51
Figure 4.6: S-N curve for U and V-notched specimens (Stress amplitude against Number of cycles to failure with log scale)………...52
Figure 5.1: The picture shows that the irregular and unsmooth surface of U-notched specimen under observation of stereomicroscope….……..59
Figure 5.2: The stereomicroscope ………...………....60
Figure 5.3: Ductile fracture with irregular and fibrous appearance……….62
Figure 5.4: Necking and cup-and-cone behavior……….63
Figure 5.5: The fabrication of U-notched specimens………...64
Figure 5.6: The fabrication of V-notched specimens………...64
Figure 5.7: Fracture V-notched specimens………..64
Figure 5.8: The first U-notched specimen which shows larger final fracture area………...65
Figure 5.9: The second U-notched specimen which shows smaller final fracture area………...….65
Figure 5.10: Macroscopic fatigue fracture surface………66
xii
LIST OF ABBREVIATIONS, SYMBOLS AND NOMENCLATURE
S-N Curve -A curve of stress amplitude versus number of cycle
SCFs -Stress concentration factors
∆σ -stress range
σmean -mean stress
σamp -stress amplitude or alternating stress
R -stress ratio
A -amplitude ratio
σmax -maximum stress
σmin -minimum stress
AA -Aluminum Association
K -stress concentration factors
Kt -Theoretical stress-concentration factor
ASTM -American Society for Testing and Materials
α -angle of notch
Ktα -Stress concentration for notch of angle α, with other
dimensions the same
Ktn -Stress concentration for straight- sided notch with semicircle
bottom
ISO -International Organization for Standardization
1
CHAPTER 1
INTRODUCTION
1.1 BACKGROUND
Fatigue is a leading cause of failure in mechanical components and structures that are subjected to repetitive loads which is below the yield stress. Fatigue on metal means the metal parts is subjected to cyclic stress or formally known as repetitive loads and the metal will fail at a much lower stress which the part can withstand under the application of a single static stress. Failures that occur under repeated or cyclic stresses are called fatigue failures. Failure is the end result of a process involving the initiation and growth of a crack, usually at the site of a stress concentration on the surface.
2 or fluctuation in the applied stress and sufficiently large number of cycles of the applied stress. In addition, there are a host of other variables such as stress concentration, corrosion, temperature, overload, metallurgical structure, residual stresses, and combined stresses, which tend to alter the condition for fatigue.
Fatigue testing can be considered as simply applying cyclic loading to test specimen to understand how it will perform under similar conditions in actual use. The load application can either be a repeated application of a fixed load or simulation of in-service loads. In many applications, materials are subjected to vibrating or oscillating forces. The behavior of materials under such load conditions differs from the behavior under static load. Therefore, engineers are faced with predicting fatigue life, which is defined as the total number of cycles to failure under specified loading conditions. Fatigue testing gives more accurate data to predict the in-service life of materials.
A most influential fatigue research and extensive fatigue test programs were carried out by Wohler, a German railroad engineer in era (1858-1870). J. McEvily (2013) claimed that, Wohler was primarily interested in determining the maximum stress amplitude below which an axle would not fail. Because of pioneering contributions to the field of fatigue research, plots of stress amplitude versus fatigue life are commonly referred to as Wohler’s curves in Europe. In the United States such plots are known as S-N curves. Engineers can derive the stress level a material can endure for a specific number of cycles from the S-N curve.
According to Schijve (2009), predictions of the fatigue limit of a notched element is a more well-defined problem than predictions of S-N curves. In the field of fatigue limit, it emphasizes of predicting whether a crack will be nucleated at the root of a notch, or whether that will not occur. For several engineering applications that is indeed a design criterion. It boils down to a prediction of a threshold stress level. Notches with a well defined geometry for which the stress concentration factor (Kt) is available or can be calculated. It starts with predictions of the fatigue limit
3
1.2 PROBLEM STATEMENT
Nowadays, aluminum-alloys are being used successfully in a wide range of application, from packaging to aerospace industries. Due to their good mechanical properties and low densities, these alloys have many advantages over other conventional structural materials. Aluminum-alloys with notches and under fatigue loadings significantly weaken its performance in application. Thus, understanding Aluminum-alloys with SCFs is important. As a result of its importance, a series of study and research have been conducted to avoid failure and can be detected at early stage. The magnitude of SCFs will depend on the types of notches used. The aluminum-alloy plates with U and V notches will be tested under fatigue loadings and its fatigue behavior will be observed and recorded.
1.3 OBJECTIVE
4
1.4 SCOPE OF STUDY
1. Conduct literature study and survey of the research /field of study.
2. Identify fatigue and fracture behavior of thin plate with Stress
Concentration Factors (SCFs) for U and V notches.
3. Identify available Al-alloys in FKM lab, prepare and test the specimen under various fatigue loadings and SCFs.
4. Investigate and compare experimental results with predicted data or
5
CHAPTER 2
LITERATURE REVIEW
2.1 CYCLIC LOADING
6
Figure 2.1: Visual Examples of Axial stress, Torsional stress and bending stress
(Source: Syaziyah, 2007)
Figure 2.2: Example of Constant amplitude loading
(Source: Syaziyah, 2007)
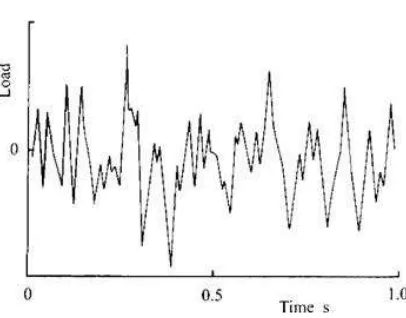
Figure 2.3: Example of Variable amplitude loading
7
2.1.1 Constant Amplitude Loading
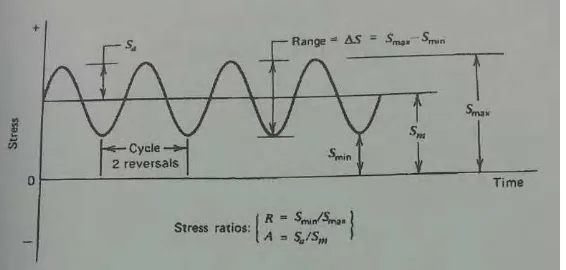
The Constant Amplitude Loading usually occurs in machinery parts such as shaft rods during period of steady state rotation. The cycling between maximum and minimum stress levels are maintained constant in Constant Amplitude Loading. Nomenclature used in fatigue design has been superimposed on the constant amplitude stress versus time curve as shown in Figure 2.4. Constant amplitude load histories can be represented by a constant stress range, ∆σ; mean stress, σmean; stress
amplitude or alternating stress, σamp; stress ratio, R and amplitude ratio, A. The stress
range is the algebraic difference between the maximum stress, σmax and the minimum
stress, σmin in the cycle
∆σ = σmax -σmin
The mean stress is the algebraic mean of σmax and σmax in the cycle
σmean = (σmax +σmin ) / 2
The alternating stress or stress amplitude is half the stress range in a cycle
σamp = (σmax -σmin ) / 2
= ∆σ / 2
The stress ratio, R represents the ratio of minimum to maximum stress
8 The amplitude ratio, A is used frequently in fatigue literature and is the ratio of stress amplitude to mean stress.
A = σamp / σmean
Figure 2.4: Nomenclature of Constant amplitude loading
(Source: Stephens, et al., 2001)
2.1.2 Variable amplitude loading
9
2.2 ALUMINUM-ALLOY
Aluminum alloys are alloys in which aluminum is predominant metal. The typical alloying elements are copper, magnesium, manganese, silicon, tin and zinc. There are two principal classifications, namely casting alloys and wrought alloys, both of which are further heat-treatable and non-heat-treatable and will be discussed in later session. One of the functions of aluminum-alloys in manufacturing fields is aerospace manufacturing since the introduction of metal skinned aircraft that gives properties of light-weight and less flammable.
2.2.1 Types of Aluminum-alloy
10
2.2.2 Casting Aluminum
The International Alloy Designation System is the most widely accepted naming scheme for casting alloys. In the Aluminum Association (AA) system, the second digits reveal the minimum percentage of aluminum, e.g. 150.x correspond to a minimum of 99.505 aluminum. The digit after decimal point takes a value of 0 or 1, denoting to casting and ingot respectively. The main alloying elements in the AA system are as follows:
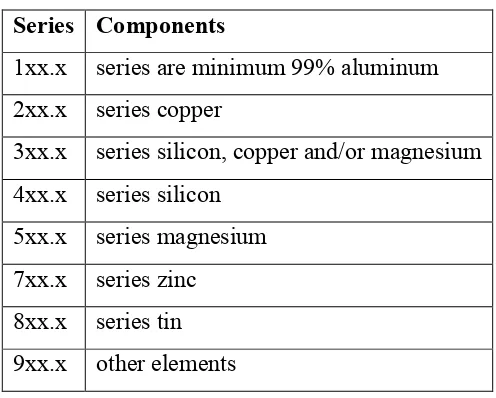
Table 2.1: Series of casting aluminum
Series Components
1xx.x series are minimum 99% aluminum 2xx.x series copper
3xx.x series silicon, copper and/or magnesium 4xx.x series silicon
5xx.x series magnesium 7xx.x series zinc
8xx.x series tin 9xx.x other elements
2.2.3 Wrought Aluminum
11
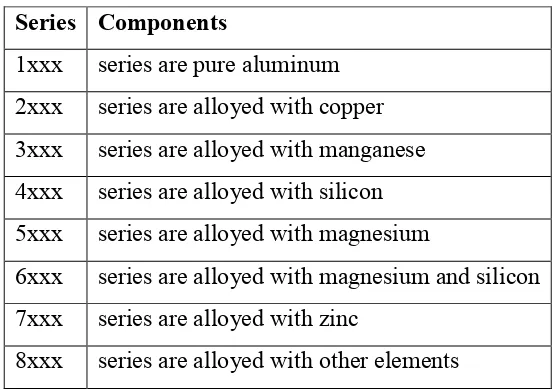
Table 2.2: Series of wrought aluminum
Series Components
1xxx series are pure aluminum 2xxx series are alloyed with copper 3xxx series are alloyed with manganese 4xxx series are alloyed with silicon 5xxx series are alloyed with magnesium
6xxx series are alloyed with magnesium and silicon 7xxx series are alloyed with zinc
8xxx series are alloyed with other elements
2.2.4 Properties of Aluminum and its alloys
The reasons of the widely usage of aluminum alloys are the importance of properties for the predominant metal of aluminum-alloys. Before introducing the properties of aluminum-alloys, the benefits of aluminum have to be understood and well-known.
2.2.4.1 Properties of Aluminum
12
i. Density: One of the best known properties of aluminium is that it is light,
with a density one third that of steel, 2.700 kg/m3. The low density of aluminium accounts for it being light weight but it does not affect its strength. Weight is important for all applications involving motion. The save of weight results in more payload or greater economy of operation. Low weight combined with the high strength possible with special alloys has placed aluminium as the major material for aircraft construction for the past sixty year.
ii. Electrical Conductivity: Aluminium is an excellent conductor of heat and
electricity. An aluminium conductor weighs approximately half as much as a copper conductor having the same conductivity.
iii. Non-Magnetic Property: Aluminium and its alloys are very slightly
paramagnetic, as it has a magnetic permeability (m) slightly greater than one. The low magnetic characteristic of aluminium is of value in military ship structure where it has advantages of lightless and lower cost over other non-magnetic metals.
iv. Corrosion Resistance: Aluminium has a higher resistance to corrosion