Community Forest Management
as a Carbon Mitigation Option
Case studies
Editors
Community Forest Management
as a Carbon Mitigation Option
Case Studies
Editors
Daniel Murdiyarso
Margaret Skutsch
National Library of Indonesia Cataloging-in-Publication Data
Community forest management as a carbon mitigation option: Case studies/edited by Daniel Murdiyarso and Margaret Skutsch. Bogor, Indonesia: Center for International Forestry Research (CIFOR), 2006.
ISBN: 979-24-4660-5 125p.
CABI thesaurus: 1. carbon sequestration 2. forest management 3. community involvement 4. community forestry 5. payment basis 6. incentives 7. case studies I.Title
@ 2006 by Center for International Forestry Research All rights reserved.
Cover photos by D. Murdiyarso, C. Dieng, R. Boer, E. Zahabu, D. Sheil, G. Villamor Design & Layout by Vidya Fitrian
Maps by Mohammad Agus Salim
Published by
Center for International Forestry Research Jl. CIFOR, Situ Gede, Sindang Barang Bogor Barat 16680, Indonesia
Tel.: +62 (251) 622622; Fax: +62 (251) 622100 E-mail: [email protected]
iii
Contents
Preface v
Promoting Carbon Benefits from Community Forest Management 1
Daniel Murdiyarso and Margaret Skutsch
Case Study 1. Kafley Community Forest, Lamatar, Nepal 8
Bhaskar Singh Karky
Case Study 2. Handei Village Forest Reserve, Tanzania 16
Eliakimu Zahabu
Case Study 3. Kitulangalo Forest Area, Tanzania 20
Eliakimu Zahabu
Case Study 4. Dhali Village, Utranchal, India 26
Ashish Tewari and Pushkin Phartiyal
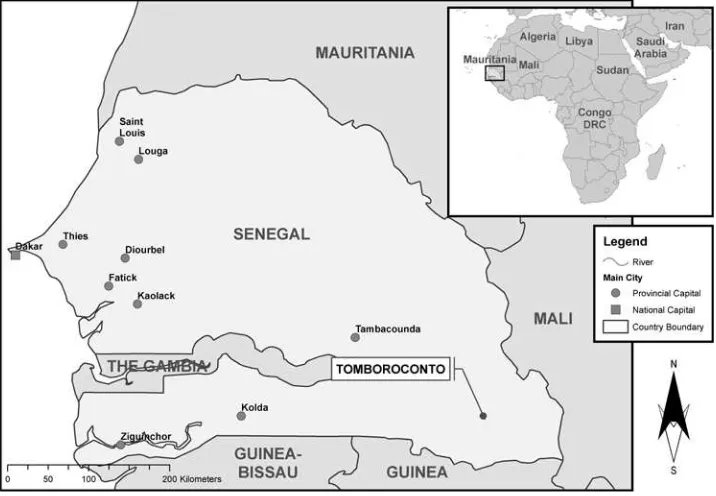
Case Study 5. The Regeneration of Tomboroconto Forest, Senegal 31 Libasse Ba
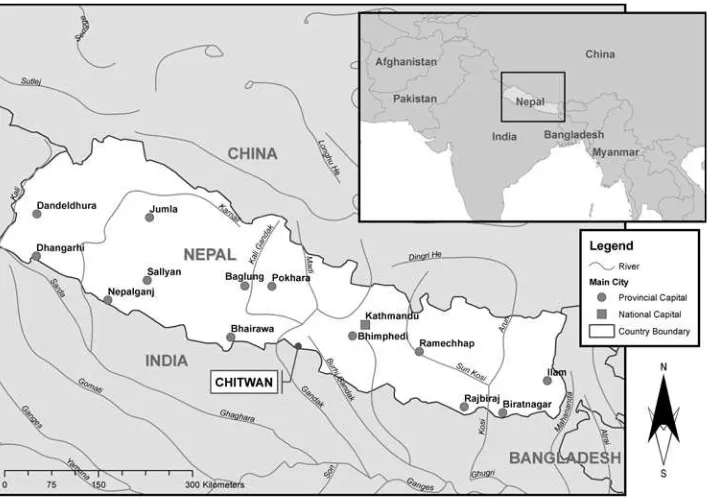
Case Study 6. Chitwan, Nepal: Will Poor People and Women Benefit Too? 35 Rupa Basnet Parasai
iv | Contents
Case Study 8. Laguna Lake Basin and Sierra Madre Community Forests,
the Philippines 51
Rodel D. Lasco and Florencia B. Pulhin
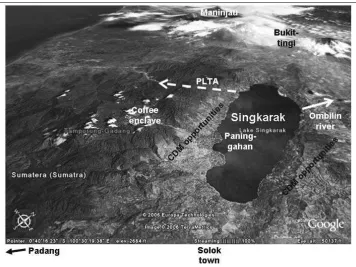
Case Study 9. Singkarak: Combining Environmental Service Markets
for Carbon and Watershed Functions? 60
Beria Leimona, Rizaldi Boer, Bustanul Arifin, Daniel Murdiyarso and Meine van Noordwijk
Case Study 10. Way Tenong and Sidrap: Tree Planting and Poverty
Alleviation, Indonesia 74
Desi Ariyadhi Suyamto, Meine van Noordwijk, Betha Lusiana, Andree Ekadinata
Case Study 11. Loksado Grassland Reforestation, Indonesia 85
Rizaldi Boer, James M. Roshetko, Hardjanto, Lala Kolopaking, Andri Akbar, Upik Rosalina Wasrin, Bambang Dwi Dasanto and Sri Rahayu
Case Study 12. Sidrap Community Reforestation of Unproductive
Grassland, Indonesia 94
James M. Roshetko, Rizaldi Boer, Hardjanto, Lala Lolopaking, Andri Akbar, Upik Rosalina Wasrin, Bambang Dwi Dasanto and Sri Rahayu
Case Study 13. Bombana Mixed-tree Species, Indonesia 107
Haris Iskandar, Daniel Murdiyarso, and Markku Kanninen
Lessons Learned 120
v
Preface
Community-based forest management has a long history. Countries and communities have had different experiences and have found different ways of creating with institutional settings to nurture this participatory way of managing forest; and there have been success and failure stories. Many of the arrangements were aimed at providing the community with access to public lands so that they contribute to sustainable natural resources management. Timber and non-timber forest products have been the main commodities for their livelihoods including the market mechanisms. To a lesser extent communities have been involved in conservation activities.
The climate change regimes could provide opportunities for smallholder farmers in developing countries to participate in mitigating atmospheric carbon, but this idea has not been well understood and the capacity is not in place. A number of activities have been undertaken by a number of institutions with primary goal to explore opportunities and remove the barriers. Many lessons can been learnt from the activities of formal and informal organisations who have been involved in supporting community-based forest management initiatives.
The materials presented in this publication are derived from research and capacity building projects inanced by various funding agencies. These include, irstly, “Kyoto: Think Global, Act Local” - an action research for sustainable forest management, inanced by the Netherlands Development Cooperation and coordinated by Technology and Sustainable Development Section of the Centre for Clean Technology and Environmental Policy, University of Twente, Enschede, the Netherlands. Secondly,
“Carbon Sequestration through Clean Development Mechanism” - a Technical Assistance to the Government of Indonesia (TA-4137 INO), funded by the Asian Development Bank (ADB) and coordinated by the Center for International Forestry Research (CIFOR). Thirdly, “Rewarding Upland Poor for Environmental Services (RUPES)”, supported by the International Fund for Agricultural Development (IFAD) and coordinated by the World Agroforestry Centre (ICRAF) Southeast Asia.
vi | Preface
• International Institute Geo-information Science and Earth Observation (ITC) Enschede, Netherlands
• Environnement et Developpement du Tiers-Monde (Environment and Development Action, ENDA), Dakar, Senegal
• International Center for Integrated Mountain Development (ICIMOD), Kathmandu, Nepal
• Department of Geography, University of Dar es Salaam, Tanzania
• The University of the Philippines at Los Banos (UPLB), Laguna, the Philippines
• The Land Management and Grant College, Bogor Agricultural University (IPB), Bogor, Indonesia
• Winrock International, Washington DC., USA.
Each of these organisations has in turn involved local organisations in the research, including the King Mahendra Trust for Nature Conservation in Nepal; the Central Himalayan Environmental Association in Uttranchal, India; Sokoine University of Agriculture in Tanzania; the PROGEDE project in Senegal and the Mali Folk Center in Mali; Kalahan Education Foundation Inc., Philippines; Conservation International - Philippines; CARE International, Philippines; Nagari Paninggahan-Solok District, Indonesia; Amandit Cooperative, Indonesia; Green Law, Indonesia; and Lestari Foundation, Indonesia. We are most grateful to Neil Bird of the Joanneum Institute for his insightful comments and critiques on Case Studies 1 to 6.
The views expressed in this publication are those of the project members and do not necessarily represent those of the funding agencies. It is hoped that by putting these experiences in the public domain, the potential of activities such as those carried out by the communities represented in the case studies, will be made known to the rest of the world. These communities have shown themselves to be receptive to the new idea of ‘carbon forestry’ and have the capacity to negotiate to improve their livelihoods while at the same time being part of the solutions to the global problem.
1
Promoting Carbon Benefits from
Community Forest Management
Daniel Murdiyarso
1and Margaret Skutsch
21Center for International Forestry Research, Bogor, Indonesia
2Technology and Sustainable Development, University of Twente, the Netherlands
Introduction
Deforestation in the tropics is a major source of carbon emissions and an active contributor to global warming. The Intergovernmental Panel on Climate Change (IPCC) estimated that 1.7 billion tons of carbon is released annually due to land use change, of which the major part is tropical deforestation (IPCC 2001). This represents 20%–25% of current global carbon emissions. Deforestation emissions from Brazil and Indonesia alone are equivalent to the entire reduction commitment of the Annex 1 countries during the irst commitment period.
Under the current agreements in the Kyoto Protocol and the Marrakech Accords, this enormous source of emissions is not addressed. Possibilities under the protocol’s Clean Development Mechanism (CDM) are limited to afforestation and reforestation, known as AR CDM. In other words, they allow for planting of new trees to establish additional sinks, but they do not allow crediting for reduction of emission from existing sinks through sustainable forest management. To date almost 1000 CDM projects are undergoing or have undergone the approval process, but almost all of these are in the energy sector. Of the 39 approved methodologies only three are from the forestry sector, and of the 11 million CERs1 issued so far, none is
from the forestry sector. Thus as far as AR CDM is concerned, precious little progress has been made.
Time is running out; huge strides have to be made if the reduction target agreed for the irst commitment period is to be reached. It is essential that the role of forestry in emissions, and the potential role of forest management in mitigating climate change,
2 | Promoting Carbon Beneits from Community Forest Management
is taken more seriously. How can the contribution of AR CDM be strengthened, and are there alternatives to CDM? What could the role of non-Kyoto-compliant projects be? What opportunities do bundling of ecosystem services (payments for watershed protection services and biodiversity conservation together with carbon) present? What type of approach could be scientiically sound, economically viable and politically correct, and achieve sustainable development in keeping with the objectives of CDM?
In response to calls from a number of parties to revisit deforestation in the climate agenda, the Eleventh Session of the Conference of Parties (CoP11) to the United Nations Framework Convention on Climate Change (UNFCCC) in December 2005 initiated a-two year process for the consideration of a policy for ‘reduced emissions from deforestation’ (RED). This debate is ongoing, and covers political issues, methodological challenges and alternative inancial mechanisms that might be employed if such a policy were to be adopted. A workshop on carbon forestry held by the Center for International Forestry Research (CIFOR) in 2005 (Murdiyarso and Herawati 2005) addressed many of these issues, and the current publication takes the discussion further.
The collection of case studies presented in this document attempts to explore opportunities to promote the participation of local communities in various countries with a range of socio-economic settings and institutional challenges. They fall into two groups. The irst considers cases of communities that are already involved in community-based forest management in a variety of settings and have been trained to make assessment of the changes in carbon stock in these forests over time. The forest-dependent communities were earlier unaware of carbon beneits but have shown themselves well capable of monitoring these. The purpose was to enable them to access emerging voluntary carbon markets (Murdiyarso 2004) or, in the long term, to engage in processes that could be rewarded under RED initiatives. The second group concerns small-scale AR CDM projects. It is shown that while maintaining climate integrity, these small-scale AR CDM projects with simpliied procedures should be able to promote rehabilitation of degraded lands if they obtain inancing through Kyoto markets. In both sets of cases, the main barriers are institutional ones and the transaction costs incurred. Bundling several projects that are physically close to one another may be a way of reducing these barriers.
Deforestation and Degradation
Daniel Murdiyarso and Margaret Skutsch | 3
Much deforestation is the result of planned activities necessary for development. It is an inevitable (though regrettable) side effect of rational choices made by governments and individuals, which bring about land use change for the sake of greater production. The expansion of area under cultivation for food crops and under pasture may be a priority for economic growth, for feeding the growing population and for earning export income. Conversion of forest to plantation crops increases national income. Logging provides essential funds for investment in development. Cities grow and infrastructure is constructed as part and parcel of modernization and the increasing scale of the economy. These are governed activities, which for the most part cannot and should not be stopped; they are essential for development. At best, the impact on forests may be softened by ensuring good coordination between sectors and overall land use planning, the use of more sustainable timber extraction methods and the encouragement of agricultural systems that retain as much carbon as possible.
Yet there is a great deal of what may be called ‘ungoverned’ deforestation going on as well. In many places, this starts with degradation, the gradual reduction of stocks of biomass within the natural forest. Degradation results from extracting more biomass from the forest than it can sustainably produce. Levels of biomass—and therefore of carbon—dwindle; slowly at irst, but gradually the forest thins out more and more until one can say that in essence the area is deforested. Often this is not the result of a single or coordinated and rational decision to clear the forest, but of a number of processes that have to do with the livelihoods of people nearby. Grazing of cattle within the forest prevents regeneration of saplings and shrubs; overharvesting of wood for the production of charcoal to sell in the cities overstresses the productive capacity of forest; slash-and-burn agriculture, a traditional and normally sustainable forest land use, becomes devastating if the fallow cycle is too short to allow the forest to recover.
Local people are well aware of the impact of these activities on the forest and of their negative implications. There are two sets of reasons why they continue to carry them out. First, there is usually no alternative means of making an income, and second, the forest is to all intents and purposes an uncontrolled resource. The state owns the majority of the forest, but apart from heavily protected areas such as nature reserves, most is de facto open access. With no rules for usage, or no enforcement of rules, each individual makes the most of his or her opportunity, because if not, someone else will—the tragedy of the commons, or, as it may more correctly be described, the tragedy of the open access resources.
4 | Promoting Carbon Beneits from Community Forest Management
and degradation’(REDD)is the most appropriate general term for actions designed to curb these processes.
Community Forest Management for Reducing
Degradation
In recent years the inability of the state to control degradation of forest has been recognized in many countries. Governments are seeing the beneits of handing over forest areas to local communities under a variety of community forest management schemes in Burkina Faso, Cameroon, India, Mexico, Nepal, Papua New Guinea, Peru, Tanzania and many other countries, and it is estimated that around 14% of all forest in developing countries is under this kind of management today, three times more than 12 years ago (White and Martin 2002). Under such schemes, villagers get the formal, legal rights to use and proit from the forest products, under jointly agreed management plans which ensure that off-take is kept at sustainable levels. Communities organise themselves by setting by-laws and by self-regulation as regards access to forest products. Their motivations to take part in such a scheme can be various: to maintain the forest to ensure future beneits is a clear overall reason. For some, it is to ensure a continued supply of irewood and fodder; for others, to enable eco-tourism; yet others participate in the hope that the wild animals that have disappeared from the shrinking habitat will return and provide a means of sustainable subsistence in the future. In a few, sustainable timber off-take is the aim. The beneits are usually small in inancial terms, but real and tangible in non-monetary ways. In some countries, like Indonesia, where a social forestry scheme was adopted, status and function of the designated forest lands remain unchanged (state forest lands). The participation of the local community is considered a means to promote sustainable livelihoods and to reduce further degradation of forest resources. The local people obtain the right to utilize forest resources within the context of social forestry, for which special permits from the government are required. Regulatory barriers and lack of any major income-earning opportunity may hinder or deter local communities from participating on a voluntary basis.
But initial experiences of such community forestry are by and large positive. Areas that are community managed are clearly distinguishable from surrounding areas that are not, as natural regeneration appears to be taking place and biomass becomes denser, so that instead of being a net emitter of carbon, the forest becomes a sink. Furthermore, it is probable that without such management, the biomass would decrease, through forest degradation, leading to additional carbon emissions. As the case studies in this book show, the gains could be anything from 1 to about 5 tons per hectare per year, depending on the type of forest. Although this reduction cannot today be credited under the Kyoto Protocol, the studies indicate the potential that this kind of activity could offer as a carbon mitigation strategy in the future.
Small-Scale AR CDM Projects
Daniel Murdiyarso and Margaret Skutsch | 5
with monetary incentives derived from the sale of carbon credits. The second set of case studies demonstrates for cases in Indonesia and the Philippines what the local beneits might be, as well as the estimated carbon mitigation. Several of these studies also consider the potential for bundling incentives for carbon mitigation with other environmental services (catchment protection, biodiversity conservation, aesthetic qualities of the landscape etc.), under Payment for Environmental Services systems. The underlying principle of such payments is that landscapes provide valuable positive externalities to off-site beneiciaries, but that these may not be taken into account by on-site landowners or users unless the beneiciaries pay them. One possibility is that payment from multilateral funds (e.g. Global Environmental Facility) might be forthcoming to cover incremental costs of sequestering extra carbon in biodiversity or watershed conservation projects.
If carbon has a monetary value, could payment for reduced emissions from deforestation, or tree planting under AR CDM act as an incentive for this kind of forest management activity at the local level? Would it stimulate more communities to adopt simple management rules over much larger areas of natural forest, to bring rates of extraction into balance with the forests’ natural capacity to reproduce, and to plant and maintain trees? If this were the case, then many parts of the forest in tropical areas might be involved in reducing carbon emissions, and very many small communities might earn some income from this new service. Naturally, there would be many additional positive side effects, not least the maintaining of biodiversity, water management, erosion control and the ight against desertiication. Many of our case studies address the question of the costs and beneits to local people of engaging in forest management and tree planting activities, in relation to expected monetary values of carbon.
What Do We Need to Know?
In order to assess this possibility in more depth, it makes sense to look carefully at community forest management (CFM) experience and evaluate its impact on carbon stocks. There is a number of questions that would need to be addressed, such as: • What rates of degradation and carbon loss are typically occurring in unmanaged
forests?
• What sorts of management activities are used by communities under CFM schemes and how much carbon is saved as a result?
• Is there leakage to other areas? How much? • What is the opportunity cost of this management?
• How could the carbon stock changes be measured and monitored in a cost-effective manner?
• What would be the possibility of bundling several environmental services to reduce transaction costs?
• Will small-scale AR CDM be attractive to investors? What would be the potential barriers to be removed?
A research project funded by Netherlands Development Cooperation entitled
6 | Promoting Carbon Beneits from Community Forest Management
potential for community carbon forestry, providing the irst six cases presented here. Working with local non-governmental organisations (NGOs) and research institutes in Guinea Bissau, Mali, Nepal, Senegal, Tanzania, Uganda and Uttranchal (India), communities already engaged in local forest management have been trained in the use of a small, hand-held computer with global positioning and geographic information systems equipment, which enables them accurately to map the boundaries and the strata in the forest—a prerequisite if carbon savings are to be veriiable. Further they have been trained in standard forest inventory methods, using ixed sample plots, and in entering this data into a tailor-made database on the computer. None of these villagers has more than 7 years of primary education, and none of them had ever seen a computer before, but this is no hindrance. The local NGOs help in the training, maintain the computers and supervise the laying out of sample plots to ensure that carbon measurements meet rigorous scientiic standards.
Another set of studies and capacity-building exercises was carried out in Indonesia and supported by the Asian Development Bank (ADB). It involved national and local governments in four districts of West Lampung (Sumatra), Hulu Sungai Selatan (Kalimantan), Sidrap and Bombana (Sulawesi). The main objective of the activities was to technically assist the governments and participating smallholders in developing CDM projects. They are categorized as small-scale AR CDM leading towards preparation of the Project Design Document (PDD).
In order to enhance the livelihoods and reduce the poverty of upland poor in Asia while supporting environmental conservation at global and local levels, another scheme aiming at Rewarding Upland Poor for Environmental Services (RUPES) was established. This involved three upland communities in Indonesia and the Philippines through policy support in the form of direct involvement in local governance, implementation of global convention, integrated natural resources and community-based forestry. Local communities in Ikalahan, Laguna and Sierra Madre in the Philippines were engaged, whereas the Indonesian case involved Minangkabau village in Singkarak, West Sumatra.
Having presented all these cases we draw some lessons learned and consider ways forward as regards inancial mechanisms that could be used to support community carbon forestry. We hope to demonstrate that carbon payments can act as an important stimulus in the reduction of forest degradation over a large part of the tropics, as well as provide an incentive for local communities to engage in tree planting and tree-based agriculture. In this way, poor, local communities may become directly involved in activities that mitigate global carbon, while at the same time providing a sustainable livelihood for many marginalized people.
References
DeFries, R., Achard, F., Brown, S., Herold, M., Murdiyarso, D., Schlamadinger, B. and de Souza Jr., C. 2006 Reducing greenhouse gas emissions from deforestation in developing countries: considerations for monitoring and measuring. J. Environ. Sci. and Policy.In Press.
Daniel Murdiyarso and Margaret Skutsch | 7
IPCC 2001 Climate change 2001: the scientiic basis. Contribution of Working Group I to the IPCC Third Assessment Report. Cambridge University Press, Cambridge.
Murdiyarso, D. 2004 Implications of the Kyoto Protocol: Indonesia’s perspective. International Review for Environmental Strategies 5(1): 145–154.
Murdiyarso, D. and Herawati, H. 2005 Carbon forestry: who will beneit? Proceedings of a Workshop on Carbon Sequestration and Sustainable Livelihoods. CIFOR, Bogor, Indonesia.
8
Case
Study
1
Kafley Community Forest, Lamatar,
Nepal
Bhaskar Singh Karky
King Mahendra Trust for Nature Conservation, Nepal
Introduction
Community forest plays a prominent role in the hills of Nepal where agriculture and livestock rearing and forest are strongly interlinked. Based on the 1976 National Forestry Plan, the government of Nepal made a policy to involve local communities in forest management, with a view to tackling deforestation and the deteriorating state of the forest all over the country. By 2004 about 25% of all national forests, or around 1.1 million ha, were being managed by Community Forestry User Groups (CFUGs). There are more than 13,000 CFUGs in the country, involving 1.4 million households (i.e. 35% of population) (Kanel 2004), mostly in the hilly regions of Nepal. The Federation of Community Forest Users Nepal (FECOFUN) has grown over the years to become the largest organisation in the country.
The impact of this policy in the forestry sector has been positive. Where communities are managing their forests, the degradation trend in the hills has been checked. Forest conditions have improved in most places with positive impacts on biodiversity conservation. Communities have easier access to irewood, timber, fodder, forest litter and grass. Soil erosion has been mitigated and water sources have been conserved in such areas.
Bhaskar Singh Karky | 9
This case study looks at one example, the community forest in Lamatar, to demonstrate that in addition to other forest beneits, community forest management results in increasing carbon sequestration and also quite probably in decreasing emissions.
Brief History of the Kafley Forest
Lalitpur district has 15,253 ha of forest of which 9,993 ha are managed by 162 CFUGs. Kaley Community Forest is one of these. It is a block of 96 ha which is being managed by the Kaley CFUG, which consists of 60 households. This forest lies at an elevation of between 1,830 and 1,930 m (see Figure 1.1) and is dominated by temperate broad-leaved species, particularly Schima sp. (katus) and Castanopsis sp. (chilaune).
1 ‘Birta’ = land or forest grants from the State
The tradition of community managed forest here is not new, what is new is the formalization of the traditional management practice in modern terms. Villagers recalling the history of their forest management explain that the forest in the Kaley area historically belonged to the Ghimere family, who were Brahmins living to the south of the main valley. They had agricultural lands in the fertile valley below the hills; the hills themselves were unsuitable for agriculture and were covered with forest. They were granted this forest as Birta1 by the State for services rendered. It is told
10 | Case Study 1. Kaley Community Forest, Lamatar, Nepal
that the forest was rich in biodiversity at that time, as it was well managed. In 1957, however, this forest, like all forests in Nepal, was nationalized. After that, as narrated by the locals, the forest gradually decreased, both by outright deforestation (loss of forest area) and in terms of degradation (loss of biomass within the forest). Noticing this change, the Department of Forestry carried out a reforestation programme in 1978 by developing a sallo plantation (Pinus roxburghii) and putting forest guards in place to protect it. But deforestation and forest degradation continued unabated, converting the entire hilly area to almost barren land by the early 1980’s. Unregulated livestock grazing and fodder collection were the major causes of forest degradation as they prevented natural regeneration, while unrestricted fuelwood and timber collection were the major cause of deforestation. This was a classic case of the tragedy of the open access; anyone and everyone had unlimited access any time because the state owned the resource and it was managed by their staff, to whom the local people did not feel answerable.
The scenario at Kaley was occurring all over the country which meant that Nepal was losing forests at a rapid rate especially in areas adjacent to settlements. In the late 1970’s however a paradigm shift occurred, when foresters began to realize that forest protection and management was not possible without involvement of the local people. Between 1975 and 1993, a series of milestone decisions brought about the community forestry policy that we see practiced so widely in Nepal today. Most of the handing over of forests to the local communities took place in the 1990s. In Lamatar this happened in 1994, a year after the formation of the Kaley Community Forest User Group. Since then, forest has been managed effectively with strict restrictions and user guidelines and norms. Forest degradation and deforestation have been checked and forest regeneration (which is mainly natural regeneration) is taking place after stringent protective measures were deployed by the local people through the CFUG. Today the forest is recuperating ecologically and already has a rich diversity in tree species. One of the most important resources obtained from this forest is water. This forest has several springs which are carefully protected and used by the village for drinking purposes, at no charge to the users. It has been reported that the low of water has markedly increased with the rejuvenating forest ecosystem.
Management Regime
Bhaskar Singh Karky | 11
Community management of forest entails numerous tasks which the locals perform. Technical ones are undertaken with the support from the government forest rangers. Community management practices witnessed in the Lamatar area can broadly be classiied into protection, administration, harvesting and forest management.
Protection is a major task and often the most expensive as well. CFUG has not hired anyone for patrolling the forest but is divided into subgroups taking the responsibility for patrolling on a rotational basis. While working at home or in the ield below the forested hill, people keep an eye on the hillside and watch their forest for irregular movements, such as illegal logging, animal grazing or forest ire. In the past, people have been able to ight forest ires after seeing them from the ield and rushing to the site immediately. It is compulsory for all members of the CFUG to participate in putting out ires, with penalties for failure in this regard. Penalties are in fact used for deterring all kinds of unsustainable forest resource extraction. Monetary ines are ixed by the CFUG meeting, with different rates for the illegal collection of fodder and litter, sand, gravel and stones, timber and fuelwood and bamboo, at times when such activities are not permitted. Hunting is permanently banned; grazing livestock and charcoal making likewise. Fencing as a protective measure is however not found here. It is the promulgation of these restrictions on use that has been the main management intervention and which has resulted in avoided forest degradation and deforestation.
The willingness of the community to implement these forest protection measures is related to and dependent on the pay-back they derive. It is clear to people in the Lamatar area that strict conservation measures, which are designed to maximize natural regeneration, in practice result in the harvesting of greater quantities of forest resources, and this is the incentive to cooperate in forest management under the CFUG.
Community forestry also entails numerous administrative tasks such as calling and organizing meetings, conducting elections, recording and minuting meetings, maintaining accounts, getting accounts audited, etc, as well as those directly connected with forest activities such as setting dates for extracting resources and circulating the information, and developing the management plan and ive-year operational plan with the assistance of a ranger. In Lamatar, such oficial administrative processes were found to be conducted rather professionally although not all CFUGs in Nepal are able to maintain such high standards in this regard.
Table 1.1 shows the balance accumulated by Kaley CFUG which over the last
seven years, which overall has been increasing.
Annex 1 shows the inancial low of the Kaley CFUG between iscal years
2001/2002 to 2004/2005. From it we see that 13% of the inancial income from 2004/05 was spent on school and Red Cross activity in the village, while in the year before that 16% was spent on college and school building repairs.
12 | Case Study 1. Kaley Community Forest, Lamatar, Nepal
process, and the timber is sold through a bidding process to anyone, including people from outside the village. Fuelwood, fodder, litter, nigalo and NTFP on the other hand can be collected by CFUG members when the forest opens; the FUC decides on the days and dates on which harvesting of these products is allowed in the different seasons and accordingly informs all CFUG members. Members pay a small fee for irewood and bamboo, but fodder and litter are free. From records held by the CFUG, it appears that each household extracts about 1000 kg of green fuelwood, 500 kg of dry fuelwood, 500 kg of grass fodder, 1000 kg of leaf litter and 500 kg of nigalo every year. On special occasions such a marriage, religious ceremony or funeral, 350 kg of fuelwood can be harvested by any CFUG member for the same price. Products extracted collectively after an operation such as thinning or clear cutting are distributed equally among the users. Members of the CFUG may sell any of their personal excess of these products to non-members within the village, but they may not be sold commercially outside the village. Sale of timber is the largest source of income for CFUG, followed by fuelwood fees, as shown on Annex 1. But unlike timber, fuelwood is extracted by the CFUG members only for fulilling their subsistence needs and that of their fellow villagers, and though inancially it is lower in value in terms of its contribution to the CFUG income, volume-wise it is the main resource extracted.
Most locals in Lamatar have their own clear understanding of silviculture as they have been interacting with forest even before going to school. Some of the locals can identify all the tree species in their forests, though the older men seem to be more knowledgeable on this than younger ones. Some of the activities they conduct on a regular basis include weeding, cleaning, pruning/branch cutting, singling, thinning, clear cutting and regeneration management. The CFUG has maintained demonstration plots using modern techniques to propagate a number of species such as Chilaune (Schima wallichii) and Jhingane (Eurya acuminate) as well as several additional varieties of NTFPs (e.g. cardamom, fodder grass). In future Kaley CFUG intends to develop a forest nursery and also increase the number of medicinal plants in the forest.
Table 1.1. Kaley CFUG inancial balance
Annual savings of Kafley CFUG
Fiscal year Rs.
2004/05 22,699 2003/04 6,910 2002/03 19,285 2001/02 3,081 2000/99 17,245 1999/98 6,254
Bhaskar Singh Karky | 13
Forest Inventory
As a result of participation in the Kyoto: Think Global Act Local project, members of the CFUG were trained in forestry inventory and mapping and conducted their own forest carbon stock assessment. Data from this is now available for two consecutive years. The igures in Table 1.2 show very high number of stands and yet a low biomass per hectare (91.76 t ha-1) indicating that the forest is mostly at a young stage
with vigorously regenerating saplings. However, in addition to the above-ground biomass as measured by the community, it would be possible to calculate the below-ground biomass using standard biometric equations, which would augment the annual carbon gains.
2 Carbon stock based on above ground biomass in trees of over 5 cm diameter only (carbon in other pools such as shrub layer and litter layer, soil etc is not included).
Table 1.2. Biomass data for Kaley CFUG in Lamatar
Lamatar Units 2005 2006
Above ground live biomass in 8 plots kg 7,236.68 7,444.37 Above ground live biomass per ha t 90.46 93.05 C per ha2 t 45.2 46.5
Increase in C per ha t/year + 1,30 Carbon dioxide equivalent t/year + 4.78 Total tree count in 8 plots 152 159 Tree per ha 1,900 1,988 Average dbh per tree cm 9.33 9.39 No of species 22 21
This is also veriied by the looking at distribution of dbh (diameter at breast height) measurement as shown in Table 1.3, where it is clear that most of the trees are relatively young (nearly 75% have dbh ranging between 5 to 10 cm). This is because the forest was only handed over in 1994; it is only since then that forest protection measures were taken up by CFUG, allowing the forest to regenerate.
Table 1.3. Percent distribution of tree dbh class in Kaley CFUG
Dbh Classes (cm)
5 -10 11 - 20 21 - 30 31 - 40 41 - 50 51 - 60 61 - 70 > 70
Year 1 71.71% 22.37% 3.95% 0.66% 1.32% 0.00% 0.00% 0.00% Year 2 72.96% 20.75% 5.03% 0.63% 0.63% 0.00% 0.00% 0.00%
14 | Case Study 1. Kaley Community Forest, Lamatar, Nepal
If further analysis shows that this trend persists, it means that the CFUG is responsible for the additional sequestration of around 440 tons of carbon dioxide per year over its total area of 94 ha, which assuming a conservative price of $2 after transaction costs could bring in an income of some $880 per year (Rs. 58,400 at $1 = Rs. 73) – a signiicant cash income for the community, comparing this to their inancial statement where the total annual inancial income has never been more than $6003. This is in addition to the reduction in emissions that would have occurred if
there had been no forest management and the forest had continued to deteriorate in the way it was going before the CFUG started its work. It also excludes the fact that if the forest had been allowed to degrade, dependency on and consumption of imported fossil fuel for cooking would probably be much more than now. Whether the community might also claim for this carbon, would depend on how the baseline would be constructed, and over what historical period it would rest. For example, if it were based on the rates of deforestation and degradation prior to 1994 which were on the order of 5% loss of biomass per year, the total carbon stock increases would be around 7% per year or 3-4 tons carbon stock, with corresponding inancial implications.
Since community forest management has been promulgated for many years in Nepal, with about a quarter of all national forest now managed in this way, it would be dificult to argue that the forest management activities of villages like Lamatar are truly ‘additional’ in Kyoto terms. On the other hand, it is clear that there is very little leakage, since all the forest in the area is managed by other CFUGs on more or less the same terms. There is simply no forest around in which the leakage could occur.
Would there be then, in principle, justiication for CFUGs and their members to claim the monetary value of all the carbon that is being sequestered, and/or the carbon that is retained rather than lost to deforestation, if a policy for crediting reduced emissions from deforestation is adopted by UNFCCC? Or should payment only be claimed for increases over an above what has been achieved in the past?
These questions do not yet keep the members of the CFUG awake at night, but they are questions that need to be answered in a fair and environmental sound way in the very near future.
References
Kanel, R.K. 2004 Twenty Five Years’ of Community Forestry: Contribution to Millennium Development Goals. In: Kanel, R.K., Mathema, P., Kandel, B.R., Niraula, D. R., Sharma, A. R. and Gautam, M. (Eds.). Twenty-ive Years of Community Forestry: Proceedings of the Fourth National Workshop on Community Forestry 4-6 August, 2004, Kathmandu. pp 4-18.
B
hask
ar S
ingh K
ar
ky
|
15
Annex 1. Financial Statement of Kaley CFUG
2004/2005 2003/2004 2002/2003 2001/2002
Income titles Rs. Income titles Rs. Income titles Rs. Income titles Rs.
Membership charge 550 Membership charge 920 Membership charge 610 Membership charge 1,990
Sale of irewood 869 Sale of irewood 2,726 Sale of irewood 2,417 Sale of irewood 3,338
Sale of timber 18,558 Sale of timber 11,039 Sale of timber 18,095
Sale of ghaga 1380 Sale of ghaga 671 Sale of nigalo 100
Sale of ghaga 7,090 Sale of forest product 760
Interest from Bank 6,527 Interest from Bank 5402 Interest from Bank 3,780 Interest from Bank 1,566
Service charge 2,040 Sale of dry twigs 412 Sale of dry twigs 346
Prize from VDC and DDC 6,100 DDC training fund 19,070 Sale of tree 1,536 Grant from VDC 1,000
Rent of cooking utensils 120 Dried and burnt tree 796
Total 41,854 Total 40,537 Total 27,521 Total 9,896
Expenditure titles Rs. Expenditure titles Rs. Expenditure titles Rs. Expenditure titles Rs.
General assembly 3,600 General assembly 3,607 General assembly 1,231 Inventory 542
Stationery 1,069 Stationery 647 Stationery 722 Stationery 698
Forest User Committee 350 Forest management 1077 Member charge in
kalyankari
1,379 Forest User Committee 100
Advertisement of timber sale
5,186 Training 17,570 Educational tour 670 Training 3,120
Transport 750
Range post coordina-tion committee
820 Road construction 2,000
Range post coordina-tion committee
100
Bamboo plantation 350 Auditing charge 300 Acc. Closing charge 100
Tax for interest 316 Tax for interest 316 Banner 120 Banner 1,335
Le pa charge 50 Construction of
chautaro 1,294 Loss of daak 233 Purchase dade 160
Depreciation 266 Depreciation 282 Depreciation 135 Depreciation 238
Miscellaneous 1,157 Miscellaneous 1,088 Miscellaneous 682
Donations Donations Donations
1. School 5,200 1. School 1,125 1. School 1,600
2. Red Cross 400 2. College 5,501
16
Case
Study
2
Handei Village Forest Reserve,
Tanzania
Eliakimu Zahabu
Sokoine University of Agriculture, Tanzania
Introduction
Eliakimu Zahabu | 17
Handei Village Forest Reserve
Handei village forest reserve is located in the Eastern Usambara mountains in Tanga region and is just outside the Amani Nature Reserve (Figure 2.1). It consists of 156 ha of sub-montane evergreen forest characterized primarily by Parinari excelsa, Sapium ellipticum, Cynometra sp.and Alanblackia stuhlmannii. Part of the forest is on hanging rocky cliffs harboring Saintpaulia usambarensis (African violet) species that
attracts ecotourism. The forest has been under community based forest management by residents of Magambo-Miembeni village since 1996. Formerly, the forest was under open access and suffered considerably from agricultural expansion and uncontrolled harvesting mainly for commercial timber and building material, the consequence of which were changes in microclimate of the area and drying up of important water sources to the local communities.
With current management, utilization is conined to a buffer zone of 50 m from all sides of the forest boundary, the interior part of the forest is for protection without utilization. Uses permitted in the buffer zone include: ecotourism, timber harvesting, collecting dry irewood, vegetable, mushroom and collection of traditional medicines. To ensure proper utilization, the village has set down various bylaws on how and when these forest products can be utilized, the general idea being that utilization is done in a sustainable manner.
There is a village forest committee composed of twelve members (currently four women and eight men) operating under the village government that manages the forest. The committee is responsible for all activities regarding the forest, these
18 | Case Study 2. Handei Village Forest Reserve, Tanzania
include: selecting forest guards, monitoring of all activities conducted in the forest such as enrichment planting in open areas of the forest, provision of permits for various activities such as harvesting of timber and collection of fees from ecotourism. It is also responsible for following up on legal issues pertaining to the management of the village forest reserve.
The committee reports on a monthly basis to the village government, district forest oficer and a local supporting organisation (the Amani Nature Reserve conservation ofice). The role of the district forest oficer and the supporting organisation is to provide technical support to the forest committee and interpretation of policy guidance.
Carbon Stock Changes as a Result of Management
Activities
As a result of participation in the Kyoto: Think Global Act Local project, ive members of the Forest Committee (three men and two women) were trained in mapping techniques using GIS/GPS on a hand held computer and in standard forest inventory methods as described in the IPGG Good Practice Guide (Penman et al. 2003). They established 19 sample plots of 5.6 m radius, laid out at intervals of 218 m using transects separated by 286 m. Locally derived allometric equations were used to calculate the total biomass and to convert this into tons of carbon stock. Below ground carbon stocks were not estimated but in principle could be calculated and added to the total.
Table 2.1 shows the stand parameters for Handei village forest reserve. Observed
stem numbers in this forest are comparable to other forests in similar (protected) site conditions while volume, biomass and carbon per hectare are generally lower. This is probably because the forest is still regenerating following previous disturbances including agricultural ields with few trees. However, analysis of data between 2005 and 2006 shows that the forest is growing and has sequestered about 3 tons of carbon per hectare in the year interval between the two measurements. Data for several more years will need to be collected before a growth curve can be drawn, but the evidence is clear: the forest is increasing in carbon stock as a result of the management practices used by the villagers.
Table 2.1 also shows that the tree stocking in terms of volume, biomass and
carbon in the general land of this village (unmanaged forest) is about half of that in the reserve forest. The reserved forest has fewer trees, but these are of large sizes with
Table 2.1. Stand parameters for Handei Village Forest Reserve
Year N
(stems/ha) V (m3/ha)
Biomass (t/ha) Carbon (t/ha) CO2 (t/ha) Area (ha)
Total CO2 (t)
Handei VFR 2005 926 261.2 151.5 74.2 278.3 156 42,480.1
Handei VFR 2006 643 272.0 157.9 77.4 284.1 156 44,311.6
Unmanaged forest outside the VFR
Eliakimu Zahabu | 19
correspondingly large volume, biomass and carbon contents compared to unmanaged forest, which in contrast has many very small trees.These unmanaged areas are forest in which some subsistence agriculture is being done, particularly on small hillside plots. These small farms are not fully cleared but retain some trees as part of the local agroforestry practice. These are also alternative sources of fuelwood and timber for construction.
The managed forest clearly shows an increase in carbon stocks due to the suppression of unsustainable harvesting of fuelwood and charcoal, of around 5 tons CO2 per hectare per year. The village forest management regime is thus sequestering a considerable amount of carbon as shown above. From the data so far available, it is not clear to what extent emissions are being reduced in addition, since the rate of depletion of forest in the unmanaged area has not yet been established. In order to make an accurate assessment of this, data over several years will be required, and any leakage from the managed area will have to be accounted for.
It is the intention of this research project to continue monitoring carbon stock changes to establish annual rate of carbon loss and predict future carbon stocks. This will form the baseline scenario against which carbon beneits of the reserved forest will be compared.
Conclusions
This case has provided some facts on the growth trends in both the unmanaged land and the village forest reserve that is under community management. These preliminary indings provide promising positive evidence on the effectiveness of the village forest management against open access regimes. The growing stock differences between the two will be the carbon beneit the communities are creating from their forest management, and for which they might claim carbon credit compensation in the future.
References
20
Case
Study
3
Kitulangalo Forest Area, Tanzania
Eliakimu Zahabu
Sokoine University of Agriculture, Tanzania
Introduction
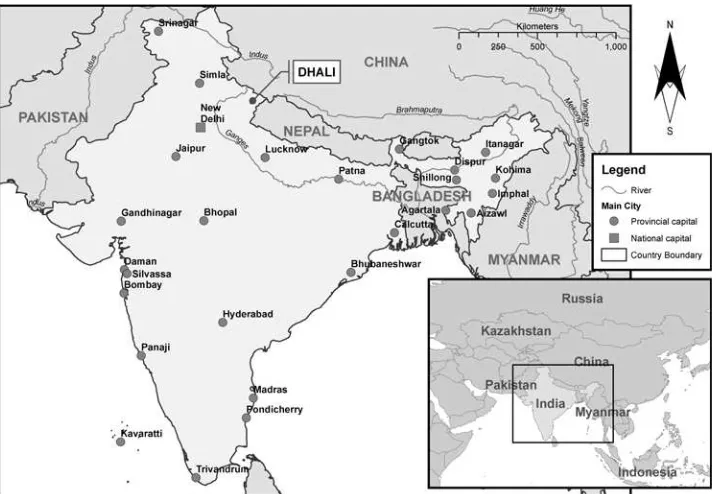
Kitulangalo forest area lies about 50 km to the east of Morogoro town, on the side of the Dar es Salaam-Morogoro highway (Figure 3.1). This is a relatively dry area with an average annual rainfall of about 850 mm. Formerly the forest was part of the Kitulangalo Catchment Forest Reserve. The high level of accessibility to the highway made this area a prime charcoal production area for the supply of the nearby Morogoro municipality and Dar es Salaam city. But in addition the forest suffered from timber extraction through the activities of local pit-sawyers, and from cutting of tree stems for building poles. The human resources of the Forest Department were insuficient to maintain control over the area and to prevent the over use of this important catchment forest. It was de facto an open access resource.
In 1995 however, part of the forest (600 ha) was made over to Sokoine University of Agriculture (SUA) as a Training Forest Reserve; it is now used for training students and for research purposes, although protection was a major reason for its new status. This part of the forest is under joint forest management with Gwata village, which means that the land is still owned by the government, but the management is mainly in the hands of the local community, following jointly prepared management guidelines. In 2000, another 420 ha was demarcated for the village community, and is now called Kiminyu village forest reserve. As a community forest, the land is now the property of the village, which has full responsibility for management. Both areas are characterized by Miombo (savanna woodland) and the predominant species are
Brachystegia sp. and Julbernardia sp.
Different Management Strategies and Rules
Eliakimu Zahabu | 21
In Gwata village an environmental committee has been established and given the responsibility for supervising the management of the forests on behalf the village government. This committee has been established to look after all forest management activities in the villages. The committee members are selected by village government and approved by general village assembly. The considerations for selection to the committee are: village residence, married person, and ability to work. Intrinsically, gender balance is also carefully considered in order to involve women in the management of the village forest reserves. To institute its mandate, the committee sets up bylaws that are approved by the village general assembly. These bylaws are also approved by the responsible district authority and are recognised by the court of law. They consist of different penalties charged against offenders who violate the rules regulating sustainable forest management and use in the village. These bylaws are applicable in both village and government owned forests in the village.
Sokoine University manages the training forest jointly with the village government through the village environmental committee. Two members from the committee are employed by the university as forest guards for the forest. These are responsible for making routine patrols and they supervise different silvicultural activities that are done by villagers who receive daily wages in return. For example, the university involves villagers in clearing of forest boundaries to safeguard against ire. This is normally done during the dry season when the grasses are dry and vulnerable to ires. In the same boundary lines, villagers plant trees, which are used to demarcate the reserves and general village land. If there is ire outbreak, the villagers are also involved in extinguishing it. However, it may be noted that incidence of ire outbreak
22 | Case Study 3. Kitulangalo Forest Area, Tanzania
in the Training Forest Reserve have considerably reduced in recent years since local people have been involved in forest management.
The village environmental committee bears full responsibility for managing the village forest (Kimunyu Forest). It mobilises local people, and selects villagers to patrol the forests every day and report to the village government through the committee. Although this forest is being managed for production purposes, currently there is no tree harvesting allowed. There are not yet enough large timber tree species in the forest, and the only product that could be extracted at present would be charcoal. However a decision has been made to stop charcoal production and to allow the forest to regenerate naturally. The result is that currently, there are higher trees stocking levels in this forest compared to the adjacent public land that is under open access management.
Growing Carbon Stock
The improving health of the forest can also be seen from the point of view of carbon stock. In Gwata village, six persons (four women and two men) were trained in mapping and forest inventory techniques as in all the other study sites under the
[image:30.499.54.417.447.529.2]Kyoto: Think Global Act Local project, with the help of two forest guards who are employed in connection with training forest reserve. In the Training Forest Reserve, 89 plots were set out at intervals of 150 m along transects set 300 m apart: in the Kiminyu village forest reserve, 43 plots were set out at distances of 170 m, on transects separated by 500 m. The number of sample plots was in each case calculated based on estimates of standard error, based on preliminary sampling as outlined in the IPCC Good Practice Guide (Penman et al. 2003) and the Winrock/Biocarbon Fund Sourcebook (Pearson et al. 2005).
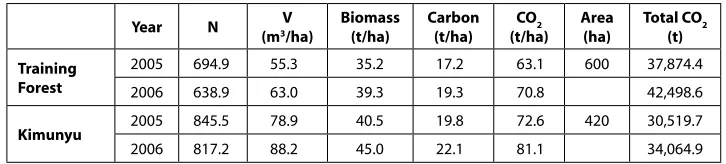
Table 3.1 shows the results of the forest inventory carried out by the villagers.
Table 3.1. Stand parameters for the forests at Kitulangalo
Year N V
(m3/ha)
Biomass (t/ha)
Carbon (t/ha)
CO2 (t/ha)
Area (ha)
Total CO2 (t)
Training Forest
2005 694.9 55.3 35.2 17.2 63.1 600 37,874.4
2006 638.9 63.0 39.3 19.3 70.8 42,498.6
Kimunyu 2005 845.5 78.9 40.5 19.8 72.6 420 30,519.7
2006 817.2 88.2 45.0 22.1 81.1 34,064.9
What is clear is that over a period of one year, management activities have resulted in a considerable tree stock change. Although the number of stems per hectare (N) has decreased, the tree volume has increased, and therefore also the biomass and corresponding carbon. In this one year there has been an increase is stored carbon dioxide of about 7 tons per hectare in both of the sites.
Eliakimu Zahabu | 23
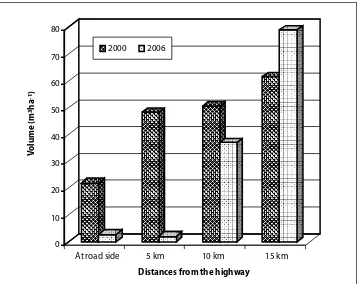
decreased, as had been the pattern over earlier years. The rate of forest loss and of degradation can be determined from studies that were carried out in areas in the vicinity of Kitulangalo, which show that the rate of loss of forest is strongly related to distance from the highway (Figure 3.2). Over a period of six years stock levels dropped by as much as 80% in sites up to 5 km from the highway, but only by 20% at 10 km. This is the result irstly of charcoal production and later of wholesale clearance for agriculture.
1 This is a conservative price for carbon; please see footnote 3 in Case Study 1 for explanation.
The increase in standing volume at 15 km is due to the fact that this area is now under community management for some years (this is the area that is now Kimunyu village forest). If a conservative estimate of 5% biomass loss per year was to be assumed as the average baseline, then the net gain in carbon terms as a result of community forest management would be on the order of 10 tons per hectare per year. At a nominal value of $2 per ton1 after deduction of external transaction costs
(i.e non-local costs involved in verifying and certifying the carbon gains), this would be equivalent to an annual income of $20 per hectare or $8,400 for the Kimunyu forest alone.
Figure 3.2. Rates of degradation in forests similar to the Kitulangalo forest (Malimbwi et al.
2005)
0 10 20 30 40 50 60 70 80
Distances from the highway
At road side 5 km 10 km 15 km
V
olume (m³ha
¯
¹)
[image:31.499.86.443.167.451.2]24 | Case Study 3. Kitulangalo Forest Area, Tanzania
It might be expected however that there is some leakage, in the form of displaced activities, from these sites. Villagers in this village collect irewood and building materials from the general land that is at close by distances from their homes. Only tree felling for commercial timber extraction and for charcoal making could be assumed to be displaced somewhere else. However, there are no evidence of villagers’ migration to other areas to deforest. Of course, it could be argued that the charcoal may still be produced elsewhere, by other people, to meet the urban market demand for this vital product, and thus represents a form of leakage, but it is dificult to prove this or to estimate its impact.
Local Transaction Costs
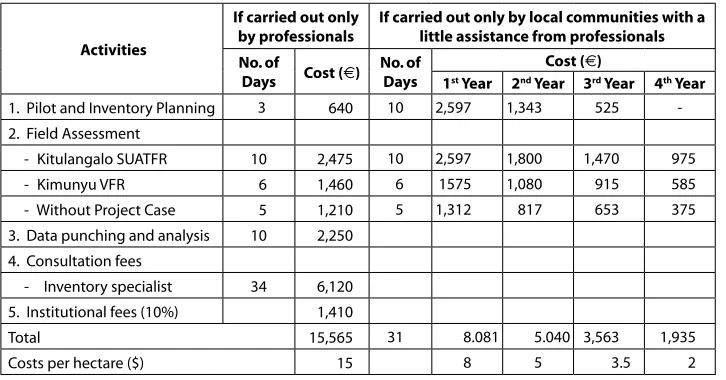
[image:32.499.57.420.431.621.2]Measuring biomass stock to determine changing carbon levels itself involves costs, which are considered to be local transaction costs. At Kitulangalo the costs involved were recorded. A comparison of costs of carbon assessment by local communities against the professionals reveals that it costs twice as much to hire professionals for carbon assessment in the village forests studied, as to engage villagers to do this, including the cost of technical assistance and training, which is considerable in the irst year of assessment. It is to be expected that the villagers will be able to undertake the same work at progressively lower cost in the preceding years as the cost for training and supervision are reduced (Table 3.2). It is assumed that from the fourth year, the villagers can work on their own with assistance only from staff from their local supporting organisation. It is also clear that it is more cost effective to work with villages which are managing large forest areas, since the cost of training is a ixed cost.
Table 3.2. Estimated local transaction costs for monitoring carbon
Activities
If carried out only by professionals
If carried out only by local communities with a little assistance from professionals
No. of
Days Cost (€) No. of
Days
Cost (€)
1st Year 2nd Year 3rd Year 4th Year
1. Pilot and Inventory Planning 3 640 10 2,597 1,343 525
-2. Field Assessment
- Kitulangalo SUATFR 10 2,475 10 2,597 1,800 1,470 975
- Kimunyu VFR 6 1,460 6 1575 1,080 915 585
- Without Project Case 5 1,210 5 1,312 817 653 375
3. Data punching and analysis 10 2,250 4. Consultation fees
- Inventory specialist 34 6,120 5. Institutional fees (10%) 1,410
Total 15,565 31 8.081 5.040 3,563 1,935
Eliakimu Zahabu | 25
Conclusions
Although more data would be needed to strengthen the case, it is evident that community involvement in management, both under joint forestry and in full community forest management, have resulted in signiicant reductions in degradation together with signiicant increases in sequestration of carbon in both types of forest in Kitalangulo. The local transaction costs, though much lower than costs of profession measurement and monitoring, represent a not insigniicant proportion of the likely inancial beneit, but nevertheless it seems there is still a good margin of proit to me made. This is particularly important since the other inancial beneits from such forest management are small. This is particularly the case since charcoal production has been banned, meaning that this source of income has been totally stopped, at least for the present time. The conclusion may be drawn that carbon as a ‘non-timber forest product’ could offer a real incentive for this community to continue with its forest management activities, and for more communities to become involved in managing their forests.
References
Penman, J., Gytarsky, M., Hirashi, T., Krug, T., Kruger, D., Pipatti, R., Buendia, L., Miwa, K, Ngara, T, Tanabe, K and Wagner, F. 2003 IPCC Good Practice Guide for Land Use, Land-Use Change and Forestry. Institute for Global Environmental Strategies.
26
Case
Study
4
Dhali Village, Utranchal, India
Ashish Tewari
1and Pushkin Phartiyal
21Forestry Department, Kumaun University, Nainital, Uttaranchal, India 2Central Himalaya Environmental Association, Uttrachanal, India
Introduction
Uttaranchal, the newly formed hill state of India, is situated in the Indian Central Himalayas. The total geographical area of Uttaranchal (UA) is 5,563,174 ha, of this agricultural land is 792,000 ha (about 13% of the total area) and 3,671,695 ha is forest (about 66%). At present there are more than 12,000 Van Panchayats (VPs), the local forest councils responsible for forest management in UA occupying nearly 0.5 million ha of the total forest area (Table 4.1).
Table 4.1. Distribution by district of VPs in Uttaranchal
Sl District Number of VPs Area (ha)
1. Almora 2,199 69,854 2. Nainital 496 28,068 3. Pithoragarh 1,661 87,054 4. Champawat 629 31,233 5. Bageshwar 822 38,783 6. Pauri Garhwal 2,430 52,184 7. Chamoli 1,073 167,310 8. Rudraprayag 574 20,702 9. Uttarkashi 643 5,510 10. Dehradun 205 7,659 11 Tehri Garhwal 1,332 14,932
Total 12,064 523,289
Ashish Tewari and Pushkin Phartiyal | 27
From Uttaranchal a number of major rivers originate and nurse the great Gangetic Plain of the Indian subcontinent. Forest cover found in the Himalayan belt is not only an important habitat for high altitude lora and fauna, but also crucial for providing hydrological beneits downstream. The water resources from the Himalayan region of Nepal and India that low to the Gangetic Plains support over 500 million people and sustain the agriculture system in one of the most densely populated parts of the world.
History of Van Panchayats
The history of VPs dates back to the British colonial period. The restrictions imposed by the British on the customary forest rights of people towards the end of the 18th
century and beginning of 19th century were resented by the locals. These acts of
government led to alienation of the local communities from the British government. Between 1911 and 1917 vast areas of forests were burnt down by the people in protest against the imposed restrictions. In 1921, the government appointed a committee known as the Kumaon Forest Grievance Committee to enquire into the rights of people over forests resources. It was on the recommendation of this committee that the British government decided to introduce Van Panchayats (forest council or forest committee) to Kumaon in 1930’s. The landmark VP Act 1931 handed over the control of the designated forest to elected VP members in place of the State Forest Department (SFD).
The VP probably represents one of the largest experiments in decentralized management of common property in collaboration between the locals and the state (both SFD and State Revenue Department). The VP, an elected body, holds responsibility for harvesting, conserving and managing the village forest resources. However, the various activities performed by the VPs are under the regulations of the SFD and the Revenue Department, the former also provides technical backstopping as and where necessary. The village forest is a resource used by a deinite user group (the village people) that is liable to degrade when over exploited. Though called village property, the land is owned by the State; however, village people consider it as a collective property as they are allowed the usufruct rights and resent government interference.
Most community forests were initiated on degraded lands, oficially on a kind of Civil Soyam forest, falling under administration of Revenue Department. But unlike Civil Soyam forests the community forest are not open-access forests. Depending on a number of households in a village, there are generally 5-9 elected members in a VP, who elect a “Sarpanch” (chairman) from among themselves. Elections are held every 5 years.
Gender Issues in VPs
28 | Case Study 4. Dhali Village, Utranchal, India
village is in the VP (Van Panchayat Rules 2001; Uttaranchal Government), this forced inclusion may not foster genuine participation in the VP. The female representatives often send their sons or husbands to the VP council meetings as they are reluctant to attend the meetings due to work load. The most obvious constraint is the heavy workload involving household work, collection of fuel wood, fodder, litter, water collection, taking care of children and performing agricultural activities. In this hilly region the village women have to travel 4-5 km daily to fetch drinking water, while simultaneously contributing almost 70-80 percent of agriculture work. Also, they feel that they are not encouraged by men to attend the meetings. In recent years this issue has been raised repeatedly and men in some cases seem to welcome women participation, but much progress has yet to be made.
Dhaili Van Panchayat
The Dhaili Van Panchayat is located at an altitude of about 1830 m above sea level
(Figure 4.1). The area under this VP forest is about 60 ha, of which 56 ha is good
forest (more than 58% crown cover). The Dhaili Van Panchayat was formed in 1999 and comprises of even aged oak (Quercus leucotrichophora) forest with undercanopy of Myrica nagi and Rhododendron arboretum. The average canopy cover of the forest is close to 60%.
[image:36.499.58.416.386.633.2]Of the 1050 people living in Dhaili, 514 are males and 536 females, in 105 families. The average literacy of Dhaili village is 50%, with male and female literacy being 70.0 and 30.0%, respectively. The main source of income for the people is
Ashish Tewari and Pushkin Phartiyal | 29
by working as daily labourers, and agriculture is secondary. The average income per family is about Rs. 32,422/year which in the Indian context is considered close to or below the poverty line.
The present strength of VP council is seven, with all male members. Fresh election for the Village VP council in light of new Forest Panchayat Rules is pending and hopefully will take place in the near future. The VP meetings are generally held once a month. The main source of the income for the VP are the sales from dry fodder at Rs. 10 per family, and green fodder at Rs. 30 per family or Rs. 10 per head load. In addition to sales of fodder, the imposition of ines also generates some income for the VP. The total income generated by the VP was Rs. 9,500 from the sale of permits and ines in the year 2004-2005.
After the formation of VP, the people of Dhaili accepted that the condition of their forest has improved, as indicated by the reduction of distance travelled for collection of fuelwood, fodder and drinking water. Some 150 temporary small earthen ponds (water percolation micro reservoirs) dug during 2003-2004 in the catchment of 4 major springs have increased water discharge in the springs during lean summer months. The VP of Dhaili also has a forest guard who is paid around Rs. 600-800/ month which is met from the income generated by the forest and many people have been ined in last ive years. The VP also carried out plantation of bamboo, bhimal (Gravia optiva), and utis (Alnus nepalensis) in about 6 ha in 2004-2005 with the help of villagers. The villagers also clear the ire lines for the protection of forest during the dry summer season. No ire has o