CHAPTER III
RESEARCH METHOD
III. 1. Research aspects
III. 1. 1. Research field
This research project is in the field of human genetics, mainly molecular genetics and ophthalmology.
III. 1. 2. Research location
Probands and their families were collected based on the medical record obtained from Dr. Kariadi Hospital, Central Java Eye Center, Semarang Eye Center and Low Vision Unit Yogyakarta. DNA isolation will be performed in the Center for Biomedical Research, Faculty of Medicine, Diponegoro University Semarang. Homozygosity mapping and sequencing analysis of candidate genes was performed in the Department of Human Genetics, Radboud University Nijmegen Medical Center (RUNMC), the Netherlands.
III. 1. 3. Research period
III. 1. 4. Research design
This study is a descriptive, cross sectional study
III. 2. Method
III. 2. 1. Population
Individuals with sporadic or familial RP were included in this study. The patients originated from several regions in Central Java with various ethnic backgrounds. Information about ethnical backgrounds of the patients were obtained by pedigree drawing of at least three family generations and information about the origin of
III. 2. 2. Samples
the determination of allele frequency in the general Indonesian population.
Informed consent obtained from each patient and control individual after explanation of the nature and possible consequences of the study in accordance with the tenets of the Declaration of Helsinki (Edinburgh, 2000; www.wma.net).
III. 2. 2. 1. Inclusion criteria
1. Probands who were clinically diagnosed with RP
2. Agree to join on this study and signing the consent form. 3. Patients with unilateral disease, nystagmus /wandering eye,
exudative retinal detachment, retinal vasculitis
4. Patients who did not display any signs or symptoms of
syndromic RP (retinitis pigmentosa with involvement of other organ, such as hearing problem and mental retardation) based on informations obtained from the history taking and clinical examination
III. 2. 2. 2. Operational Definition
No Variable Definition Results /
measurements Scale characterized by night blindness, progressive loss of peripheral vision and display a typical fundus appearance: bone spicule pigmentation, arterioles attenuation, waxy pallor of optic disc without any involvement of other organ. .
Yes / No Nominal
segregate to the next generation on the X chromosome. copies of the gene are needed to cause RP phenotype in an same in two allele). The regions determined from the SNP array data which has been analyzed using PLINK software.
Yes/No Nominal
III. 2. 2. 3. Subject selection
III. 2. 2. 4. Clinical examination
History taking and family pedigree were obtained from the participants and other family members. Basic ophthalmic examination, such as visual acuity by Snellen chart, color vision by Ishihara plate of the affected individuals performed by dr. Kentar Arimadyo, SpM followed by further detailed investigations, including direct ophthalmoscope funduscopy, Humphrey visual field analysis and fundus photography.
III. 2. 2. 5. Sample collection
After clinical diagnosis of RP established, 5 mL EDTA blood was drawned for DNA isolation from all affected and unaffected family members as well as control individuals.
III. 2. 2. 6. Minimum sample required
There are no minimal number of samples required, as this study performed in a is a descriptive study and not a population study.
III. 3. Laboratory procedures
III. 3. 1. DNA isolation
extracted from peripheral leukocytes according to a standard salting-out protocol (Cebior manual book).
III. 3. 2. DNA concentration and Gel electrophoresis
Before measuring the concentration make sure that the DNA quality is good by running the DNA by agarose gel electrophoresis using . The concentration of agarose 0.8 % and put 5 µl loading buffer and 2 µl DNA (70ng/µl) and set the electrophoresis on 50V for at least 2 hours. After DNA quality has been checked, DNA concentration was measured using the nanodrop and working solution with concentration of 70 ng/µl was made for sending SNP microarray samples. A DNA aliquot with concentration of 20 ng/µl was prepared for PCR working solution. Working solution was placed in eppendorf tube or sample plate, labelled for each sample and stored in the -200C fridge.
III. 3. 3. SNP microarray and homozygosity mapping
SNPs. Homozygous regions larger than 3 Mb were included as homozygous regions.
Homozygous regions were ranked based on the size of the regions. SNP positions were derived from the UCSC Human Genome Browser build NCBI 36/ hg 18, March 2006. Gene candidates selection will ranked from the largest homozygous region and for the familial cases, in overlapping regions shared by siblings. Available published retinal dystrophy loci and genes data (RetNet-Retinal Information Network; http://www.sph.uth.tmc.edu/retnet/, provided in the public domain by the University of Texas Houston Health Science Center, Houston, TX) which provide data for the RP known genes was used to performed gene candidates selection within the homozygous regions.
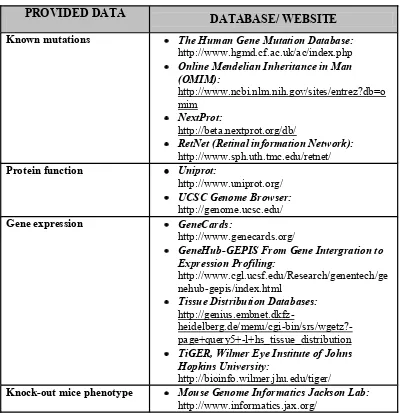
Table 2. Overview of the databases that were used for candidate gene search
PROVIDED DATA
DATABASE/ WEBSITE
Known mutations The Human Gene Mutation Database:
http://www.hgmd.cf.ac.uk/ac/index.php
Online Mendelian Inheritance in Man (OMIM): Gene expression GeneCards:
http://www.genecards.org/
GeneHub-GEPIS From Gene Intergration to Expression Profiling:
TiGER, Wilmer Eye Institute of Johns Hopkins University:
http://bioinfo.wilmer.jhu.edu/tiger/
Knock-out mice phenotype Mouse Genome Informatics Jackson Lab:
http://www.informatics.jax.org/
III. 3. 4. Primers and Conditions for PCR
PCR optimation and to get the correct product. Below are the several considerations to design a good PCR primers:
1. Length: The optimal length of PCR primers is 18-22 bp, enough for adequate specificity, and primers can bind easily to the template at the annealing period.
2. Melting Temperature(Tm): is the temperature at which half of the DNA duplex will dissociate becomes single stranded and indicates the duplex stability. Primers with melting temperatures in the range of 52-58 oC generally produce the best results. 3. Annealing temperature: The reaction temperature is lowered to
50 65 °C for 20 40 seconds allowing annealing of the primers to the single-stranded DNA template. Typically the annealing temperature is about 3-5 degrees Celsius below the Tm of the primers used.
4. GC Content: The GC content (the number of G's and C's in the primer as a percentage of the total bases) of primer should be 40-60%.
There is no single set of PCR mix and conditions that can be applied to all PCR amplifications. Optimation has to be done for each exon of genes and the PCR components (concentration of each agent, enzyme, temperature, number of cycles and requirements of additional agent, such as DMSO, Q-Solution, different type of polymerase) need to be adjusted within proposed ranges for specific product. Control DNA was used to adjust the condition for PCR. If the reaction worked properly, pa
including the positive and negative control to know that the reaction is working properly and to know if there is any contamination in the PCR mix.
The following universal PCR mix and conditions can be used for the first set to start amplification. The protocol that could be used / set per reaction for PCR as follow: H2O 16,5 µl, PCR buffer 10x 2,5 µl, 50 mM MgCL2 1,5 µl, dNTPs 10 mM 0,5 µl, 10 pmol Primer forward 0,5 µl, 10 pmol Primer reverse 0,5 µl, polymerase 5U/ul 0,5 µl, DNA 2,5 µl, and the total amount of this mix is 25 µl.
III. 3. 5. Sequencing analysis
Purification of PCR product using Nucleospin Plasmid Quick Pure columns (Macherey-Nagel) and analyzed in either sense or antisense direction using dye termination chemistry (Big Dye Terminator, ver.3, model 3730 DNA analyzer; Applied Biosystems, Inc.[ABI], Foster City, CA). Sequencing result were analyzed using contig-VNTI program which allign and compared the reference sequence with the sample sequence.
III. 3. 6. Mutation analysis
In silico programs, including Polymorphism Phenotype (PolyPhen), Sorting Intolerant from Tolerant (SIFT) and Align GVGD were used to determine pathogenecity of missense mutation. These programs are able to calculate the potential functional and structural impacts based on Grantham scores (comparison of the differences in ) and PhyloP scores (evolutionary conservation of the nucleotide). Project hope was also used
structure changes caused by mutation.
considering to result in the production of truncated protein which lead to the disease phenotype. Therefore, if a nonsense mutations found, it is we can almost always sure that this is the disease-causing mutations. Yet, confirmation test by segregation analysis and frequency analysis in ethnically matched control are still needed to be performed to confirm this mutations.
III.3.6.1 Confirmation of a novel mutation
In a novel mutation, segregation analysis in the parents and siblings are needed to be performed by direct sequencing. Sequencing analysis result will display whether the disease segregate within the family. The mutation can be confirmed if it is found exclusively in affected individual but absence in the unaffected parents and siblings. By performing this method, the mode of inheritance can also be determined and risk of the next generation can be calculated.
III. 4. Data Collection
III. 4.1. Primary Data
RP patients including demographic data: date of birth, gender and three generations pedigree
III. 4.2. Secondary Data
Medical records from the reference hospital, including patients clinical data, fundus appearance, fundus photograph and visual field analysis result.
III. 5. Data analysis
proportion of all identified mutations in Indonesian families was presented in a pie chart diagram.
III. 6. Research Ethics
Informed consents were provided from the initial consent given by parent or caregiver at the time of diagnosis that allows the use of material left anonymously. Ethical clearance was provided by Health Research Ethical Committee of Faculty of Medicine, Diponegoro University and Dr. Kariadi General Hospital Semarang. Ethical clearance form is attached in the appendix.
III. 7. Research Limitations
PLINK analysis
variant (+) in the control samples
No mutation Mutation (+) Candidate gene
Homozygous region
Blood samples collection Non syndromic RP
excluded History taking/ interview, Eye examination
and Pedigree Analysis of Patients
Syndromic RP