254 (2000) 53–69
www.elsevier.nl / locate / jembe
A fluctuating salinity regime mitigates the negative effects of
reduced salinity on the estuarine macroalga, Enteromorpha
intestinalis (L.) link
*
Krista Kamer , Peggy Fong
Department of Organismic Biology, Ecology and Evolution, University of California, Los Angeles, 621 Charles E. Young Drive S., Los Angeles, CA 90095-1606, USA
Received 2 May 2000; received in revised form 27 June 2000; accepted 17 July 2000
Abstract
We tested the response of Enteromorpha intestinalis to fluctuating reduced salinity regimes which may occur in coastal estuaries due to both natural and anthropogenic influences. In a fully crossed two factor experiment, we subjected E. intestinalis to 0, 5, 15 and 25 psu water enriched with nutrients for 1-, 5-, 11- and 23-day periods. Each period was followed by 24 h of exposure to 25 psu (ambient) water that was not nutrient enriched. Following 24 h in ambient salinity water, algae were returned to reduced salinity conditions for the appropriate period and the cycle continued over the 24 days for which all treatments were maintained. Exposure to 0 psu for 5 days or longer resulted in loss of pigmentation, decreased wet and dry biomass, increased wet wt:dry wt ratios, decreased removal of nitrogen (N) and phosphorus (P) from the water column and an accumulation of NH in the water column. More frequent exposure to ambient salinity in the4 1-day treatment mitigated these effects. Across all salinity levels tested, biomass increased as frequency of exposure to ambient salinity increased. At all durations of exposure to low salinity tested, biomass increased as salinity level increased. We conclude that growth of E. intestinalis is decreased by reduced salinity. E. intestinalis is able to withstand exposure to 0 psu but there is a temporal limit to this tolerance that is somewhere between 1 and 5 days. Populations of E. intestinalis in coastal estuaries may suffer from freshwater inputs if salinity conditions are persistently reduced. 2000 Elsevier Science B.V. All rights reserved.
Keywords: California; Enteromorpha intestinalis; Estuary; Salinity fluctuations; Macroalgae; Reduced salinity
*Corresponding author. Present address: Southern California Coastal Water Research Project, 7171 Fenwick Lane, Westminster, CA 92683. Tel.: 11-714-372-9237; fax: 11-714-894-9699.
E-mail address: [email protected] (K. Kamer).
1. Introduction
Reduced salinity can have negative effects on a variety of marine and estuarine organisms. In the field, decreased salinity has been associated with coral bleaching (Goreau, 1964), mortality of corals and associated reef organisms (Jokiel et al., 1993) and limitation of the distribution of temperate, estuarine sea anemones (Sheader et al., 1997). In experimental manipulations, exposure to reduced salinity impeded develop-ment and caused mortality in estuarine snail and polychaete larvae (Richmond and Woodin, 1996), resulted in high mortality of penaeid shrimp (Brito et al., 2000), and significantly reduced activity of barnacle nauplii (Rosenberg, 1972; Cawthorne, 1978). Low salinity also reduced the photosynthetic rate (Karsten and Kirst, 1989) and growth rate (Martins et al., 1999) of estuarine macroalgae.
Salinity lower than that of seawater occurs naturally in coastal estuaries (Zedler, 1982; Zedler et al., 1984; Peters et al., 1985; Edwards et al., 1987; Kirst, 1989; Richmond and Woodin, 1996). Patterns of freshwater input to estuaries vary with climate and watershed size. On the east coast of the US, natural freshwater input to estuaries usually occurs throughout the year, due to large watersheds and year-round precipitation (Valiela and Teal, 1979). However, with a few exceptions, Pacific coast watersheds are generally smaller due to coastal mountain ranges (Zedler, 1982) and estuaries may therefore be more sensitive to seasonal variation in rainfall (Kirst, 1989).
In areas with Mediterranean climates, rainfall is often highly seasonal (Zedler, 1982, 1996). Typically winter months are cool and wet, and summers are warm and dry with little or no rainfall. In southern California, annual rainfall is usually low (Zedler, 1996) making natural freshwater influxes to estuaries from watersheds limited and intermittent (Zedler, 1980; Peters et al., 1985). This leads to fluctuations in estuarine salinity (Zedler et al., 1984; Peters et al., 1985). However, frequency and magnitude of winter storms is highly variable (Zedler, 1982) and the resulting freshwater pulses to estuaries from natural streamflow can be unpredictable (Zedler, 1996). The magnitude and duration of a storm’s effect on estuarine salinity will depend on the nature of the storm and the recent history of rainfall in the watershed (Zedler, 1982).
Salinity reductions that occur in southern California estuaries due to rainfall may be ephemeral, particularly when compared to the anthropogenic practices that introduce freshwater to coastal estuaries. Examples of unnatural freshwater sources are runoff from agriculture, release of wastewater from sewage treatment facilities, and municipal water use (Zedler, 1996). While the contribution of freshwater resulting from these activities may not be greater in magnitude on a given day than that resulting from rainfall, it does occur year round, whereas rainfall does not. Freshwater from anthropogenic sources can reduce estuarine salinity longer than naturally occurring flows do.
contrast, estuaries where freshwater inputs are unimpeded by dams may experience brief periods of greatly reduced salinity as storm runoff passes through.
Urbanization of a watershed leads to a high proportion of the area being covered with impervious substances such as concrete or asphalt. These surfaces reduce the amount of surface flow that percolates into the groundwater supply and ultimately increase the amount of surface flow that directly enters coastal estuaries. More developed watersheds have higher runoff coefficients and higher volumes of runoff relative to their size and annual rainfall (Eyre and Balls, 1999). As a result, estuaries receiving flow from urbanized watersheds may experience even greater reductions in salinity due to greater runoff.
Physical modifications to estuaries influence fluctuating salinity patterns as well. Tidal circulation in an estuary may be reduced by the construction of roads that dissect it or by tidal gates used for flood control (Zedler, 1996). Decreased tidal flow reduces the degree of mixing between freshwater and seawater, thereby increasing the contribution of freshwater to estuarine salinity and resulting in lower salinity.
Prolonged salinity reductions may have adverse effects on estuarine organisms adapted to the brief salinity reductions that historically characterized southern California estuaries (Zedler et al., 1984; Peters et al., 1985; Zedler, 1996). Enteromorpha spp. are opportunistic green macroalgae common in estuaries and coastal systems throughout the world (Greze, 1968; Reed and Russell, 1979; McBane and Croker, 1983; Lowthion et al., 1985; Montgomery et al., 1985; Pregnall and Rudy, 1985; Soulsby et al., 1985; Young et al., 1987a, 1998; Raffaelli et al., 1989, 1991; Rijstenbil et al., 1993; King and Hodgson, 1995; Marcomini et al., 1995; McComb and Lukatelich, 1995; Thornton et al.,
´
1995; Hernandez et al., 1997; Young et al., 1998). E. intestinalis is a natural component of southern California estuaries where it forms immense blooms throughout the year (Peters et al., 1985; Fong, 1986; Rudnicki, 1986; Kamer et al., in review).
Enteromorpha intestinalis is important in several ecosystem processes. In southern
California estuaries algae make a large contribution to the primary productivity of the system (Zedler, 1980; Zedler et al., 1984) and Enteromorpha spp. are an important part of estuarine food web support (Kwak and Zedler, 1997; K. Boyer, unpub. data; E. Logothetis, unpub. data). E. intestinalis also plays an integral role in nutrient cycling within an estuary. As algae decompose, nutrients are released back into the water (Sfriso et al., 1987; Sfriso et al., 1992) and will again be available to other components of the system.
While playing an integral role in estuarine function, blooms of Enteromorpha
intestinalis can reduce the quality of an estuary. Large masses can fill the shallow water
column during bloom events and deplete the water of oxygen (Sfriso et al., 1987; Valiela et al., 1992), causing fish and invertebrate mortality (Sfriso et al., 1992). Additionally, large mats of algae often rest on the benthos at low tides and cause the sediments to become anoxic (Sfriso et al., 1992). A shift to anoxic sediments can change infaunal community structure (Raffaelli et al., 1991; Ahern et al., 1995) and subsequently affect bird populations (Raffaelli et al., 1989).
Enteromorpha intestinalis is a euryhaline species (Reed and Russell, 1979; Ritchie
Larkum (1985a) collected E. intestinalis from brackish waters and were able to culture it
in .2 psu seawater. Pringle (1986) collected E. intestinalis from habitats where salinity
was |20 psu. We have observed E. intestinalis in local environments subject to periodic
freshwater flows that reduce salinity to as little as 6 psu (Kamer et al., unpub. data). Steady state laboratory experiments have investigated the response of Enteromorpha
intestinalis to hypo- and hypersaline conditions, both of which can cause physiological
stress to the alga (Reed and Russell, 1979; Ritchie and Larkum, 1985a; Edwards et al., 1987, 1988; Young et al., 1987a,b; Kirst, 1989; Martins et al., 1999). To maintain cell turgor when external salinity conditions fluctuate, E. intestinalis regulates the con-centration of internal solutes which requires energy (Ritchie and Larkum, 1984a,b, 1985a,b; Edwards et al., 1987, 1988; Young et al., 1987a). Despite its demonstrated ability to regulate turgor pressure, E. intestinalis died after exposure to 0 psu for as little as 6 days (Martins et al., 1999). Edwards et al. (1988) and Ritchie and Larkum (1985a) also determined that E. intestinalis could not persist under 0 psu conditions for extended periods (3–5 weeks). Ritchie and Larkum (1985a) found however that when E.
intestinalis was placed in seawater briefly (24 h) once a week that the decline of E.
intestinalis that occurred when algae were left in low salinity continuously was arrested.
While we may understand the effects of low salinity on the physiology of
En-teromorpha intestinalis, we still do not fully understand how reductions in salinity which
cause stress affect the distribution and abundance of E. intestinalis in estuaries. An energetic cost to the alga may be imparted if sub-optimal salinity conditions persist for an extended period, and this will ultimately be reflected as a decrease in productivity or biomass accumulation (Lee, 1998) when energy that could have been used for growth is instead used to maintain cell turgor (Kirst, 1989).
To date, most experiments have reported the effects of steady-state reduced salinity conditions on Enteromorpha intestinalis rather than the effects of conditions that mimic fluctuating salinity regimes (but see Ritchie and Larkum, 1985a). Our objective was to determine the ecological response of E. intestinalis to fluctuating low salinity conditions that commonly occur in modified coastal estuaries. To do this, we measured the periods for which E. intestinalis can tolerate each of three levels of salinity reduction. While E.
intestinalis may tolerate brief periods of low salinity, we hypothesize that there is a
temporal limit to its tolerance.
2. Materials and methods
2.1. Experimental overview
We used a two-factor experiment to test the duration for which Enteromorpha
intestinalis can tolerate low salinity. We tested four durations of exposure to low salinity
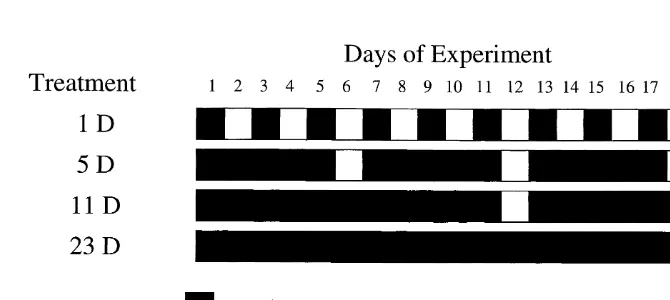
Fig. 1. Exposure to experimental and ambient salinity water. Solid bars represent periods spent in low salinity water (0, 5, 15 or 25 psu, enriched with N and P) and open bars represent time spent in ambient salinity water (unenriched, 25 psu). In all treatments, water was changed every 6 days from the time the experiment began on 1 June 1999.
low salinity tested were 1, 5, 11 and 23 days. Salinity can be low when the tide retreats and freshwater influence is strong and can then increase when the tide advances and oceanic seawater mixes with freshwater. Salinity levels tested were 0, 5, 15 and 25 psu. Following each experimental exposure to low salinity, which simulated the effects of freshwater flow, algae were placed in ambient salinity (25 psu) for 24 h to simulate inundation by estuarine water. Algae were then returned to reduced salinity conditions for the appropriate period. The experiment ran for 24 days on a 6-day cycle. Consequently, algae in 23-day treatments spent one 23-day period at low salinity followed by one 24-h period at ambient salinity. Algae in 1-day treatments spent 12 one-day periods at low salinity, each followed by a 24-h period at ambient salinity. Another way of viewing these experimental conditions is that over the course of the experiment, algae in 1-day treatments were most frequently exposed to ambient salinity, and algae in 23-day treatments were least frequently exposed. Algae in 25-psu treatments were transferred between experimental salinity (25 psu) and ambient salinity (also 25 psu). These treatments served as control conditions to account for any physical effects of handling the algae.
2.2. Protocol
Enteromorpha intestinalis was collected from Mugu Lagoon, Ventura County, CA, on
21 May 1999. Algae were kept outdoors at UCLA in shallow pans covered with window screening thereby reducing incident light to coastal light levels. Pans were filled with
low nutrient water (25 psu, 22.8160.46mM NO , 2.103 60.09mM total P), aerated, and
kept below 208C. Algae were kept in these conditions for 11 days to equalize internal
stores of nutrients (Fong et al., 1994).
The experiment began on 1 June 1999. Replicate 10-g subsamples of Enteromorpha
1 l of the appropriate salinity water. We began with water of initial salinity 25 psu as that
represents salinity levels measured in a southern California estuary (25.2661.59 psu,
Boyle et al., unpublished data). Salinity was reduced by diluting 25 psu water
(22.8160.46mM NO , 2.103 60.09mM total P, n514) with distilled water. This process
reduces the initial nutrient concentration of the water as well as its salinity. Distilled water was used for 0 ppt conditions. Nutrients were added to these solutions for mean
initial concentrations of 287.4161.63mM NO and 31.483 60.39mM P (n548 for both)
to ensure that nutrient levels were similar across salinity treatments and also that nutrients were plentiful enough that they would not limit algal response to experimental
treatments. NH was not added; the mean initial NH concentration was 6.404 4 60.48mM
(n529). Initial total Kjeldahl nitrogen (TKN) ranged from 14.29 to 50.00mM and the
mean was 32.1461.15 mM (n548). Water was changed every 6 days.
Nutrients were added to the solutions described above only; they were not added to the ambient salinity water that algae were exposed to for 24 h following each experimental duration exposure. Freshwater inputs are high in nitrogen (N) and phosphorus (P) (Boyle et al., unpublished data), whereas the oceanic seawater that dominates the higher estuarine salinity we were modeling has low N and P content. The ambient salinity water had low levels of background nutrients that were similar across
experimental treatments and time (22.8160.46 mM NO , 2.103 60.09 mM total P). For
each of the 1-day replicates there were two jars, one with low salinity water and one with ambient salinity (25 psu) water. This facilitated transferring the algae back and forth between low and ambient salinities without having to replace the volume of either salinity more often for 1-day treatments than for the other experimental durations. These practices ensured that total nutrient loads did not vary between treatments. Noteably, 1-day treatments were exposed to nutrient-enriched water only 3 days out of every 6-day cycle while 5-, 11- and 23-day treatments were exposed to nutrient-enriched water for longer. This could affect algal uptake of nutrients if more than 3 days is needed for 10 g of Enteromorpha intestinalis to deplete the water column of the amount of added nutrients. However, these different periods of exposure to nutrients should not have affected results because E. intestinalis nutrient uptake rates are high enough that the algae would have depleted the water column of nutrient additions in less than a day (Kamer et al., unpublished data).
Treatments were placed in a randomized array in outdoor pools, kept below 208C and
covered with window screening. Replication was 4-fold for a total of 64 experimental units. Every day jars were stirred to prevent any stratification of the water column that could develop due to evaporation and to try to ensure equal amounts of physical disturbance between treatments that were handled daily and those that were handled less frequently. Salinity was monitored daily with a hand held refractometer and distilled water was added to compensate for evaporation.
2.3. Measured responses
On 13, 19 and 25 June 1999 an estimation was made of the percentage of
Enteromorpha intestinalis tissue that was pigmented. Visual examinations of the algae
categories: 0–,5%, 5–,25%, 25–,50%, 50–,75%, 75–,95%, and 95–100%. Generally, tissue lacking pigment rested on the bottom of the jar and did not float as
healthy E. intestinalis often does due to release of O and CO into its tubes (Kamer and2 2
Fong, pers. obs.). At the beginning of the experiment all the algae was 100% pigmented. Only data from 13 June 1999 are presented because once algae lost their pigmentation they did not regain it.
Algal wet biomass was measured every 6 days on 7, 13, 19 and 25 June 1999 after visual estimates of % pigmented tissue were made. Samples were removed from experimental units, placed in individually labeled nylon mesh bags and spun in a salad spinner for 1 min to remove excess water. Samples were weighed and returned to their appropriate experimental units except on the last day of the experiment. After final wet weights were taken on 25 June 1999, algae were rinsed in distilled water to remove
external salts and dried to a constant weight at 608C. Algal dry weights were recorded
and wet weight:dry weight ratios calculated.
On 24 June 1999, we collected the last portion of reduced salinity water to which the algae had been exposed (from 19 to 24 June 99) to estimate the amount of nutrients the algae had removed from the water. Water samples were filtered through Whatman GF / C
glass fiber filters and frozen for analyses. Water samples were analyzed for TKN, NH ,4
NO3 and total P by the DANR Analytical Laboratory of UC Davis using standard
methods.
2.4. Statistical analysis
Differences in wet biomass on 7, 13, 19 and 25 June 1999 were analyzed using
repeated measures analysis of variance (duration of exposure to low salinity3salinity
level3time). Among treatment differences in dry algal biomass and wet weight:dry
weight ratios were analyzed using two factor ANOVA (duration of exposure to low
salinity3salinity level). Plots of residual versus fitted Y values were examined to
determine if data complied with the ANOVA assumption of homogeneity of variance. Variances were unequal across wet:dry weight ratio means and data were transformed using a 1 /x calculation.
Most end of experiment water column NO values were below detection limit (3.573
mM) resulting in n,3 for most treatments. Due to low sample size, statistical tests were
not performed on this portion of the data. Among treatment differences in water column
NH , TKN and total P were analyzed using two-factor ANOVA (duration of exposure to4
low salinity3salinity level). Variances were unequal across means for both total P and
NH . Total P data were log transformed and NH data were square-root transformed.4 4
Several treatments also had water column NH and total P values below detection limit4
(3.57mM for NH and 1.564 mM for total P), thereby reducing the number of replicates
for which we had quantitative data. Treatments with n,3 were excluded from statistical
analyses.
3. Results
Table 1
a Percent of replicates in each category of % pigmented Enteromorpha intestinalis tissue on 13 June 1999 % Pigmented % of replicates in each category of % pigmented tissue
Entermorpha
0 psu 5, 15 and 25 psu
intestinalis
conditions at all tissue 1 day 5 days 11 days 23 days
durations of
The 0 psu 1-, 5-, 11- and 23-day treatments are presented individually, and the 5-, 15- and 25-psu treatments at all durations of exposure tested are presented together. n54 in all cases.
half of the replicates in the 0-psu 5-day treatment and ,5% of its pigment in the other
half (Table 1). All replicates in the 0-psu 11- and 23-day treatments had ,5%
pigmented tissue. Algae from the 0-psu 1-day treatment was .95% pigmented. In all
treatments from the 5-, 15-psu and control conditions E. intestinalis was .95%
pigmented. The percent of E. intestinalis tissue that was pigmented did not change during the rest of the experiment.
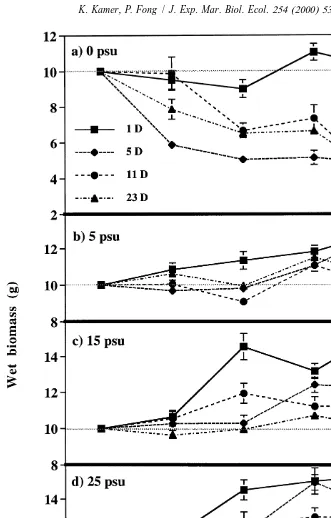
Wet biomass of Enteromorpha intestinalis was significantly affected by duration of
exposure to low salinity, by salinity level, and by time (P,0.0001 for all factors).
Under 0-psu conditions (Fig. 2a), E. intestinalis in the 1-day treatment both lost and gained biomass during the experiment but its final wet weight was not significantly
different from the initial amount added. However, exposure to 0 psu for a duration .1
day resulted in significantly decreased wet weight over the course of the experiment. Overall, E. intestinalis biomass from the 5-day treatment declined 50% by the middle of the experiment and then maintained itself for the rest of the experiment. Biomass from the 11- and 23-day treatments declined dramatically near the end of the experiment and final wet weights were 61–63% less than initial weights. 0 psu was the only salinity level under which E. intestinalis experienced a net loss in biomass by the end of the experiment.
Under 5-psu conditions, biomass of the 1- and 5-day treatments increased over the course of the experiment for final gains of 30% (Fig. 2b). Biomass of 11- and 23-day treatments both fluctuated around initial biomass over the course of the experiment, and their final wet weights were similar to each other and significantly lower than the 1- and 5-day treatments.
Under 25 psu conditions, the 1-day treatment biomass increased steadily for a final gain of 54% by the final sampling date (Fig. 2d). The 5- and 11-day treatments gained significantly less biomass; they increased 30–33% over the course of the experiment. Biomass of the 23-day treatment increased 21% by the end of the experiment.
Significant interactions occurred between duration of exposure to low salinity and salinity level in the repeated measures ANOVA. There were differences in the magnitude of Enteromorpha intestinalis’ response to durations of exposure to low salinity across salinity levels. This was most pronounced under 0-psu conditions where more frequent exposure to ambient salinity mitigated the effects of low salinity. Interactions occurred between duration of exposure to low salinity and salinity level in the two-factor ANOVAs that were conducted on dry weight and wet:dry weight ratio data for the same reasons.
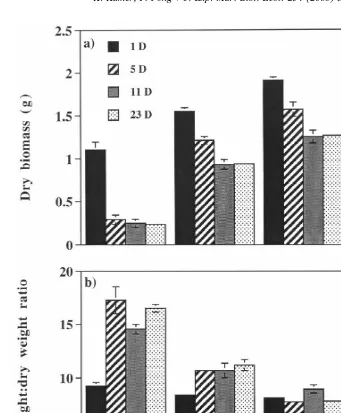
Dry biomass of Enteromorpha intestinalis was also significantly affected by duration
of exposure to low salinity and by salinity level (P50.0001 for both factors). For each
duration of exposure to low salinity tested, dry biomass increased as salinity increased (Fig. 3a). Additionally, algae in the 1-day treatments had higher dry biomass than algae in 5-, 11- or 23-day treatments across all salinities tested. Under 0-psu conditions, dry biomass of E. intestinalis in the 1-day treatment was at least 74% higher than biomass from 5 day or longer treatments. Under 5-psu conditions, dry biomass of E. intestinalis in the 1-day treatment was 22% higher than biomass from the 5-day treatment and 40% higher than biomass from 11- and 23-day treatments. The same pattern occurred in 15-psu conditions; the 1-day treatment had 18% greater dry biomass than 5-day treatment and 34% more biomass than 11- and 23-day treatments. Under 25-psu conditions, 1-day treatment dry biomass was 10% higher than that of 5-day treatments, 21% higher than 11-day treatments, and 26% higher than 23-day treatments.
Enteromorpha intestinalis wet weight:dry weight ratios were significantly affected by
duration of exposure to low salinity and by salinity level (P50.0001 for both factors).
In 0- and 5-psu treatments, algae most frequently exposed to ambient salinity water had lower wet:dry weight ratios than algae from 5 day or longer treatments (Fig. 3b). Wet:dry weight ratios of E. intestinalis from 1-day treatments under 0- and 5-psu
conditions were ,10, making them similar to wet:dry weight ratios of algae from
15-psu and control conditions. Wet:dry weight ratios of algae from 5-, 11- and 23-day
treatments at 0 and 5 psu were all .10. Under 0-psu conditions, the 1-day treatment
wet:dry weight ratio was 37–47% less than ratios of 5-, 11- and 23-day treatments. At 5 psu, the wet:dry weight ratio from the 1-day treatment was 21–25% lower than ratios from the longer durations of exposure tested. There were only slight differences in wet:dry weight ratios among durations of exposure to low salinity under 15-psu conditions and none under 25 psu conditions.
Enteromorpha intestinalis reduced water column NO below detection limit during3
the last sampling period in all durations tested at 5, 15 and 25 psu (Table 2). NO was3
also below detection limit in the 0-psu 1-day treatment. However, exposure to 0 psu for
5 days or longer decreased uptake of water column NO by E. intestinalis; high amounts3
of NO remained in the water column in 0-psu 5-, 11- and 23-day treatments.3
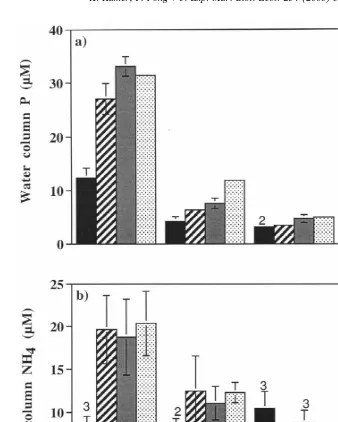
Final water column P was significantly affected by both duration of exposure to low
Fig. 3. Final mean dry biomass (a) and mean wet weight:dry weight ratios (b) of Enteromorpha intestinalis grown at 0, 5, 15 or 25 psu for 1-, 5-, 11- or 23-day periods alternated with 24 h at ambient salinity water (bars are61 S.E.).
in the 0-psu 1-day treatment (Fig. 4a) but remained near initial levels (31.4860.39mM)
in the 0-psu 5-, 11- and 23-day treatments. P was also removed from the water column by Enteromorpha intestinalis in 5-psu treatments and reduced to very low levels in 15-psu and control treatments. At 5 psu, the amount of P remaining in the water column increased as frequency of exposure to ambient salinity decreased.
Table 2
a Mean values of NO remaining in water column at end of experiment3
Treatment NO (3 mM) S.E.
0 psu 1 day Below detection limit
0 psu 5 days 188.6 34.5
0 psu 11 days 266.6 13.2
0 psu 23 days 280.5 10.9
5, 15, 25 psu
1, 5, 11, 23 days Below detection limit a
The 0-psu 1-, 5-, 11- and 23-day treatments are presented individually, and the 5-, 15- and 25-psu treatments at all durations of exposure tested are presented together. n54 in all cases. Initial value was 287.4161.63mM.
0.0007) but duration of exposure to low salinity did not (P50.7200) and much of the
data was highly variable. Under 0-psu conditions for 5-, 11- and 23-day treatments, NH4
accumulated in the water column (Fig. 4b) compared to initial concentrations
(6.4060.48 mM), while NH from the 0-psu 1-day treatment was only slightly higher4
than initials. Levels of water column NH from 5-, 15- and 25-psu treatments were near4
or slightly higher than initials.
Water column TKN values were not affected by either salinity level (P50.1391) or
duration of exposure to low salinity (P50.5402). Mean TKN ranged from 28.57 to
46.43 mM and the mean for all treatments was 35.3861.01 mM. There were no
discernible patterns with regard to either treatment factor.
4. Discussion
The results of this experiment suggest that there is a temporal limit to the tolerance of
Enteromorpha intestinalis to extremely low salinity. It is euryhaline as previous work
has concluded (Reed and Russell, 1979; Ritchie and Larkum, 1985a; Pringle, 1986; Edwards et al., 1987; Young et al., 1987a), but the period for which E. intestinalis can tolerate 0 psu is between 1 and 5 days. E. intestinalis was able to tolerate exposure to 0 psu without loss of biomass or pigmentation when conditions were alternated with ambient salinity conditions every other day. When treated with 0 psu for 5 days or longer, E. intestinalis experienced significantly decreased biomass and loss of pigmenta-tion.
Enteromorpha intestinalis exposed to 0 psu for 5 days or longer also exhibited
decreased dry weight, increased wet:dry weight ratios, decreased ability to remove N
and P from the water column, and an accumulation of NH in the water column. Each of4
these results indicates that exposure to extremely low salinity for at least 5 days can
have negative impacts on E. intestinalis. The NH that accumulated in the water column4
was most likely released from the algae as it suffered osmotic stress and began to
deteriorate. Sfriso et al. (1987) also recorded accumulation of NH in the water column4
due to macroalgal decomposition.
Fig. 4. Mean values of P (a) and NH (b) in water column at end of experiment (bars are4 61 S.E.). Initial P value was 31.48mM (S.E.50.39) and initial NH value was 6.404 mM (S.E.50.48). Analytical detection lower limit was 1.56mM for P and 3.57mM for NH . n4 54 except where otherwise noted by numbers above the bars; reduced sample size occurred when samples were below detection limits.
treatments than wet weight. Under 5-psu conditions, wet biomass measurements of
Enteromorpha intestinalis from 1- and 5-day treatments were similar while dry biomass
ratio of the 5-day treatment. The average wet:dry weight ratio of healthy E. intestinalis
is |10 (Fong, unpub. data; Kamer et al., unpub. data). As E. intestinalis deteriorates it
looses structural integrity and less water per unit of actual biomass is removed by centrifugation as compared to algae in good condition (K. Kamer, pers. obs.). This leads to an overestimation of wet weight and higher wet:dry weight ratios for algae in poor condition.
Other research has shown that when kept in 0 psu continuously Enteromorpha
intestinalis lost pigmentation (Edwards et al., 1988), biomass (Martins et al., 1999) and
ultimately died (Ritchie and Larkum, 1985a; Edwards et al., 1988; Martins et al., 1999). The congener E. prolifera also became achlorotic and died when kept in 0 psu continuously (Soe-Htun et al., 1986). A closely related genus, Ulva, has also been negatively impacted by reduced salinity. Murthy et al. (1988) found decreased growth of
U. lactuca below 30 psu as did Friedlander (1992) who also found that U. lactuca lost
biomass at salinity ,20 psu. Salinity of 8 psu caused bleaching and necrosis in
Gracilaria spp. (Bird and McLachlan, 1986) and 10-psu conditions decreased growth of Furcellaria lumbricalis, Fucus serratus, Chondrus crispus and Gracilaria tikvahiae
(Bird et al., 1979). Photosynthesis of Cladophora rupestris was significantly reduced by
salinity ,11 psu (Thomas et al., 1988) and Ectocarpus confervoides experienced
reduced growth when salinity was ,30 psu (Friedlander, 1992). Zedler et al. (1984)
found that exposure of algal mats to reduced salinity in southern California estuaries decreased mat productivity.
Our results suggest that fluctuating salinity extends the temporal limit of the tolerance of Enteromorpha intestinalis to extremely low salinity. When exposure of E. intestinalis to 0 psu was interrupted every other day with exposure to ambient salinity biomass increased, wet:dry wt ratio decreased, and uptake of water column nutrients increased. Therefore, while E. intestinalis was in poor condition after continuous exposure to 0 psu, a fluctuating salinity regime where 0 psu was alternated with 25 psu reduced the effects of continuous low salinity on E. intestinalis. Ritchie and Larkum (1985a) also found that a fluctuating salinity regime alleviated the negative effects of low salinity on E.
intestinalis though this was not the primary focus of their investigation. Their data
support our conclusion that E. intestinalis cannot survive prolonged exposure to low salinity without periodic exposure to high salinity.
At all salinity levels tested, Enteromorpha intestinalis had higher biomass the more often it was exposed to ambient salinity water. E. intestinalis could have responded positively to physical disturbance associated with handling especially if handling decreased the algae’s diffusive boundary layer. This could have occurred particularly because the algae were not distributed evenly throughout the water column but tended to float in a small mass near the top when healthy. However, we stirred all the experimental units daily to promote thorough mixing of the water column and avoid the build up of large diffusive boundary layers. Alternatively, while data showed that all treatments had adequate time to take up N and P from the water column, there may have been other trace elements in the water that we did not take into account and could have affected results.
Enteromorpha intestinalis can tolerate short-term fluctuations in salinity but can be
of E. intestinalis in urban estuaries that experience altered hydrology, such as increased freshwater flow, due to anthropogenic activities. We need not only to understand an organism’s responses to stress, but how stress affects its pattern of distribution and abundance. Persistent low salinity may decrease the abundance of E. intestinalis, and it may disappear from areas unless they experience intermittent exposure to high salinity. Continued monitoring of salinity, macroalgae and other estuarine organisms is needed to evaluate the effects of human development on population dynamics of estuarine species.
Acknowledgements
This work was funded by the California Water Resources Center, by the EPA Water
and Watersheds Program[R825381, and EPA Environmental Indicators[
R827637-01-0. We would also like to thank Chen Ying Chen, Risa Cohen, Jennie Lee, Jason Martin, Kristina Shagramanova, Natalie Shagramanova and Karleen Boyle for their assistance with this project. [SS]
References
Ahern, J., Lyons, J., McLelland, J., Valiela, I., 1995. Invertebrate response to nutrient-induced changes in macrophyte assemblages in Waquoit Bay. Biol. Bull. 189 (2), 241–242.
Bird, C.J., McLachlan, J., 1986. The effect of salinity on distribution of species of Gracilaria: an experimental assessment. Bot. Mar. 29, 231–238.
Bird, N.L., Chen, L.C.-M., McLachlan, J., 1979. Effects of temperature, light and salinity on growth in culture of Chondrus crispus, Furcellaria lumbricalis, Gracilaria tikvahiae and Fucus serratus. Bot. Mar. 22, 521–527.
Brito, R., Chimal, M.-E., Rosas, C., 2000. Effect of salinity in survival, growth, and osmotic capacity of early juveniles of Farfantepenaeus brasiliensis (decapoda: penaeidae). J. Exp. Mar. Biol. Ecol. 244, 253–263. Cawthorne, D.F., 1978. Tolerance of some cirripede nauplii to fluctuating salinities. Mar. Biol. 46, 321–325. Edwards, D.M., Reed, R.H., Chudek, J.A., Foster, R., Stewart, W.D.P., 1987. Organic solute accumulation in
osmotically-stressed Enteromorpha intestinalis. Mar. Biol. 95, 583–592.
Edwards, D.M., Reed, R.H., Stewart, W.D.P., 1988. Osmoacclimation in Enteromorpha intestinalis: long-term effects of osmotic stress on organic solute accumulation. Mar. Biol. 98, 467–476.
Eyre, B., Balls, P., 1999. A comparative study of nutrient behavior along the salinity gradient of tropical and temperate estuaries. Estuaries 22 (2A), 313–326.
Fong, P., 1986. Monitoring and manipulation of phytoplankton dynamics in a Southern California estuary. M.S. thesis, San Diego State University.
Fong, P., Donohoe, R.M., Zedler, J.B., 1994. Nutrient concentration in tissue of the macroalga Enteromorpha as a function of nutrient history: An experimental evaluation using field microcosms. Mar. Ecol. Prog. Ser. 106 (3), 273–281.
Friedlander, M., 1992. Gracilaria conferta and its epiphytes: the effect of culture conditions on growth. Bot. Mar. 35, 423–428.
Goreau, T.F., 1964. Mass expulsion of zooxanthellae from Jamaican reef communities after Hurricane Flora. Science 145, 383–386.
Greze, I.I., 1968. Feeding habits and food requirements of some amphipods in the Black Sea. Mar. Biol. 1, 316–321.
´
Jokiel, P.L., Hunter, C.L., Taguchi, S., Watarai, L., 1993. Ecological impact of a fresh-water ‘reef kill’ in Kaneohe Bay, Oahu, Hawaii. Coral Reefs 12 (3–4), 177–184.
Karsten, U., Kirst, G.O., 1989. The effect of salinity on growth, photosynthesis and respiration in the estuarine red alga Bostrychia radicans Mont. Helgol. Meeresunters. 43 (1), 61–66.
King, R.J., Hodgson, B.R., 1995. Tuggerah Lakes system, New South Wales, Australia. In: McComb, A.J. (Ed.), Eutrophic Shallow Estuaries and Lagoons. CRC Press, Boca Raton, FL, pp. 19–29.
Kirst, G.O., 1989. Salinity tolerance of eukaryotic marine algae. Annu. Rev. Plant Physiol. Plant Mol. Biol. 40, 21–53.
Kwak, T.J., Zedler, J.B., 1997. Food web analysis of southern California coastal wetlands using multiple stable isotopes. Oecology 110 (2), 262–277.
Lee, T.-M., 1998. Investigations of some intertidal green macroalgae to hyposaline stress: detrimental role of putrescine under extreme hyposaline conditions. Plant Sci. 138, 1–8.
Lowthion, D., Soulsby, P.G., Houston, M.C.M., 1985. Investigation of a eutrophic tidal basin: 1. Factors affecting the distribution and biomass of macroalgae. Mar. Environ. Res. 15 (4), 263–284.
Marcomini, A., Sfriso, A., Pavoni, B., Orio, A.A., 1995. Eutrophication of the Lagoon of Venice: nutrient loads and exchanges. In: McComb, A.J. (Ed.), Eutrophic Shallow Estuaries and Lagoons. CRC Press, Boca Raton, FL, pp. 59–79.
Martins, I., Oliveira, J.M., Flindt, M.R., Marques, J.C., 1999. The effect of salinity on the growth rate of the macroalgae Enteromorpha intestinalis (Chlorophyta) in the Mondego estuary (west Portugal). Acta Oecol. 20 (4), 259–265.
McBane, C.D., Croker, R.A., 1983. Animal-algal relationships of the amphipod Hyale nilssoni (Rathke) in the rocky intertidal. J. Crustac. Biol. 3 (4), 592–601.
McComb, A.J., Lukatelich, R.J., 1995. The Peel-Harvey estuarine system, western Australia. In: McComb, A.J. (Ed.), Eutrophic Shallow Estuaries and Lagoons. CRC Press, Boca Raton, FL, pp. 5–17.
Montgomery, H.A.C., Soulsby, P.G., Hart, I.C., Wright, S.L., 1985. Investigation of a eutrophic tidal basin: 2. Nutrients and environmental aspects. Mar. Environ. Res. 15 (4), 285–302.
Murthy, M.S., Sharma, C.L.N.S., Rao, Y.N., 1988. Salinity induced changes in peroxidase activity in the green seaweed Ulva lactuca. Bot. Mar. 31, 307–310.
Peters, G., Paznokas, W.E., Noyes, V., 1985. A review of nutrient standards for the coastal lagoons in the San Diego region. San Diego, California: California Regional Water Quality Control Board, San Diego Region. Pregnall, A.M., Rudy, P.P., 1985. Contribution of green macroalgal mats (Enteromorpha spp.) to seasonal
production in an estuary. Mar. Ecol. Prog. Ser. 24 (1–2), 167–176.
Pringle, J.D., 1986. Swarmer release and distribution of life-cycle phases of Enteromorpha intestinalis (Chlorophyta) in relation to environmental factors. J. Exp. Mar. Biol. Ecol. 100 (1–3), 97–112. Raffaelli, D., Hull, S., Milne, H., 1989. Long-term changes in nutrients, weed mats and shorebirds in an
estuarine system. Cah. Biol. Mar. 30 (2), 259–270.
Raffaelli, D., Limia, J., Hull, S., Pont, S., 1991. Interactions between the amphipod Corophium volutator and macroalgal mats on estuarine mudflats. J. Mar. Biol. Assoc. UK 71 (4), 899–908.
Reed, R.H., Russell, G., 1979. Adaptation to salinity stress in populations of Enteromorpha intestinalis (L.) Link. Estuar. Coast. Mar. Sci. 8, 251–258.
Richmond, C.E., Woodin, S.A., 1996. Short-term fluctuations in salinity: Effects on planktonic invertebrate larvae. Mar. Ecol. Prog. Ser. 133 (1–3), 167–177.
Rijstenbil, J.W., Haritonidis, S., van Drie, J., Malea, P., Wijnholds, J.A., 1993. Interactions of copper with trace metals and thiols in the macro-algae Enteromorpha prolifera (O.F. Mull) J. Ag., grown in water of the Scheldt Estuary (Belgium and S.W. Netherlands). Sci. Total Environ. 0 (Suppl. Part 1), 539–549. Ritchie, R.J., Larkum, A.W.D., 1984a. Chloride transport in Enteromorpha intestinalis. New Phytol. 97 (3),
319–346.
Ritchie, R.J., Larkum, A.W.D., 1984b. Sodium transport in Enteromorpha intestinalis. New Phytol. 97 (3), 347–362.
Ritchie, R.J., Larkum, A.W.D., 1985a. Potassium transport in Enteromorpha intestinalis: II. Effects of medium composition and metabolic inhibitors. J. Exp. Bot. 36 (164), 394–412.
Rudnicki, R.M., 1986. Dynamics of macroalgae in Tijuana estuary: response to simulated wastewater addition. M.S. thesis, San Diego State University, 82 pp.
Sfriso, A., Marcomini, A., Pavoni, B., 1987. Relationships between macroalgal biomass and nutrient concentrations in a hypertrophic area of the Venice Lagoon Italy. Mar. Environ. Res. 22 (4), 297–312. Sfriso, A., Pavoni, B., Marcomini, A., Orio, A.A., 1992. Macroalgae, nutrient cycles, and pollutants in the
Lagoon of Venice. Estuaries 15 (4), 517–528.
Sheader, M., Suwailem, A.M., Rowe, G.A., 1997. The anemone, Nematostella vectensis, in Britain: considerations for conservation management. Aquat. Conserv. 7 (1), 13–25.
Soe-Htun, U., Ohno, M., Mizuta, S., 1986. Effects of salinity and temperature on the growth of the green alga,
Enteromorpha prolifera, in culture. Rep. USA Mar. Biol. Inst. 8, 9–13.
Soulsby, P.G., Lowthion, D., Houston, M., Montgomery, H.A.C., 1985. The role of sewage effluent in the accumulation of macroalgal mats on intertidal mudflats in two basins in southern England. Neth. J. Sea Res. 19 (3 / 4), 257–263.
Thomas, D.N., Collins, J.C., Russell, G., 1988. Interactive effects of temperature and salinity upon net photosynthesis of Cladophora glomerta and C. rupestris. Bot. Mar. 31, 33–37.
Thornton, J.A., Beekman, H., Boddington, G., Dick, R., Harding, W.R., Lief, M., Morrison, I.R., Quick, A.J.R., 1995. The ecology and management of Zandvlei (Cape Province, South Africa), an enriched shallow African estuary. In: McComb, A.J. (Ed.), Eutrophic Shallow Estuaries and Lagoons. CRC Press, Boca Raton, FL, pp. 109–128.
Valiela, I., D’Avanzo, C., Foreman, K., Babione, M., Lamontagne, M., Hersh, D., Costa, J., Sham, C.H., Brawley, J., 1992. Couplings of watersheds and coastal waters sources and consequences of nutrient enrichment in Waquoit Bay, Massachusetts. Estuaries 15 (4), 443–457.
Valiela, I., Teal, J.M., 1979. The nitrogen budget of a salt marsh ecosystem. Nature 280, 652–656. Young, A.J., Collins, J.C., Russell, G., 1987a. Ecotypic variation in the osmotic responses of Enteromorpha
intestinalis (L.) Link. J. Exp. Bot. 38 (193), 1309–1324.
Young, A.J., Collins, J.C., Russell, G., 1987b. Solute regulation in the euryhaline marine alga Enteromorpha
prolifera (O.F. Muell). J. Agric. J. Exp. Bot. 38 (193), 1298–1308.
Young, D.R., Specht, D.T., Clinton, P.J., Lee, H.I., 1998. Use of color infrared aerial photography to map distributions of eelgrass and green macroalgae in a non-urbanized estuary of the Pacific northwest, USA. Proc. Fifth Int. Conf. Remote Sens. Mar. Coast. Environ. 2, 37–45.
Zedler, J.B., 1980. Algal mat productivity: comparisons in a salt marsh. Estuaries 3 (2), 122–131. Zedler, J.B., 1982. The ecology of southern California coastal salt marshes: a community profile: US Fish and
Wildlife Service.
Zedler, J.B., Principal Author, 1996. Tidal wetland restoration: a scientific perspective and southern California focus. La Jolla, CA: California Sea Grant College System, University of California.