Optimising product recycling chains by control theory
U. Kleineidam
*
, A.J.D. Lambert, J. Blansjaar, J.J. Kok, R.J.J. van Heijningen
Eindhoven University of Technology, Faculty of Technology Management, P.O. Box 513, NL-5600 MB Eindhoven, Netherlands
Received 15 March 1999; accepted 24 September 1999 Abstract
In this paper, a modelling method is described for production chains including recycling. It consists of elementary models of standard production operations, connected by market modules. The models are analysed using methods from control theory. These methods allow us to investigate essential properties of the chain concerning its dynamical behaviour, particularly with respect to stability and controllability. These properties are prerequisites for e!ective chain management, as in the evaluation of recycling policy. A case study on paper recycling was carried out to demonstrate the applicability of this method to practice. ( 2000 Elsevier Science B.V. All rights reserved.
Keywords: Recycling; Control theory; Product chain; Sustainability; Optimisation
1. Introduction
Modelling of material and energy #ows has
appeared to be a useful tool in economy, parti-cularly in the study of the behaviour of systems such as product life-cycle chains. A commonly
ap-plied method for chain modelling is the
prod-uct}process chain[1]. This is a chain consisting of alternate transformation processes and product
#ows between these processes. For environmental
purposes, the full material life-cycle within the
tech-nosystem, from `cradle to gravea, is frequently
modelled. In the simplest case it is linear, i.e. it excludes cycles. These linear chains are typically considered in gross energy requirement (GER) and
life-cycle assessment (LCA) studies [2}4]. In these
studies the environmental impact caused by a prod-uct is determined by adding the impacts of all the
*Corresponding author.
processes in the life-cycle of a product in a standard way. In common practice, however, the situation is growing more and more complex because of the increasing importance of the recycling of materials. Traditionally, the emphasis only was on the recycl-ing of process waste, i.e. the waste that is generated as an unintended by-product of production pro-cesses. Nowadays, there is a growing interest for post-consumer or product waste that originates from discarded products. This concern is closely
related to the economic bene"ts that can be
achieved by the enterprises in the chain, the concept of product responsibility and the intention to de-crease both resource consumption and waste quantity. Such a policy is often speci"ed by
catch-words such as closing the chain, although a fully
closed chain is neither obtainable nor desirable [5]. This idea, that stems from the study of the often
surprisingly e$cient functioning of the many
close-ly interwoven processes in nature, is studied in the
interdisciplinary "eld that is named according to
its biological counterparts: industrial ecology, industrial metabolism or industrial symbiosis. For realistic modelling the inclusion of recycle loops is indispensable.
The product}process chain model, in which
phys-ical #ows play an essential role, is controlled by
variousinformation#ows (orsignals). Each unit in
the model, typically a production enterprise, is a partially autonomous decision unit. There are, however, signals to the enterprise from other pro-duction units within the chain, usually based on
transactions (horizontal control). Moreover, the
authorities want to control the chain in such a way
that it acts as a whole in an optimal way (vertical
control). From the point of view of authorities, enterprises, and consumers, a proper policy should be implemented to obtain optimal results. Each
actor has di!erent purposes and is, moreover, able
to make the right decisions based on an optimal adaptation to its surroundings. This implies a com-plicated multi-level hierarchical decision structure and impedes a clear insight into the consequences of decision making, and the choice of optimal decisions.
Many studies in this "eld are restricted to
de-scriptive chain modelling (see for example [6] for a wide range of products from aluminium to packaging products). In fewer cases, the possibility is included of adaptation of internal variables of a mathematical model to external parameters. This holds for optimisation models in which systems operation or technology choice are incorporated. Such models are usually based on mathematical programming (MP-)techniques, such as static and dynamic linear programming, where the optimisa-tion criterion is expressed by an objective funcoptimisa-tion. So far, little attention has been paid to methods for model analysis that are available in systems and control theory. These are widely applied in mech-anical, physical and chemical systems, varying from relatively simple systems like robot arms, up to complex systems such as process industries and power plants. Although analogies between
com-pletely di!erent kinds of systems are abundant in
modelling, this has rarely been applied in studies on the meso, i.e. product chain, level.
A property of product chains, which can be
ana-lysed by control theory, is the controllability. It
embraces questions concerning, for instance, the
possibility for a system to reach a de"nite state
starting from some initial state or concerning the possibility to control a system in such a way that its state follows a de"nite trajectory over time. This is relevant to environmental policy, because environ-mental policy is concerned with reaching some tar-get, for example, a decrease of materials use by 10%, within a de"nite period of time, e.g. 5 years.
It is evident that the e!ectiveness of an
environ-mental policy strongly depends on the possibility of obtaining the proposed targets. In this paper, the application of systems and control theory is elabor-ated on some problems that are relelabor-ated to product chains. Both physical and economic aspects are incorporated, with an emphasis on the environ-mental policy. The resulting model is tested on an existing chain, viz. the Dutch paper chain. This
chain was selected because it includes an e!ective
recycling system. Moreover, it is well documented by rather extended time series of statistical data.
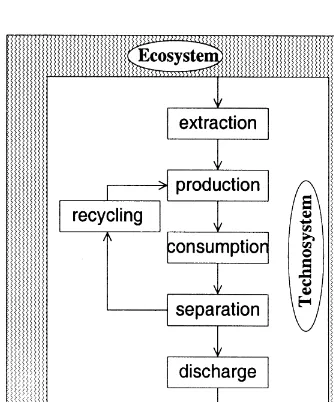
2. The product chain as a system
In industrial ecology (see, e.g. [1]) the physical world is subdivided into ecosystem and technosys-tem. The technosystem involves the settings that are designed and controlled by people. There is a mutual exchange of physical, i.e. material and
energy,#ows between these two systems. In a
sim-pli"ed presentation of the technosystem, #ows of matter and energy are successively extracted,
trans-formed into products, consumed, and "nally
discharged. This is the linear chain that is depicted
in the process}product scheme of Fig. 1. In the real
world modi"cations of the linear chain are
impor-tant. A fundamental extension is the inclusion of loops that represent recycling and reuse of process residues and discarded products. Usually, however, the process and product wastes are only partially recyclable due to technical and economic reasons.
There will always be some remaining#ows that are
discharged to the ecosystem. This is depicted in Fig. 2.
Although the aggregate #ows within the total
Fig. 1. The process}product scheme of a linear chain.
Fig. 2. The process}product scheme of a chain with recycling.
consequently, the#ows and the processes should be
disaggregated. When focusing on such a partial
#ow, for example paper and paper products,
ambi-guity arises in setting appropriate system bound-aries. Moreover there is an exchange of physical
#ows between di!erent production chains, which
cannot be included in the study up to the same extent. In the paper example paper is made of pulp, which in turn is made of wood. Clay and other paper chemicals are added, and so on.
Geographical system boundaries also play a role. In general, not the global system but rather the production system of a particular country or region is studied. This requires the de"nition of import and export. With further detail, disaggregation of production systems may also be needed. Paper production, for example, involves a sequence of
di!erent production steps, which may vary
accord-ing to the kind of paper product that is produced.
Di!erentiation between paper products is also
required with respect to the di!erent characteristics
these products have in the consumption and recycl-ing phases.
Disaggregation and recycling transforms the chains of Figs. 1 and 2 into complicated networks that consist of many strongly interconnected chains. Within these networks, basic modules can be discerned. In the following, the essential features of a basic module will be described and a model of such a module will be presented.
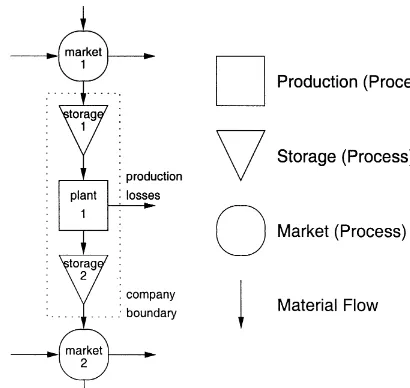
3. A generalised company model
As was stated before, a process}product chain is
considered to be a network of basic units, each represented by a generalised company model.
A characteristic of the product}process chain
de-scription is the succession of product #ows and
processes. Although the description deals with
physical #ows, these are controlled by economic
mechanisms. They are incorporated within the model by the introduction of markets. Transactions of products between the parts of the chain are
described by a market model * a market is the
interface between companies. Fig. 3 shows a
simpli-"ed#owchart of a company including two storage facilities, accompanied by two markets that refer to
the input and the output#ows of the system. The
boundary of the company subsystem is indicated
by the dashed line. As a company's basic activity is
the transformation of material#ows; it is
represent-ed as a process (square). Storage is representrepresent-ed by
Fig. 3. A company#owchart.
materials or semi-manufactured products and
orig-inate from a market; leaving#ows are products that
are directed towards another market.
These #owcharts are graphical representations
from which mathematical models can be derived providing insight into the functioning of the chain. As dynamic processes such as storage and dynamic markets play an important role, dynamic models are needed. Such a model is represented here as a set of di!erential equations.
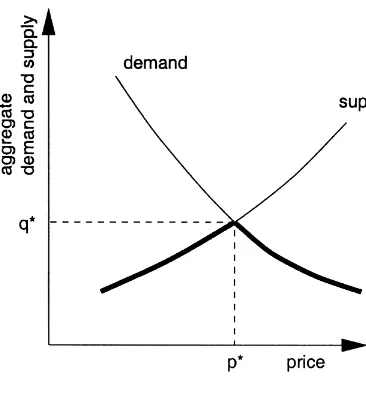
3.1. The market model
Here a market is considered to be a virtual place
in which a trade-o! between demand and supply
takes place. As a whole it is governed by some price mechanism. Although in economic science markets are crucial, the development of quantitative market
models has proven to be extremely di$cult [7}9].
In standard economic theory there is a demand curve that decreases with increasing price, and a supply curve that increases with increasing price. The intersection of these two curves is the market equilibrium. However, the shape of the curves is
a result of di!erent mechanisms (substitution,
change of real income, etc.) that cannot be analysed individually. As an extra complication, the dynam-ics of the system plays a role. Change in supply is
often not instantaneously possible, but requires preparations, such as investments in capital goods, or the recruitment of an appropriately skilled labour force. On the other hand, in the case that demand and supply are in disequilibrium on a mar-ket, the price adjustment will not occur instan-taneously but rather in a dynamic way. A normally functioning market is in equilibrium, but the point of equilibrium will gradually change, because the economy as a whole is not in equilibrium.
For the purpose of a chain model we assume
a strongly simpli"ed market model, which also
de-scribes non-equilibrium situations. To this purpose we observe that two quantities are measurable: the
tradet(in kg/yr), which represents the real product
#ow that enters or leaves the system, and theprice
p(in$/kg). Each of these quantities may vary over
time according to the time scale that is chosen.
It is assumed that there are di!erent producers
(indicated by the indexi) and consumers (indicated
by the indexj). The total supply and demand are
denoted bys
505andd505, respectively. The amount of traded products then reads as follows:
t"min(s505,d505). (1)
In Fig. 4, an example of demand and supply curves is depicted. In caset"s
505(d505there is scarcity, in the caset"s
505'd505there is excess. Competition
mechanisms between di!erent producers and
con-sumers are not modelled so that distribution pro-ceeds proportionally. This means that in case of
excess a producerisupplies the share
d
In case of scarcity a consumerjbuys the share
s505
d505di. (3)
When the production of some producer surpasses t
ithe remaining production is stored. This will only
be possible up to some extent however because storage is associated with costs, and the storage capacity is restricted.
Fig. 4. Supply and demand curves.
into account by dealing with an adjusting mecha-nism that may establish an equilibrium situation. There are two basic theories to describe such a mechanism: the Marshallian theory of quantity
adjustment that assumes a di!erence between
hypothetical prices as a driving force for adjusting
product #ows, and the Walrasian theory of price
adjustment that assumes a di!erence between
hypothetical product #ows as a driving force for
adjusting prices [10]. As in our description
hypo-thetical product#ows, viz. supply and demand, are
at the centre, the Walrasian description is adopted here. Its basic dynamics are described by the following:
p5"c(d
505!s505). (4)
Here cis a proportionality constant, measured in
$/kg2.
3.2. The company model
The company is represented by a stock of re-sources, a transformation process, and a stock of
"nished products, see Fig. 3. Production is adjusted
according to the di!erence between the actual
amount of "nished products and a prede"ned
norm. Let us, for the sake of simplicity, assume that
there is only one producer and one consumer. In this case the subscriptsi,jand tot are omitted. It is assumed that the producer produces to stock, so that the production equals
q"c
1(gs!g) with q*0. (5)
Here g
s is the desired stock, gis the actual stock
and c
1 a proportionality constant expressed in
yr~1. For the stock of"nished products the follow-ing equation holds, because of mass conservation:
g5"q!t. (6)
As a matter of fact, all storage processes are
described by di!erential equations similar to (6).
When companies and markets are combined to a chain or network, markets are nodes for which
the entering#ows equal the leaving#ows because
markets have no storage capacity.
In the model, discontinuities in the functions or in their derivatives occur frequently. Examples are (1), see Fig. 4, and cases in which a splitting of
product #ows takes place. When, for example,
waste is generated, the decision for recycling or
"nal processing might be taken on the basis of the processing costs. In standard modelling techniques like linear programming these discontinuities do
not cause essential di$culties; in control theory,
however, they are usually smoothened.
As an example, for the recycling percentage, the Heaviside function is replaced by the smoothening function, see Fig. 5:
f(p)"1
2(1#tanh(c2(p!p&1))). (7)
Herep
&1is the"nal processing price andf(p) is the
recycling percentage, p is the price for recycling,
c
2 is a constant of proportionality, expressed in
kg/$. In the model incineration is taken as the"nal
processing technology. Thus, directly in#uencing
the incineration price is a method for controlling the recycling percentage.
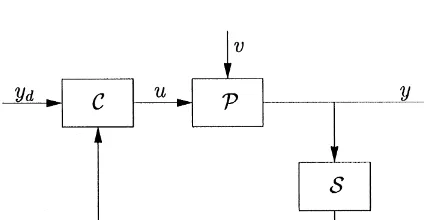
3.3. Chain dynamics
Information#ows (signals) rather than physical
#ows are essential to control theory. The abstract
elements of a simpli"ed control system are given in
Fig. 6. It consists of a processPthat is
Fig. 5. The recycling percentage as a function of the pricepof a product.
Fig. 6. The abstract elements of a control system.
external disturbances, which are denoted byv. The
output signal from the process isy. It is measured
by a sensorS, which produces the measured signal
y
.. The measured signal is compared with the
desired signal y
$ by a controllerC that produces
the control signalu. This signal is fed to the process. The process dynamics are described by the follow-ing evolution equations:
x5"f(x,u,v), (8)
y"g(x,u,v). (9)
For a generalised production system the state
vector is composed of the stocks in the di!erent
storage facilities and the market prices. Eq. (8)
is called the state equation, and it describes the complete chain dynamics. Eq. (9) expresses the out-put as a function of state, inout-put, and disturbances. The set of equations is a standard way of describing a system in control theory, be it physical, chemical, or economic.
4. A chain model:The Dutch paper chain
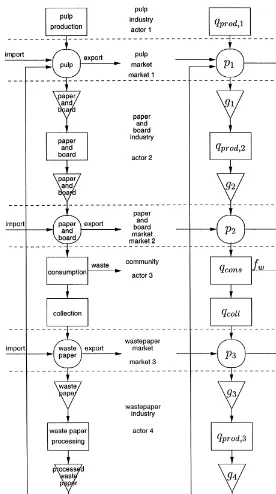
In this section, a model of a chain is described on the basis of a combination of generalised producers. Several transformation processes are linked, among which a consumption process. One recycle loop is present.
4.1. The chain model
The model that is presented in Fig. 7 is based on the present situation in the Netherlands. Actually, used paper contributes for a considerable part to the raw materials supply, which further consists of primary pulp. Another secondary resource, process waste, is not described by the model, as it is
incorp-orated implicitly in the producer's characteristics.
For the sake of simplicity, existing control mecha-nisms as determined by the Dutch Paper Fibre Convenant (including a takeback obligation for used paper and the determination of a guaranteed price), are omitted in the model. Fig. 7 shows the
#ows of paper, cardboard and their waste as they
currently are encountered in the Dutch paper chain: the paper industry buys a mix of primary pulp and processed wastepaper (secondary pulp) at their respective markets. Subsequently, the paper and board industry supplies the virgin paper it has produced to the paper and board market (market 2). The paper and board market also experiences supply from foreign suppliers. Part of the bulk paper and board is bought by the paper and board product industry, which converts these raw materials into products of paper and board (printed paper, cardboard packaging boxes, and so on).
Currently, wastes from the sector (o$ces, shops,
Fig. 7. The#owchart of the paper chain.
large and many-branched network of wastepaper
collection, largely kept up by non-pro"t
associ-ations. There is no market between paper and board consumption and its collection. The
col-lected#ows form a supply to the wastepaper
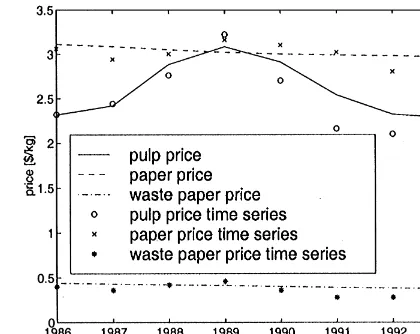
Fig. 8. Model outcomes with estimated parameters.
supply waste paper to the market or decide to incinerate it.
4.2. Paper chain modelling
The dynamic variables involved in the presented
model are included in the system's state vectorx.
According to Fig. 7, this vector consists of seven
elements: the prices p
1 through p3 (prices of
pri-mary and secondary pulp, and paper) and the
stocksg
1 through g4 (primary pulp, paper, waste
paper, and secondary pulp). In the model, control
takes place by economic instruments. It is e!
ec-tuated here by in#uencing the prices: by setting the
incineration price or by imposing taxes on primary pulp and on paper, respectively. So the input vector
uconsists of three components. Disturbancesvare
imposed on the system by external supply and demand. These are present for pulp, paper, and
waste paper, so that the disturbance vectorvhas six
components here. When the control aims to mini-mise the environmental impact, the output vector
ymight consist of components that represent the
material and product #ows. Combining all the
company and market models and using the nota-tion introduced above leads to a model in the usual state space notation (8) and (9).
5. Model evaluation
5.1. Parameter adjustment
Apart from variables, parameters are encoun-tered in the model that is described here, for example the proportionality constants in (4), (5)
and (7). Several standard parameter identi"cation
techniques exist in control theory, see for example [11]. Here we adjust the parameters by minimising
the squared di!erence between the model outcomes
and available time series. The available time series, which were collected by National Statistics, are given by the prices of pulp, paper, and waste paper. Unfortunately the amount of available data is rather limited here, and the accuracy of these data is somewhat uncertain. Therefore the result of the adjustment must be considered as a rough estimate of the appropriate parameter values. Fig. 8 shows
the course of the yearly averaged prices of the
di!erent products in the paper chain as they
were observed in the period from 1986 to 1993. The model outcomes with a particular parameter set are represented by lines. As can be seen from the"gure they closely approximate the chain be-haviour.
5.2. Stability analysis
An essential characteristic of dynamic systems, which can be analysed by control theory, is its
stability. A system is said to be stable if its state
evolves into a certain constant value. Stability of the controlled system is an absolute requirement since its absence causes signals to grow beyond any limit, eventually destroying and breaking down the system. As an example, an unlimited growth of some price will bring the economic rela-tions in the product chain to an end, a situation which is certainly undesirable for any of the chain actors.
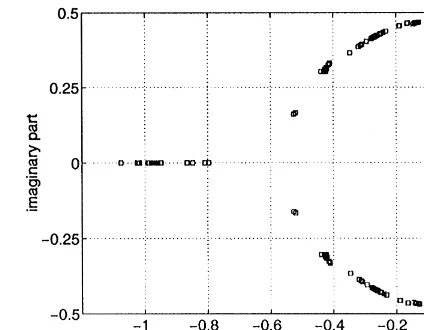
Decisive stability analysis for systems like this, in which discontinuities and non-linearities are en-countered, is a complex task, but two methods are
indicative with respect to stability. Simulationcan
be carried out with the known parameters in-cluded in the system. Results of this calculation are shown in Fig. 9, which represents the state
variablesx
Fig. 9. The stable chain.
Fig. 10. Eigenvalues of the system matrix.
simulation horizon. The simulation indicates stab-ility, albeit for a particular set of initial values.
The second method is based on linearisation
around the points of the system trajectory (x
0(t),u0(t),v0(t)). Via the decomposition around
this reference trajectory (where *x"x!x
0, *u"u!u
0,*v"v!v0), (8)}(9) is linearised. As a result of this transformation (8)}(9) can be written as follows:
*x5"A*x#B*u#E*v,
*y"C*x#D*u#F*v, (10)
withA,B,C,D,E,Fmatrices of appropriate dimen-sions. These relations are valid in a neighbourhood of the reference trajectory. For the linearised system linear control systems analysis can be applied. According to standard linear control theory a
system is stable if the eigenvalues of the matrixA
lie in the left complex half-plane. For the
pro-duct chain system the eigenvalues ofAare depicted
in Fig. 10 for some selected points of the same trajectory as in Fig. 9. As the state vector has seven
components, the matrix A, at each point of the
trajectory, has seven eigenvalues, some of which can coincide. It is shown here that the linearised model is indeed stable because the eigenvalues of the system matrix lie in the left complex half-plane.
5.3. Controllability analysis
In complex systems, the question of the selection of the inputs that are used for system control is relevant. In a typical plant, for example, many possibilities for process control exist, but sensitive-ness of the output to various inputs can be signi"cantly di!erent. The same might be true for production chains. The relevant question here is whether or not the system is controllable by the selected inputs. A system is said to becontrollableif, for a given initial situation, each value of the state
xcan be reached at a chosen time¹by an
appro-priate choice of the input u. In standard linear
control theory (see, e.g. [12]) controllability can be assessed by examining the rank of the so-called
controllability matrixC"[B AB2An~1B] with
AandBfrom (10), see the Appendix for an
illustra-tive example. For controllability the rank ofCmust
be of the same magnitude as the number of
elements in the state vectorx. Fig. 11 shows the
rank of the product chain controllability matrix for the given trajectory. As the rank of this matrix
varies between two and "ve, the value of the full
Fig. 11. Rank of the controllability matrix.
6. Conclusions
The study of chain dynamics is relevant for appropriate control of product chains, which is of considerable economic, societal, and
environ-mental interest. Control theory o!ers the tools to
analyse system models with respect to essential properties, such as stability and controllability. These tools have long been used to deal with this kind of problem mainly for dynamical mechanical, electrical and chemical systems, and appear to be particularly suited for the analysis of product chains, because product chains show analogues to technical systems. Starting out with a standard production system description, chains can be com-posed.
For the example of the paper chain, some results of stability and controllability analysis are shown. It is made clear that controllability analysis can
help us to "nd strategies to identify the ways to
in#uence product chains. On the basis of the
pre-sented model of the paper chain, it can be con-cluded that the chain is not controllable by the incineration price and taxes on pulp and paper. Additional instruments such as regulatory instru-ments and convenants between government and industry should be taken into consideration.
A principle restriction of the model is that a lin-ear approximation is applied. Further analysis with
inclusion of the non-linear structure of the models is therefore necessary to obtain more general results.
Appendix
As an example to illustrate the controllability of a system, consider the simple two-dimensional linear system de"ned by the following:
x5"
C
1 01 1Dx#
C
1
0
D
u"Ax#Bu. (A.1)For this system the controllability matrix is given by
C"[B AB]"
C
1 10 1D
and has full rank: two. On the other hand if the
input matrixBis changed to
B"
C
01
D
, then C"C
0 0
1 1Dwith rank
C"1.
The"rst system is controllable whereas the second is not. This is intuitively clear because in the second
example only the second component of x5 can be
in#uenced by the inputubutx
2, in turn, does not in#uencex
1because the upper right element ofAis
0. Thusx
1cannot be altered into any desired value.
References
[1] R.U. Ayres, Industrial metabolism, in: J.H. Ausubel, H.E. Sladovich (Eds.), Technology and Environment, National Academy Press, Washington, DC, 1989, pp. 23}49. [2] IFIAS, Report of the International Federation of Institutes
for Advanced Study, Workshop no. 6 on Energy Analysis, Guldsmedshyttan (S), 1973.
[3] J.B. GuineHe, H.A. Udo de Haes, G. Huppes, Quantitative life cycle assessment of products, Part one: Goal de"nition and inventory, Journal of Cleaner Production 1 (1) (1993) 3}13.
[5] T.E. Graedel, B.R. Allenby, Industrial Ecology, Prentice-Hall, Englewood Cli!s, NJ, 1995.
[6] R.U. Ayres, L.W. Ayres, Industrial Ecology: Towards Closing the Materials Cycle, Edward Elgar, Cheltenham, 1996.
[7] K.J. Arrow, F.H. Hahn, General Competitive Analysis, Holden-Day, San Francisco, CA, 1971.
[8] G. SchwoKdiauer (Ed.), Equilibrium and Disequilibrium in Economic Theory, Reidel, Dordrecht, 1978.
[9] C.R. Plott, G. George, Marshallian vs. Walrasian stability in an experimental market, The Economic Journal 102 (1992) 437}460.
[10] A. Takayama, Mathematical Economics, Cambridge Uni-versity Press, Cambridge, 1985.
[11] J.P. Norton, An Introduction to Identi"cation, Academic Press, London, 1986.