PROSPECT OF FORMING A COMMON CURRENCY
AREA IN ASEAN-10 COUNTRIES
THESIS
Submitted to conclude the Bachelor Studies At The Faculty of Economics
Diponegoro University
Written By:
DINAR RINDI PAWITRA ISLAMI NIM. C2B605125
ECONOMIC FACULTY
DIPONEGORO UNIVERSITY
ABSTRACT
This study aims to examine the feasibility and prospect of ASEAN-10 countries for common currency area. According Sigma Convergence Criteria defined by Chowdhury (2004), sigma convergence model is proposed whereby available convergence played as a good model to examine the feasibilities of economic indicators to support the prospect of ASEAN-10 countries to create common currency area.
Method that is used in this research consists of the EMU (European Monetary Union) model principle in launching their single currency (Pitchford and Cox, 1997) and the sigma convergence model (Chowdhury, 2004). Pitchford and Cox (1997) edited the European Monetary Union (EMU) principles for launching single currency for Europe. This research studies economic indicators that have been used, according to the editors of EMU principles for launching single currency for Europe, there are; Consumer Price Index (CPI), Real Exchange Rate in US dollars (RER), Growth rates of Foreign Exchange Reserves (GFER), Growth rates of Real Volume of Trade (GRVT), Growth rates of Real Relative Volume of Trade (GRRVT), and Growth rates of Per Capita Real GDP at factor cost (GRYPC).
Through Eviews-6 this research studies examined the panel data cross section sigma convergence econometrics model, in which the result shows that the β coefficient of all economic indicators value are negative, whether this result according to Chowdhury (2004) show signs as convergence over the whole period of 1992s through 2009s, which means that the six indicators that examined by this research support the feasibility of ASEAN-10 countries to create common currency area. This convergence result also convinces that ASEAN-10 countries have a good prospect of forming a common currency area as their single currency to enhance their economic performance to a brighter future.
Keywords: Common Currency Area, Convergence Criteria, ASEAN-10 countries, CPI, RER, GFER, GRVT, GRRVT, GRYPC
ACKNOWLEDGEMENT
Praised to be ALLAH The Most Gracious The Most Merciful, Who has always Guide me. It is only because of His Love of Arkhammar Ra Khimin that this final assignment titled ‘Prospect of Forming a Common Currency Area in ASEAN Countries’ is now completed.
This final assignment is written to fulfill the final requirement to graduate from the Faculty of Economics of Diponegoro University. The goal of the study is to gain an insight on the possibility of common currency area in ASEAN-10 countries.
Writing this final assignment has given me a lot of learning. It was really challenging and full of hikmah also seasoned with stressful experiences sometimes, it help me to explore a wider horizon of behavioral science, which I enjoyed the most with syukur and pasrah also tawakkal to ALLAH SWT.
I am also indebted for the presence, support, advices, and love of many kind people. Therefore, I would like to thank to:
1. Prof. DR. Dr. Susilo Wibowo, M.S.Med.,Sp.And as Rector of Diponegoro University Semarang Indonesia, which is encourage me to finish my study through discussion with My Papa.
2. Sukinta, SH, M.Hum as The Thirds vice Rector of Diponegoro University, jazakallah khairan katsira Sir, for your wise advices and tausiah for me, it’s encourage me so much to finish this major study, I am really appreciate it.
3. Dr. H. M. Chabacib, Msi, Akt as The Dean of Economic Faculty Diponegoro University Semarang Indonesia, jazakallah khairan katsira for your kindness advices to solve my academics thesis challenge.
4. Prof. Dr. Arifin, M. Com. Hons., Akt. As The First vice Dean of Economic Faculty Diponegoro University Semarang Indonesia, jazakallah khairan katsira Sir, for your guidance and support to me, which is encourage me to finish my thesis.
5. Prof. Dr. Purbayu Budi Santoso, Ms as The Second vice Dean of Economic Faculty Diponegoro University Semarang Indonesia, jazakallah khairan katsira Sir, for your Inspiring motivation.
6. Mrs. Evi Yulia Purwanti., SE., MSi as Director of Reguler-2 IESP major, thank you for your patient, affection, and support, which is encourage me to stand firm and back in a big spirit to finish my study, I am really appreciate it so much, and I am very glad to have a very kind lecture like you.
7. Johana Maria Kodoatie, SE., MEc, Ph.D, as my thesis supervisor, who has helped me a lot with her thoughtful advisers, bright ideas, patience, and wisdom in every meeting. Mam, I really appreciate the time and advices that you have given to me, thank you very much for everything, I am very lucky to have you as the best Supervisor ever for my thesis.
8. Prof. Dr. FX. Sugiyanto, MS, as the treasury of economics principle, who encourage me through multiplier theory that full of mathematics and analysis. Sir, I really appreciate the teaching style of yours that introduce us to facing the hardest things first than quick to change the positioning into smart in analysis in the after, then it help me more understand the meaning of struggling deeper and wider in understanding the economics theory. 9. Prof. Dra. Hj. Indah Susilowati, MSc, Ph.D, as my muslimah professor that I adore so
shining through your beautiful of jilbab. I hope that there will be so many people who adore you, and inspired by you as smart muslimah, solihah wife and solihah mother, amin..amin..amin ya Rabbal alamin.
10. Prof. Drs. Waridin, MS, Ph.D, as my motivator lecture. Thank you for guide us to be a better person, through confidence and respect each other, where it guide us to face our own frightens of life calamity and be confidence to be rahmatan lil alamin for human being.
11. Prof. Dr. H. Miyasto, SU, as my innovative lecture. There so many things that could be easier while we were inside of your macro economics class. Every single things of macroeconomics theory that seems like difficult and so scaring it changes into something that very enjoyable and fun, and you successfully changes the paradigm of difficulties to gain the best mark in macroeconomics study, jazakallah khairan katsira Sir, I am very speechless to described all about you into the words.
12. Prof. Dr. H. Suroso Imam Zadjuli, SE. as chief of Islamic economic post graduate program of Airlangga University. While storm and thunder seems like hit my faith to stand firm in this economics major, you came with sunlight in my darkness world, with full of Islamic Economics spirit, you give me figure of world future as the new beginning of the brighter Indonesian economics future, then I realize that is no reason for me to give up in this economics field of struggle, jazakallah khairan katsira Sir, for all your guidance and prayers, I really appreciate it so much.
13. Prof. Dr. H. Effendi, SE., as chief of Economics science post graduate program of Airlangga University. Jazakallah khairan katsira for all the wise guidance of spirit and all the prayers that encourage me to finish my economics study.
14. Prof. Dr. H. Mubiar Purwasasmita, as professor of Institute Teknologi Bandung. Je vous remercie de votre aide (thank you for your help), through your guidance now I understand the problem solving of my difficulties in languages, J’apprecie votre gentillesse (I appreciate your kindness) to listened all my sharing in languages problems and also my economics study problems in a very mixed language of English, Indonesian, Javanese, Chinese and France at that time, with patient you guide me step by step to understand that all kind of problems that I faced is a kind of Islamic faith examination of how to find the meaning of sabar, struggling and istiqomah, merci pour tout (thank you for everything).
15. Prof. Dr. H. Laode M. Kamaluddin M.Sc. M.Eng, as Rector of UNISSULA World Class Cyber University, gamsahamnida (thank you in Korean language), jazakallah khairan katsira Sir, for all the support and prayers that encourage me to finish my economics study. In my childhood I was wondering, is there any possibilities to be a scientists and also a business actor in the same time, then finally I met you and I know that it is possible. From your life achievement, I inspired by you, to advancing my Economics, IT, Engineering and Business Administration background into a higher level of world class standard of knowledge with the pure of spirit to reaching Ridho of ALLAH SWT, through to be rahmatan lil alamin.
17. Dr. Subroto, SE., MM., as my economic syariah supervisor, which is guide me to the whole of perspective in thesis understanding. Jazakallah khairan katsira Sir, wish you all the best.
18. Maruto Umar Basuki, SE, MSi, as my entrepreneur lecture that inspired me so much and help me to found the beauty inside economics science behind the entrepreneur sight of view. Jazakallah Sir, your contribution of monetary perspective helped me to finish this thesis.
19. Dr. Hadi Sasana, SE, MSi. as my sparkling lecture, the most unforgettable things for students is while got reading and summary homework from their lecture, and I am very lucky to have this kind of home work from you Sir, because from this home work, I can read so many new arrival books in English version that was enrich my knowledge and sight of view.
20. Drs. Nugroho SBM, MSP., as my wise lecture, thank you for all your patient in teaching me monetary theory, although you are know me well that I am so busy with all my engineering project but you keep on patient to guide me and help me to advanced my monetary theory, thank you Sir, wish you all the best.
21. Dra. Herniwati Retno Handayani, MS as my spirit lecture, dear Mam, you are so beautiful and cheerful, I am so lucky to have you as my lecture, your spirit encourage me so much like sun shining in a blue sky.
22. Nenik Woyanti, SE., MSi., as my math inspiring lecture, thank you for all your love that help me to be motivated to facing mathematics with smile.
23. Drs. H. M. Bedjo Santoso, MT. as my International Islamic Supervisor from IIUM (International Islamic University Malaysia), Malaysia and Indonesia seems like very near, thank you for all your guidance and support that very inspiring and motivating. 24. Hartono S.S, M.Pd, as my English Review Advisor from UNISSULA World Class Cyber
University, jazakallahu khairan katsira for all your help and patient in guidance my thesis, I really appreciate it.
25. Mr. Bukhari and family, as my advisor from Singapore. Sie sie (thank you in Chinese language), jazakallahu khairan katsira for all your guidance, advices and prayers. In Singapore you have been shown me how you get involve through economy, IT and engineering for developing your country, and you also encourage me to advance my study to complete my personality to be kaffah muslimah, your spirit of Islam in Singapore also encourage me to have a big spirit to keep my hearth in peaceful of Islam in Indonesia…insyaAllah…amin..amin….ya Rabbal alamin.
26. Ir. Fatchur Rohman as my GM (General Manager) of Megah Agung Energy Electrical Engineering Contractors Enterprise, thank you for your permission and support that encourage me to finish my economics study.
27. Ir. Widji Oetami, MM. as my Chief Commissioner of Megah Agung Energy Electrical Engineering Contractors Enterprise, thank you for encourage me to finish my economics study.
28. To all Administration staff of Diponegoro University, thank you for your help and support.
29. To all my friends of IESP 2005, specially dik Dany, dik Yunanto, dik Edwin, and to whom that I could not mention it one by one, thank you for all your help and support. 30. To all my staff at Megah Agung Energy Electrical Engineering Contractors Enterprise,
31. My Beloved parents, Dr. Ir. H. Didik Eko Budi Santoso, MT and Pudjiati Sulis Anharin, AhT, jazakallah khairan katsira for every hard work and sacrifices you have done to me, and for every prayer, and love that you given to me. I Love You Papa…,Mama…I love you so.
32. My Inspiring Brothers, dik Rendy Immaduddin Islami Putra, B.H.Sc and dik Wildan Lazuardi Akbar Islami, thank you for all your help and support ya dik, and please keep on your mind that in fact, you will be a Business Man although you have different background of study, because of that reason lets encourage ourselves to be Islami Entrepreneur ever, good luck my dearest dik Rendy and dik Wildan, insyaAllah you can do it.
33. My Dearest Eyang Kakung H. Moch. Yasin Sampoerno and Eyang Putri Hj. Miskiyati, jazakallah khairan katsira ya Eyang for all the prayers, I am sorry to make you worried about me because of the long period of struggle in this thesis.
34. To all my uncle’s, aunt’s, brothers, sisters and Umi that always give me motivation and prayers from Qatar, Abu Dhabi and from all part of Indonesia, thanks for everything, jazakallah khairan katsira.
Semarang, 21th June 2010
TABLE OF CONTENTS
Page
TITLE PAGE ... i
APPROVAL ………... ... ii
PASSING THESIS EXAMINATION APPROVAL ……… iii
STATEMENT OF THESIS ORIGINALITY ... iv
ABSTRACT ... v
CHAPTER III DATA AND METHODOLOGY……….. 100
3.1 Research Variables and Operational Definition………. 100
CHAPTER IV FINDINGS AND ANALYSIS………... 123
4.1 Description of Research Object………. 123
CHAPTER V CONCLUSIONS, LIMITATIONS, AND FUTURE RESEARCH AGENDA 176 5.1 Conclusion………... 176
LIST OF TABLES
Page
Table 1.1 Growth &Volatility of World Output & Trade 1870-1990 ………... 2
Table 1.2 Average of Annual Net FDI Flows 1980-2007……….. 6
Table 1.3 ASEAN Intra and Extra Trade 2006 ………... 7
Table 1.4 ASEAN Key trade by Region 2006 ……….. 14
Table 1.5 Basic Characters of China, Japan, and Korea 2005 ………... 15
Table 1.6 Basic Characters of Germany, France, and Italy 2005 ………... 15
Table 1.7 GDP Growth Correlation China, Japan, and Korea 1979-2004 ………... 21
Table 1.8 GDP Growth Correlation China, Japan, and Korea 1972-2000……… 21
Table 1.9 Trade Intensity Index 1999……… 26
Table 1.10 Trade Intensity Index 2004……… 26
Table 1.11 Exchange Rate Arrangements and Anchors of Monetary Policy……….. 31
Table 1.12 Inflation (GDP Deflator) Correlation China, Japan, and Korea 1979-2004……. 33
Table 1.13 Inflation (GDP Deflator) Correlation Germany, France, and Italy 1972-2000… 33
Table 1.14 Real Effective Exchange Rate (REER) China, Japan, and Korea 1979-2004….. 36
Table 1.15 Descriptive of REER China, Japan, and Korea 1979-2004……….. 36
Table 1.16 Real Effective Exchange Rate (REER) Germany, France, and Italy 1975-2000. 36 Table 1.17 Descriptive of REER Germany, France, and Italy 1975-2000………. 37
Table 1.18 Correlations of Real Supply Shock China, Japan, and Korea 1980-2000……… 38
Table 1.19 Correlations of Real Supply Shock Germany, France, and Italy 1980-2000…… 38
Table 1.20 Correlations of Real Demand Shock China, Japan, and Korea 1980-2000…... 38
Table 1.21 Correlations of Real Demand Shock Germany, France, and Italy 1980-2000... 39
Table 1.22 Correlations of Monetary Shock China, Japan, and Korea 1980-2000………… 39
Table 1.23 Correlations of Monetary Shock Germany, France, and Italy 1980-2000……… 39
Table 1.24 Trade Indices for ASEAN countries 1996-2001……….. 43
Table 1.25 Correlations of Aggregate Supply Shocks across the ASEAN Nations 2005…. 44
Table 1.26 Correlations of Aggregate Demand Shocks across the ASEAN Nations 2005… 46
Table 1.27 Correlations of Exchange Rates per US dollar for five ASEAN Nations 2005… 47
Table 1.28 Correlations of Exchange Rates to US dollar for five ASEAN Nations 2005... 47
Table 1.29 Real GDP Growth Correlations in ASEAN-7 1980-2007………... 49
Table 1.30 Inflation Correlation Matrixes 1980-2007………... 50
Table 1.31 Total Labor Productivity, Average Annual Growth Rate (%)………... 51
Table 2.1 Prior Studies……….….. 85
Table 4.1 Hausman Test Result……….. 164
Table 4.2 Normality Test Result………. 164
Table 4.3 Durbin-Watson Test Result………. 165
Table 4.4 Heteroscedasticity Test Result………...166
Table 4.5 Jointly Regression Coefficient Test (F test)……….... 167
Table 4.6 Individuality Coefficient Regression Test (t-Test)……….…. 168
Table 4.7 Determination Coefficient Test of R2……….…. 168
Table 4.8 Panel EGLS (Cross-Section SUR) CPI on Time……….… 170
Table 4.9 Panel EGLS (Cross-Section SUR) RER on Time………... 170
Table 4.11 Panel EGLS (Cross-Section SUR) GRVT on Time……….……….. 171
Table 4.12 Panel EGLS (Cross-Section SUR) GRRVT on Time……….…………... 172
Table 4.13 Panel EGLS (Cross-Section SUR) GRYPC on Time……….…………... 172
LIST OF FIGURES
Page
Figure 1.1 GDP (constant 2000) China, Japan, and Korea 1979-2004 ………... ……. 16
Figure 1.2 GDP per capita China, Japan, and Korea 1979-2004 ………..…………... 16
Figure 1.3 GDP Germany, France and Italy 1972-2000………..………... 17
Figure 1.4 GDP per capita Germany, France and Italy 1972-2000………..………... 18
Figure 1.5 GDP Growth China, Japan, and Korea 1979-2004 …………..…………... 19
Figure 1.6 GDP Growth Germany, France and Italy 1972-2000 ………..……… 20
Figure 1.7 FDI Outflow Japan 1996-2004 ………..………... 24
Figure 1.8 Trade China, Japan and Korea 1979-2003 ………..…………... 25
Figure 1.9 Trade Germany, France, and Italy 1772-2000 ………..………... 25
Figure 1.10 Trade Intensity Index China, Japan, and Korea 1991-2004 ………..…………. 26
Figure 1.11 Trade Intensity Index Germany, France and Italy 1988-2000 ………..……….. 27
Figure 1.12 Bilateral Trade Share of Total Trade 1995-2004 ………..…………... 28
Figure 1.13 Structural of Output 2004 ………..…………... 28
Figure 1.14 Structural of Output 2000 ………..…………... 29
Figure 1.15 Money and Quasi Money (M2) China, Japan, and Korea 1979-2004 ……….... 30
Figure 1.16 Inflation (GDP Deflator) China, Japan, and Korea 1979-2004 ………..……… 32
Figure 1.17 Inflation (GDP Deflator) Germany, France and Italy 1972-2000 ……….. 32
Figure 1.18 Money and Quasi Money China, Japan, and Korea 1979-2003 ……..………... 33
Figure 1.19 Money and Quasi Money China, Japan, and Korea 1979-2003 (%GDP)……... 34
Figure 1.20 Nominal Exchange Rate China, Japan, and Korea 1979-2003 ………..……... 34
Figure 1.21 Real Effective Exchange Rate China, Japan, and Korea 1980-2004 ………... 35
Figure 1.22 Research Problem Formulation ………..………. 58
Figure 2.1 Conceptual Framework ………..…………... 86
Figure 2.2 Research Procedure ……..……..…………... 87
Figure 3.1 Durbin-Watson ………..………. 117
Figure 4.1 CPI Combined Cross Section Graph (1992-2006) ………..………... 139
Figure 4.2 CPI Combined Cross Section Graph (1995-2009) ………..………... 140
Figure 4.3 CPI Individual Cross Section Graph (1992-2006) ………..…………... 141
Figure 4.4 CPI Individual Cross Section Graph (1995-2009) ………..………... 142
Figure 4.5 RER Combined Cross Section Graph (1992-2006) ………..………... 144
Figure 4.6 RER Combined Cross Section Graph (1995-2009) ………..………. 144
Figure 4.7 RER Individual Cross Section Graph (1992-2006) ………..…………... 145
Figure 4.8 RER Individual Cross Section Graph (1995-2009) ………..………. 146
Figure 4.9 GFER Combined Cross Section Graph (1992-2006) ………..…………... 148
Figure 4.10 GFER Combined Cross Section Graph (1995-2009) ………..…………... 148
Figure 4.11 GFER Individual Cross Section Graph (1992-2006) ………..…………... 149
Figure 4.12 GFER Individual Cross Section Graph (1995-2009) ………..………. . 150
Figure 4.13 GRVT Combined Cross Section Graph (1992-2006) ………..…………... 152
Figure 4.14 GRVT Combined Cross Section Graph (1995-2009) ………..……….. 152
Figure 4.15 GRVT Individual Cross Section Graph (1992-2006) ………..……….. 153
Figure 4.16 GRVT Individual Cross Section Graph (1995-2009) ………..…………... 154
Figure 4.18 GRRVT Combined Cross Section Graph (1995-2009) ………..…………... 156
Figure 4.19 GRRVT Individual Cross Section Graph (1992-2006) ………..…………... 157
Figure 4.20 GRRVT Individual Cross Section Graph (1995-2009) ………..…………... 158
Figure 4.21 GRYPC Combined Cross Section Graph (1992-2006) ………..…………... 160
Figure 4.22 GRYPC Combined Cross Section Graph (1995-2009) ………..…………... 160
Figure 4.23 GRYPC Individual Cross Section Graph (1992-2006) ………..…………... 161
Figure 4.24 GRYPC Individual Cross Section Graph (1995-2009) ………..…………... 162
LIST OF APPENDICES
Appendices The Hausman Test Result of CPI………..………... 195
Appendices The Hausman Test Result of RER ………..…………... 195
Appendices The Hausman Test Result of GFER ………..………... 196
Appendices The Hausman Test Result of GRVT ………..……….. 196
Appendices The Hausman Test Result of GRRVT ………..………... 197
Appendices The Hausman Test Result of GRYPC ………..…………... 197
Appendices Normality Test Result of CPI………... 198
Appendices Normality Test Result of RER ………..…………... 198
Appendices Normality Test Result of GFER ………..………... 199
Appendices Normality Test Result of GRVT ………..……… 199
Appendices Normality Test Result of GRRVT ………..………. 200
Appendices Normality Test Result of GRYPC ………..…………... 200
Appendices Durbin-Watson Final Result of CPI………..………... 201
Appendices Durbin-Watson Final Result of RER ………..…………... 202
Appendices Durbin-Watson Final Result of GFER ………..………... 203
Appendices Durbin-Watson Final Result of GRVT ………..……….. 204
Appendices Durbin-Watson Final Result of GRRVT ………..………... 205
Appendices Durbin-Watson Final Result of GRYPC ………..…………... 206
Appendices Heteroskedasticity Test of CPI………..………... 207
Appendices Heteroskedasticity Test of RER ………..…………... 208
Appendices Heteroskedasticity Test of GFER ………..………... 209
Appendices Heteroskedasticity Test of GRVT ………..………. 210
Appendices Heteroskedasticity Test of GRRVT ………..………... 211
Appendices Heteroskedasticity Test of GRYPC ………..…………... 212
Appendices Jointly Regression Coefficient Test (F-test) of CPI………..…... 213
Appendices Jointly Regression Coefficient Test (F-test) of RER ………..………... 214
Appendices Jointly Regression Coefficient Test (F-test) of GFER ……… 215
Appendices Jointly Regression Coefficient Test (F-test) of GRVT ……… 216
Appendices Jointly Regression Coefficient Test (F-test) of GRRVT ………. 217
Appendices Jointly Regression Coefficient Test (F-test) of GRYPC ………. 218
Appendices Individuality Coefficient Regression Test (t-Test) of CPI………... 219
Appendices Individuality Coefficient Regression Test (t-Test) of RER ………. 219
Appendices Individuality Coefficient Regression Test (t-Test) of GFER ……….. 220
Appendices Individuality Coefficient Regression Test (t-Test) of GRVT ……….. 220
Appendices Individuality Coefficient Regression Test (t-Test) of GRRVT ………... 221
Appendices R2 Determination Coefficient Test of CPI……… 222
Appendices R2 Determination Coefficient Test of RER ………. 223
Appendices R2 Determination Coefficient Test of GFER ………... 224
Appendices R2 Determination Coefficient Test of GRVT ……….. 225
Appendices R2 Determination Coefficient Test of GRRVT ………... 226
Appendices R2 Determination Coefficient Test of GRYPC ……… 227
Appendices The Final Result of CPI……… 228
Appendices The Final Result of RER ………. 230
Appendices The Final Result of GFER ………... 232
Appendices The Final Result of GRVT ……….. 234
Appendices The Final Result of GRRVT ……… 236
CHAPTER I
INTRODUCTION
1.1 Background of the study
Instability in International monetary arrangements has been a fact of life for policy makers since the breakdown of the Bretton Woods agreements in the early 1970s. The 1980s in particular were characterized by an exceptional misalignment of the major currencies. The decade saw massive capital flight towards the United States and other industrialized countries from the developing world, particularly after the debt crises and the cutting-off of new loans. Macroeconomic policies improved in the majority of developing countries in the 1990s, but the expected growth benefits failed to materialize, at least to the extent that many observers had forecast. In addition, a series of financial crises severely depressed growth and worsened poverty (World Bank, 2005, excerpt from Assessing Regional Integration in Africa (ARIA III), 2008). In the words of Mundell (excerpt from Assessing Regional Integration in Africa (ARIA III), 2008)
“The period since floating began has proved to be one of the most unstable periods in monetary history. For the developing countries, the last three decades have been characterized by high inflation, exchange rate instability and low growth. A substantial part of the blame for this situation must lie with the deterioration in the global international environment and especially the lapse in discipline due to the absence of an international monetary system.”
designated as “the Golden Age”. It was characterized by low unemployment, low inflation and rapid growth of living standards, and one of its cornerstones was the monetary arrangements outlined at the famous meeting in Bretton Woods in 1944, the penultimate year of the Second World War. In so far as it eliminated the spectrum of global economic insecurity that predominated in the 1930s, it was extremely successful. As table 1.1 illustrates, the mean average growth rate for both output and trade reached historically unprecedented levels, with more than three times higher than the pre-war level for output and fifteen times higher for trade. Pointedly, the coefficient of variation, which reflects the dispersion around the mean in the performance of these variables, also declined significantly during the Bretton Woods period. In the second half of the 1960s and through the 1970s, however, the whole structure of profitable growth threatened to fall apart (Glyn, 2006, excerpt from Assessing Regional Integration in Africa (ARIA III), 2008).
Table. 1.1
Growth and Volatility of World Output and Trade 1870-1990
Output Trade
Mean Average Coefficient of Mean Average Coefficient of
Growth Rate (%) Variation Growth Rate (%) Variation
Pre-War
1870-1913 2.8 0.75 3.6 0.71
Interwar
1924-1929 3.7 0.22 5.7 0.39
1929-1937 1.3 4.53 0.5 16.65
Post-war
1950-1973 4.7 0.34 7.5 0.56
1973-1990 3.1 0.53 4.5 1.09
Source: Kitson and Michie, 1995, (excerpt from Assessing Regional Integration in Africa (ARIA III), 2008)
goods and services than it is exporting. The size of the gap in dollar terms which is the amount often called “red ink”, is close to $600bn (£325.6bn) in 2004, this condition described that it is reached almost 6% of America’s overall economic activity. In some ways, America’s deficit has served the global economy well. By acting as a consumer of goods produced in Europe and Asia, the US has fulfilled its traditional function as an engine of growth. The countries with a current account surplus, particularly those in Asia, in turn send the proceeds back to the US as investments, mostly in US treasury bonds. These investments help to keep US interest rates low, which in turn sustains American consumption. The imbalance goes hand in hand with huge indebtedness. At the end of year in 2003 there is America’s net financial deficit happened that amounted to nearly 30% of the country’s total output (Tran, 2004).
Singapore was the first East Asian country to fall into recession from the current global economic crisis in July 2008. It was projected that the Singapore economy worked grow by -1.0 to 2 percent in 2009. As compared to Singapore, the Hong Kong economy contracted later and only declined into a recession in the middle of November. Hong Kong is projected to grow by 2 percent in 2009 from 5.6 percent in 2007 (Regional Economic Outlook, 2008; excerpt from Thangavelu, 2008). This clearly reflects the greater vulnerability of the Singaporean economy to external conditions and global economic shocks. The economic condition in Singapore is further accentuated by the huge loss in wealth (large negative wealth effect) from the rapidly declining a Singaporean stock market from the global financial crisis, whereas the Singapore Stock Index was above 3500 points in December 2007 and as of November 2008 it was hovering at around 1700 points (Thangavelu, 2008).
nearly 29 percent and it increased to 39 percent in 2005. As countries are contemplating greater regulation to protect their market from financial crisis, it is imperative that ASEAN emphasize greater regional trade and integration in terms of removing trade restrictions and behind border barriers to trade. In particular, there could be a greater harmonization of technical standard and regulations within ASEAN, which allows for a greater vertical and horizontal integration of firms in the global production network (Thangavelu, 2008).
Table. 1.2
Average Annual Net FDI Flows 1980-2007
Country Average Annual Net FDI Flows (US$, Millions)
1980-1989 1990-1995 1996-2001 2001-2007
Brunei 1 103 625 942
Indonesia 326 2,164 251 3,633
Malaysia 965 4,655 4,095 4.786
Philippines 318 1,028 1,367 1,737
Singapore 1,907 6,24 13,239 16.917
Thailand 515 2,004 4,702 6,844
Vietnam 6 947 1,694 2,563
Source: UNCTAD World Investment Report, 2008 (excerpt from Chaudhury, 2009)
extra-ASEAN flows of foreign direct investment (FDI) to finance the current account deficits run-up through purchases of capital goods and technology needed to improve factor productivity (see Table 1.2). Apart from Singapore, the ASEAN-5 either pegged their currencies to the U.S. Dollar or maintained a managed float regime in order to create an environment conducive to investment and maintain export price competitiveness. During the boom years, the depreciating effect of consistent current account deficits on the exchange rate was offset by both FDI and portfolio investment flows as well as active intervention in the foreign exchange markets by central banks. The power of monetary authorities to maintain exchange rates within an acceptable band depended primarily on the volume of foreign exchange reserves they were willing to sacrifice in currency markets. As would later be seen however, it also depended on the credibility of the authorities committing to the exchange rate policy, as perceived by global capital markets (Chaudhury, 2009).
ASEAN could also provide development and social support for the less vulnerable countries to maintain the pace of economic development within the region (Thangavelu, 2008).
Table. 1.3
ASEAN Intra and Extra Trade 2006
Country
Exports Imports
Intra-ASEAN Extra-ASEAN Intra-ASEAN Extra-ASEAN
Value
Country Country Country Country
Total
Source: ASEAN Secretariat, 2006 (excerpt from Thangavelu, 2008)
the ASEAN as a single market will provide a larger base to smooth out global shocks and increase the ability of the region to ride external shock more effectively. In this respect, the region should increase its intra-regional trade in ASEAN and Asia (Thangavelu, 2008).
The history of the yen/dollar rate over the few decades confirms the instability of major exchange rates. In the summer of 1985 the dollar was 250 yen and on the eve of the plaza Accord in September 1985, the rate was decreased to 239 and further fallen unprecedented in 1995 to 78 yen. The dollar appreciated from 78 yen in April 1995 to 148 yen in June 1998 in a period of East Asian financial crisis. The low yen shut off Japanese foreign direct investment in East Asia and close down its engine of growth (Mundell, 2003, excerpt from Choo and Choong, 2009). At the same time the rising dollar appreciated the currencies of ASEAN economies, especially Thailand, Malaysia, and Indonesia to overvalued positions that led them under the pressure of speculation. Indeed, there is strong evidence from the existing studies to support the idea that the instability of the dollar-yen exchange rates was a main factor in contributing to occurrence of the crisis (Choo and Choong, 2009).
economic integration, Japanese finance minister Miyazawa has made a proposal that is called “New Miyazawa Initiative” in October 1998, which aimed to set up a financial assistance scheme totaling 30 billion US dollars. This Initiatives, however, has met with strong criticism because the proposal is too Japan-centered, and the attitude of Japan in regional initiatives is rather ambiguous (Moon, 2000, excerpt from Choo and Choong, 2009). Although this proposals were rejected, there were few more successful initiatives had been proposed towards a closer monetary cooperation in Asian. For example, a conference was held in Manila in November 1997, which consisted of deputy finance ministers and central bank governors from 14 mostly Asian countries. The outcome of the conference was the establishment of Manila Framework Group (MFG), a new framework to enhance Asian Regional cooperation and to promote financial stability in the region. In addition, the ASEAN finance ministers agreed to establish the ASEAN Surveillance Process (ASP) in October 1998 to encourage policy dialogue based on the peer review and mutual interest among ASEAN member countries. In November 1999, China, Japan, and South Korea had been invited to join ASP, which making “ASEAN+3” reality in financial surveillance (Choo and Choong, 2009).
Asian countries, and strengthening an intra-ASEAN swap agreement. In May 2002, bilateral swap agreements between Japan, Korea, Thailand, Malaysia, Philippines, and China were initiated. Also the ASEAN swap agreement was extended to cover all the 10 member countries. The CMI represents the first milestone towards constructing a coordinated intervention policy and currency arrangement regionally. Nevertheless, this step is more likely to be more a case of “pooling reserve” in dealing with external instability or crises than a commitment to bilateral intervention to stabilize regional bilateral exchange rates. Obviously, financial cooperation has seen some positive progress among East Asia countries; however, incentives for monetary cooperation are still lack (Choo and Choong, 2009).
success of the EMU has provided a useful and convincing framework in investigating the possibility of forming a single currency area or monetary union in East Asian region generally and ASEAN economic particularly. The formation of single currency area or currency union in East Asia covers many advantages. Firstly, the existence of a common currency area is thought to be one of the main resolutions to minimize the exchange rate fluctuation that has significant impact on both macroeconomic stability and balance of payment position. Secondly, the major advantage of the union is that it facilities and promotes a greater trade and investment among the members of the union and therefore, stimulates economic growth by reducing transaction costs in cross-border activities and minimizing exchange rates volatility across the union. Finally, the union aims to strengthen economic and financial surveillance and exchange of information by hoping that the bilateral swap-arrangements and regional surveillance could beneficial crisis countries in East Asia (Choo and Choong, 2009).
2005). Although European Monetary Union has 12 members, the total area of these countries is only 40% of total area of China, and most of which locate in the central Europe Continent and share a similar culture and economic development. But East Asia is more characterized by diversity in terms of size, levels of economic development and political and social system. Table 1.4 shows the divergence of country size and population among China, Japan, and Korea.
Table. 1.4
ASEAN Key Trade by Region (Value in US$ million; share in percent)
2006
Partner Value Share to total ASEAN trade
Country/region Exports Imports Total Trade Exports Imports Total Trade
ASEAN 189,176.8 163,594.5 352,771.4 25.2 25.0 25.1
JAPAN 81,284.9 80,495.6 161,780.5 10.8 12.3 11.5
USA 96,943.5 64,252.5 161,196.0 12.9 9.8 11.5
EUROPEAN UNION 94,471.8 66,118.1 160,589.9 12.6 10.1 11.4
CHINA 65,010.3 74,950.9 139,961.2 8.7 11.5 10.0
KOREA 25,670.0 26,849.7 52,519.6 3.4 4.1 3.7
AUSTRALIA 23,148.5 13,262.8 36,411.4 3.1 2.0 2.6
INDIA 18,928.1 9,774.6 28,702.7 2.5 1.5 2.0
CANADA 3,916.4 2,970.3 6,886.8 0.5 0.5 0.5
RUSSIA 1,583.0 2,841.1 4,424.1 0.2 0.4 0.3
NEW ZEALAND 3,018.6 1,531.2 4,549.8 0.4 0.2 0.3
PAKISTAN 2,986.2 296.1 3,282.4 0.4 - 0.2
Total Selected Partner
606,138.2 506,937.5 1,113,075.7 80.7 77.5 79.2
countries/regions
Others 144,569.6 147,160.4 291,730.0 19.3 22.5 20.8
Total Selected Partner 750,707.8 654,097.8 1,404,805.7 100.0 100.0 100.0
Table. 1.5 Basic Characters of China, Japan and Korea
2005
Country Area Population Population Density
Human Development
Index (sq. km) (million people) (people per sq. km.) (%)
China 9,598,050 1,297 135 0.525
Japan 377,800 127 336 0.943
Korea 99,260 48 484 0.707
Source: World Bank, World Develop Indicator and HDI, 2005 (excerpt from Jikang and Yin, 2005)
Table. 1.6 Basic Characters of Germany, France and Italy
2005
Country
Area Population Population Density
Human Development
Index (sq. km) (million people) (people per sq. km.) (%)
Germany 357,030 82 230 0.93
France 551,500 59 107 0.93
Italy 301,340 58 191 0.92
Source: World Bank, World Develop Indicator and HDI, 2005 (excerpt from Jikang and Yin, 2005)
which gives the relevant information of Germany, France, and Italy, we can see that every indicator appears more harmony among EMU (European Monetary Union) members (Jikang and Yin, 2005).
Figure. 1.1 GDP
China, Japan, and Korea 1979-2004(Constant 2000)
(Million US$)
Source: World Bank, World Develop Indicator 2005(excerpt from Jikang and Yin, 2005)
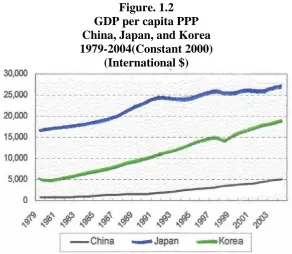
Figure. 1.2
GDP per capita PPP China, Japan, and Korea 1979-2004(Constant 2000)
(International $)
China experienced a vigorous growth since the economic reform in 1978. After more than two decades of expansion, China’s gross domestic product (GDP) totaled 1,506 billion USD in 2004, which is nearly 10 times as much as that in 1979. In spite of enjoying the highest economic growth, China’s GDP and GDP per capita is still far less than Japan and Korea. Figure 1.1 and 1.2 shows the huge differentials in GDP size among China, Japan and Korea. In 2004, China’s GDP is 30% of the GDP of Japan, and 2 times that of Korea. But when it comes to GDP per capita, China had the bad performance among the three, which accounts for 18% of GDP per capita of Japan and 27% of Korea (Jikang and Yin, 2005).
Figure. 1.3 GDP
Germany, France, and Italy 1972-2000(Constant 2000)
(Million US$)
Figure. 1.4 GDP per capita PPP Germany, France, and Italy
1975-2000(Constant 2000) (International $)
Source: World Bank, World Develop Indicator 2005 (excerpt from Jikang and Yin, 2005)
Figure. 1.5 China, Japan, and Korea GDP Growth (annual %), 1979-2004
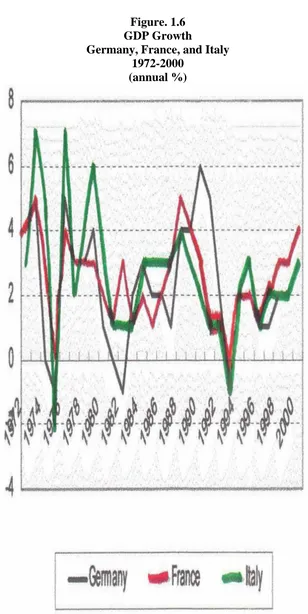
Figure. 1.6 GDP Growth
Germany, France, and Italy 1972-2000
(annual %)
Table. 1.7
GDP Growth Correlation China, Japan, and Korea
1979-2004
Country China Japan Korea
China 1 - -
Japan -0.12 1 -
Korea 0.18 0.41 1
Source: World Bank, World Develop Indicator 2005 (excerpt from Jikang and Yin, 2005)
Table. 1.8
GDP Growth Correlation Germany, France and Italy
1972-2000
Country Germany France Italy
Germany 1 - -
France 0.59 1 -
Italy 0.58 0.76 1
Source: World Bank, World Develop Indicator 2005 (excerpt from Jikang and Yin, 2005)
Figure 1.5), we have to agree to the less similarity of GDP growth among East Asia countries (Jikang and Lin, 2005). Table 1.7 and Table 1.8 contain the Pearson correlation of two groups, which give a quantitative description of different extent of GDP growth coherence. The correlation between China and Korea is only 0.18 while between China and Japan is negative. The correlation of economic growth between Japan and Korea is relatively high, but still much lower than those between Germany, France, and Italy. Labor mobility helps members of a monetary union to adjust to asymmetric shocks by allowing labor mobility varies across countries. Although the level of labor mobility is rather low in East Asia relatively to that of Europe, it had been rapidly increasing since 1990s. In 1991 there were 1.2 million foreign residents in Japan, which was less than 1% of Japan's population. Of this number, 693,100 (about 57%) were Koreans and 171,100 (some 14%) were Chinese According to data from Ministry of Justice of Japan (excerpt from Jikang and Lin, 2005), registered Chinese increased from 150,000 in 1990 to 462,000 in 2003, and registered Korean increased more than 60,000. In 2003, around 8,300 Koreans went abroad to permanently settle in a foreign country. According to government surveys of emigrants, China is the second popular destination (16.8%) and Japan the third (12.6%). Of course, currently, the degree of labor mobility is still rather low comparing to that of EMU members before their forming European Monetary Union (Jikang and Lin, 2005).
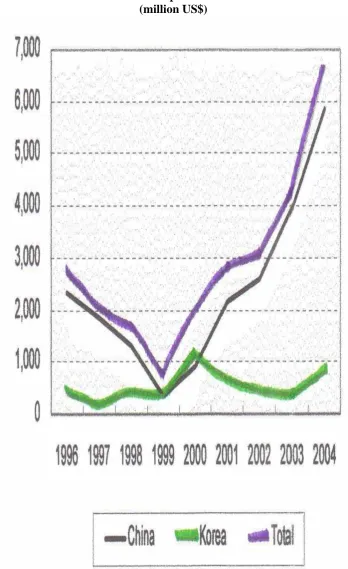
Figure. 1.7 FDI Outflow
Japan (million US$)
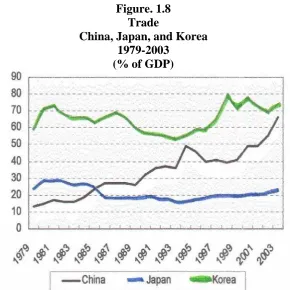
Figure. 1.8 Trade
China, Japan, and Korea 1979-2003
(% of GDP)
Source: World Bank, World Develop Indicator 2005 (excerpt from Jikang and Yin, 2005)
Figure. 1.9 Trade
Germany, France, and Italy 1772-2000
(% of GDP)
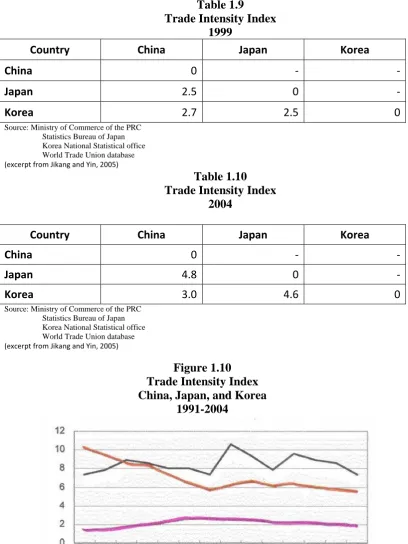
Table 1.9 Trade Intensity Index
1999
Country China Japan Korea
China 0 - -
Japan 2.5 0 -
Korea 2.7 2.5 0
Source: Ministry of Commerce of the PRC Statistics Bureau of Japan Korea National Statistical office World Trade Union database (excerpt from Jikang and Yin, 2005)
Table 1.10 Trade Intensity Index
2004
Country China Japan Korea
China 0 - -
Japan 4.8 0 -
Korea 3.0 4.6 0
Source: Ministry of Commerce of the PRC Statistics Bureau of Japan Korea National Statistical office World Trade Union database (excerpt from Jikang and Yin, 2005)
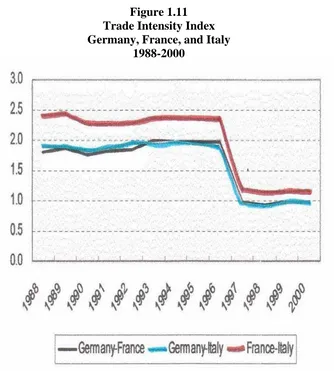
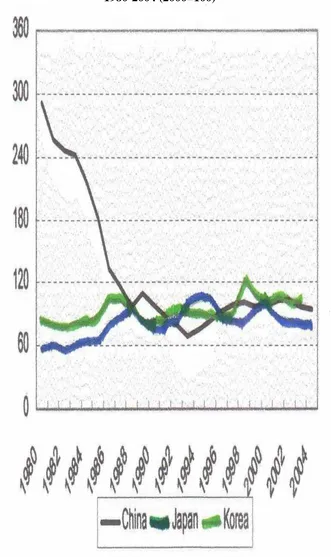
Figure 1.10 Trade Intensity Index China, Japan, and Korea
1991-2004
Figure 1.11 Trade Intensity Index Germany, France, and Italy
1988-2000
Source: Direction of Trade Yearbook, IMF (excerpt from Jikang and Yin, 2005)
Figure 1.12
Bilateral Trade Share of Total Trade 1995-2004
Source:
Ministry of Commerce of the PRC Statistics Bureau of Japan
Source: Korea National Statistical Office Ministry of Commerce of the PRC Statistics Bureau of Japan (excerpt from Jikang and Yin, 2005)
Figure 1.13 Structure of Output
Source: World Bank, World Development and Policy (excerpt from Jikang and Yin, 2005)
Figure 1.14 Structure of Output
2000 (% of GDP)
Source: World Bank, World Develop Indicator 2005 (excerpt from Jikang and Yin, 2005)
Figure 1.15
Money and Quasi Money (M2) China, Japan, and Korea
1979-2004 (% of GDP)
Source: World Bank, World Develop Indicator 2005 (excerpt from Jikang and Yin, 2005)
Table 1.11
Exchange Rate Arrangements and Anchors of Monetary Policy
Country Exchange Rate Regime Monetary Policy Framework
China
De facto peg arrangement under a formally announced policy of
managed of independent floating(against dollar)
Exchange rate anchor, Monetary aggregate target
Japan Independently floating
Has no explicitly stated nominal anchor, but rather monitors various indicators in
conducting monetary policy
Korea Independently floating Other (not specific)
Source: IMF, International Financial Statistics (excerpt from Jikang and Yin, 2005)
similar to the level of the EMU group, which is positive evidence for suitability of forming monetary cooperation (Jikang and Yin, 2005).
Figure 1.16
Inflation (GDP Deflator) China, Japan, and Korea
1979-2004
Source: World Bank, World Develop Indicator 2005 (excerpt from Jikang and Yin, 2005)
Figure 1.17
Inflation (GDP Deflator) Germany, France, and Italy
Table 1.12
Inflation (GDP Deflator) Correlation China, Japan, and Korea
1979-2004
Country China Japan Korea
China 1 - -
Japan 0.69 1 -
Korea 0.998 0.70 1
Source: World Bank, World Develop Indicator 2005 (excerpt from Jikang and Yin, 2005)
Table 1.13
Inflation (GDP Deflator) Correlation Germany, France, and Italy
1972-2000
Country Germany France Italy
Germany 1 - -
France 0.71 1 -
Italy 0.67 0.95 1
Source: World Bank, World Develop Indicator 2005 (excerpt from Jikang and Yin, 2005)
Figure 1.18
Money and Quasi Money Growth China, Japan and Korea
1979-2003
Figure 1.19
Money and Quasi Money China, Japan, and Korea
1979-2003 (% of GDP)
Source: World Bank, World Develop Indicator 2005 (excerpt from Jikang and Yin, 2005)
Figure 1.20
NER (Nominal Exchange Rate) China, Japan, and Korea
1979-2003
Figure 1.21
REER (Real Effective Exchange Rate) China, Japan, and Korea
1980-2004 (2000=100)
Table 1.14
REER (Real Effective Exchange Rate) Correlation China, Japan, and Korea
1979-2004
Country China Japan Korea
China 1 - -
Japan -0.87 1 -
Korea -0.47 0.45 1
Source: World Bank, World Develop Indicator 2005 (excerpt from Jikang and Yin, 2005)
Table 1.15
Descriptive of REER (Real Effective Exchange Rate) China, Japan and Korea
1979-2004 (2000=100)
Country Mean Std. Deviation
China 130.92 65.06
Japan 80.73 14.29
Korea 92.45 11.00
Source: World Bank, World Develop Indicator 2005 (excerpt from Jikang and Yin, 2005)
Table 1.16
REER (Real Effective Exchange Rate) Correlation Germany, France and Italy
1975-2000
Country Germany France Italy
Germany 1 - -
France 0.64 1 -
Italy 0.35 0.1 1
Table 1.17
Descriptive of REER (Real Effective Exchange Rate) Germany, France, and Italy
1975-2000 (2000=100)
Country Mean Std. Deviation
Germany 115.42 8.24
France 109.92 6.81
Italy 105.65 8.71
Source: World Bank, World Develop Indicator 2005 (excerpt from Jikang and Yin, 2005)
EMU members, but surely, the correlation between Germany and France, 0.64 is 40% higher than that of Japan and Korea. Table 1.17 shows the descriptions of REER historical data, where the volatilities of these currencies are greatly lower and closer to each other than those of the East Asia group (Jikang and Yin, 2005).
Table 1.18
Correlation of Real Supply Shock China, Japan, and Korea
1980-2000
Country China Japan Korea
China 1 - -
Japan 0.09 1 -
Korea 0.12 0.42 1
Source: Ding and Li, 2005 (excerpt from Jikang and Yin, 2005)
Table 1.19
Correlation of Real Supply Shock Germany, France and Italy
1980-2000
Country Germany France Italy
Germany 1 - -
France 0.31 1 -
Italy 0.62 0.5 1
Source: Ding and Li, 2005 (excerpt from Jikang and Yin, 2005)
Table 1.20
Correlation of Real Demand Shock China, Japan, and Korea
1980-2000
Country China Japan Korea
China 1 - -
Korea 0.60 0.41 1
Source: Ding and Li, 2005 (excerpt from Jikang and Yin, 2005)
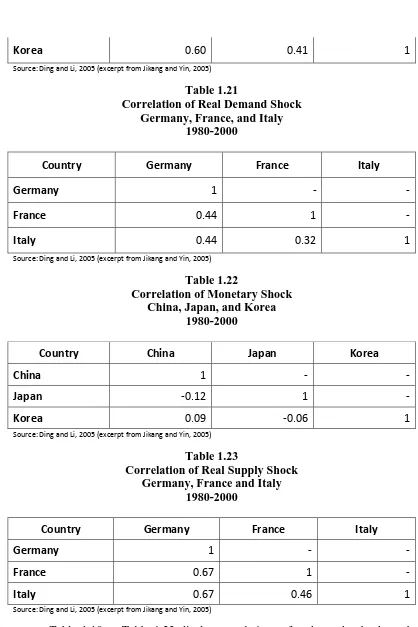
Table 1.21
Correlation of Real Demand Shock Germany, France, and Italy
1980-2000
Country Germany France Italy
Germany 1 - -
France 0.44 1 -
Italy 0.44 0.32 1
Source: Ding and Li, 2005 (excerpt from Jikang and Yin, 2005)
Table 1.22
Correlation of Monetary Shock China, Japan, and Korea
1980-2000
Country China Japan Korea
China 1 - -
Japan -0.12 1 -
Korea 0.09 -0.06 1
Source: Ding and Li, 2005 (excerpt from Jikang and Yin, 2005)
Table 1.23
Correlation of Real Supply Shock Germany, France and Italy
1980-2000
Country Germany France Italy
Germany 1 - -
France 0.67 1 -
Italy 0.67 0.46 1
Source: Ding and Li, 2005 (excerpt from Jikang and Yin, 2005)
group. Real supply shock correlation and real demand shock correlation between Japan and Korea is close to those among EMU members, however the correlation between China and Japan and China and Korea show less symmetry. As far as monetary shock correlation is concerned, we find China, Japan and Korea still have a long process to go in order to reach the precondition of OCA criteria. Monetary shock correlation between China and Japan and Japan and Korea is negative; the correlation between China and Korea is less than 0.1 whereas the correlations among EMU members are 0.67 and 0.67 and also 0.46 during 1980-2000 (Jikang and Yin, 2005).
three East Asia country is extremely low. Therefore Jikang and Yin (2005) believe China, Japan and Korea are less ready for a monetary cooperation than Europe was in terms of economic conditions.
factors behind this trade bias effect. This bias effect in trade may be of particular importance in explaining the increasing intensity of trade between Indonesia and
Table 1.24
Trade Indices for ASEAN countries 1996-2001
Country Year
Indonesia Malaysia Philippines Singapore Thailand B C I B C I B C I B C I B C I
Source: STARS, International Economic Data Bank (excerpt from Ramayandi, 2005) Note:
C = Complementary Index B = Trade Bias Index
its neighboring trade partners. In summary, in addition to any economic causes, the increasing trade intensity in ASEAN also seems to be supported by some institutionalized agenda to move towards a more integrated region. Therefore, if the picture from the recent development in the trade patterns in ASEAN continues, then the region may be able to capture the extra benefit of reduction in transaction costs and improvement in price transparency by forming a currency union (Ramayandi, 2005).
An examination of the correlation coefficients for the aggregate supply shocks in ASEAN during 1960–1996 (just a year before the crisis started) suggests that the aggregate supply shocks across the five ASEAN nations are mostly not significantly correlated. Significant correlation is found for the cases of
Table 1.25
Correlation of Aggregate Supply Shocks across the ASEAN Nations
Indonesia Malaysia Singapore Thailand Philippines Aggregate Supply Shocks (1960-1996)
Indonesia 1.00 0 0 0 0
Malaysia 0.38* 1.00 0 0 0
Singapore 0.16 0.36* 1.00 0 0
Thailand 0.25 0.28 0.38* 1.00 0
Philippines -0.08 -0.02 -0.05 0.08 1.00
Aggregate Supply Shocks (1960-2002)
Indonesia 1.00 0 0 0 0
Malaysia 0.78* 1.00 0 0 0
Singapore 0.40* 0.56* 1.00 0 0
Thailand 0.46* 0.63* 0.45* 1.00 0
Philippines 0.20 0.25 0.17 0.32* 1.00
Indonesia and Malaysia, Malaysia and Singapore, and Singapore and Thailand (see Table 1.25). The correlation between Malaysia and Thailand appears to be marginally significant. Although there are some significant correlations, the magnitude of the correlation coefficients itself are not particularly high. Those magnitudes are relatively low compared to the one for Western Europe for the period of 1969–1989. Regardless of the explanation behind such changes, the figures from Table 2 suggest that the region is now moving towards having more synchronized aggregate supply shock elements. As suggested by the theory of OCA, similarities in supply shocks plays a more important role in analyzing the economic disturbances. This then suggests that, based on this particular criterion, the five ASEAN economies (with some qualifications in the case of the Philippines) are now in a position to consider the possibility of introducing a more integrated monetary system (Ramayandi, 2005).
that after expanding the series of observations, the magnitude of the Philippines aggregate demand correlation with the rest of the group tends to become lower. A possible explanation is that the impact of the 1997–98 crises on the Philippines is somewhat different from the other countries considered. The demand shocks essentially capture both the components of macro-policy shocks and the public preference shocks in private demand behavior. Relatively high and significantly positive correlation in the aggregate demand for the five economies, then suggests that the demand side behavior of those economies not only tends to be highly correlated but also evolved similarly over the observed period. In other words, the overall preferences on the demand side of those economies have already been closely and positively correlated during the period under consideration (Ramayandi, 2005).
Table 1.26
Correlation of Aggregate Demand Shocks across the ASEAN Nations
Indonesia Malaysia Singapore Thailand Philippines Aggregate Demand Shocks (1960-1996)
Indonesia 1.00 0 0 0 0
Malaysia 0.79 1.00 0 0 0
Singapore 0.60 0.59 1.00 0 0
Thailand 0.40 0.49 0.63 1.00 0
Philippines 0.42 0.47 0.44 0.17 1.00
Aggregate Demand Shocks (1960-2002)
Indonesia 1.00 0 0 0 0
Malaysia 0.71 1.00 0 0 0
Singapore 0.59 0.52 1.00 0 0
Thailand 0.56 0.56 0.67 1.00 0
Philippines 0.28 0.32 0.45 0.16 1.00
Table 1.27
Correlation of Exchange Rates per US dollar for Five ASEAN Nations
Indonesia Malaysia Singapore Thailand Philippines
Indonesia 1.00 0 0 0 0
Malaysia 0.91 1.00 0 0 0
Singapore 0.91 0.92 1.00 0 0
Thailand 0.88 0.93 0.93 1.00 0
Philippines 0.83 0.81 0.93 0.89 1.00
Source: Pacific Economic Papers, 2005 (excerpt from Ramayandi, 2005) *: Significance at 5% level
Table 1.27 highlights a very high, positive and statistically significant correlation between each country exchange rate with respect to the US dollar. Indeed, the crisis period is the main contributor for such a high correlation.
Table 1.28
Correlation of Exchange Rates to US dollar for Five ASEAN Nations
Indonesia Malaysia Singapore Thailand Philippines
Indonesia 1.00 0 0 0 0
Malaysia n.a 1.00 0 0 0
Singapore 0.76 n.a 1.00 0 0
Thailand 0.81 n.a 0.77 1.00 0
Philippines 0.33 n.a 0.45 0.61 1.00
Source: Pacific Economic Papers, 2005 (excerpt from Ramayandi, 2005) *: Significance at 5% level
However, as mentioned in the previous section, the five countries are facing disparities in the level of economic development. This issue may act as a natural stumbling block for any monetary integration process. Together with the relatively weak performance in meeting the political preconditions for forming an OCA, relative economic divergence can become the main potential impediment in realizing an ACU or any other kind of monetary arrangement in ASEAN. With such differences in the level of economic development, the participating countries may always be tempted to deviate from the aim of the agreed arrangement. This potential problem will be a lot more serious in the absence of strong political commitment in the background. Increasing interest in closer monetary cooperation in ASEAN is mainly driven by the common perception of a need to stabilize the exchange rates within the region. The issue starts to emerge right after the enormous currency crisis in 1997 and has been present as a topic of lively discourse since then. On the practical side, however, the discourse is not yet making an impressive progress. Apart from the potential impediment in the form of relative economic divergence, this situation also resulted from the relatively low level of political drive to move forward in each of the member country (Ramayandi, 2005).
monetary policy, or even from a common currency. Similarities in the recent pattern of demand shock components and exchange rate variations among them also suggest that the harmonization process in terms of macroeconomic policies may not be as hard as previously thought.
The correlation matrix of Table 1.29 that shown below does however provide some evidence to suggest that a future ASEAN OCA might work best if it starts by including only the countries with at least a rough measure of business cycle synchronization. Given the significant values, such a bloc might initially be composed of Singapore, Indonesia, Malaysia, and Thailand (Chaudhury, 2009).
The evidence for ASEAN-7 suggests a fair degree of convergence with regards to inflationary movements, as shown in Table 1.30 below (Chaudhury, 2009).
Table 1.29
Real GDP Growth Correlation in ASEAN-7 1980-2007
Brunei Indonesia Malaysia Philippines Singapore Thailand Vietnam
Brunei 1 0 0 0 0 0 0
Indonesia -0.0622 1 0 0 0 0 0
Malaysia 0.1188 0.8162*** 1 0 0 0 0
Philippines 0.1219 0.2039 0.3687* 1 0 0 0
Singapore -0.0308 0.5802*** 0.8423*** 0.4525** 1 0 0
Thailand 0.0108 0.8096*** 0.7432*** 0.2267 0.5892*** 1 0
Vietnam 0.2346 0.1776 0.3324 0.0599 0.1665 -0.1068 1
Source: The Michigan Journal of Business, 2007 (excerpt from Chaudhury, 2009) * : Significance at 10% level
Table 1.30
Inflation Correlation Matrix 1980-2007
Brunei Indonesia Malaysia Philippines Singapore Thailand Vietnam
Brunei 1 0 0 0 0 0 0
Indonesia -0.3007 1 0 0 0 0 0
Malaysia 0.1955 0.3378* 1 0 0 0 0
Philippines 0.3374* 0.0354 0.3371* 1 0 0 0
Singapore 0.4558** -0.0789 0.7607*** 0.3577* 1 0 0
Thailand 0.2602 0.2882 0.7314*** 0.165 0.8041*** 1 0
Vietnam 0.0601 -0.1628 -0.3549* -0.0672 -0.1944 -0.1219 1
Source: The Michigan Journal of Business, 2007 (excerpt from Chaudhury, 2009) * : Significance at 10% level
Table 1.31
Total Labor Productivity, Average Annual Growth Rate (%)
1991-1995 1995-2000 2000-2005
Brunei 0 0 0
Indonesia 6.3 -1.6 3.5
Malaysia 6.6 0.8 2.8
Philippines 0 2.3 0.9
Singapore 6.4 2 2.3
Thailand 7.4 0.2 3
Vietnam 6.3 4.2 4.8
Source: UNESCAP Statistic Division (excerpt from Chaudhury, 2009)
While it is not entirely realistic to think that an ASEAN monetary union is likely to be implemented anytime soon, it is well worth considering the region’s suitability for greater policy coordination in the wake of the AFC and the onset of the global economic crises. The analysis conducted in this paper considers only one of a variety of macroeconomic issues relevant to a comprehensive discussion of a common currency. It finds that OCA (Optimum Currency Area) eligibility within ASEAN-7 is the highest it has been in its history, but because there is no single framework by which to evaluate the costs and benefits of a monetary union, it is still too soon to reach a definitive conclusion regarding its suitability. The uncertain economic times ahead however merit discussion on how further integration could help the organization maintain economic stability while raising its regional competitive profile. The study finds that while significant reforms can be made in the absence of such a union, there are likely to be considerable benefits that apply only after full integration takes place.
The adoption of a common currency by ASEAN is formidable, the long-run goal of a common currency for the region may be worth considering seriously, especially because, judged by the criterion of optimum currency area, the region is as suitable for the adoption of a common currency as Europe was prior to the Maastricht Treaty (Madhur, 2002).
union seen as the ‘crowning’ of a convergence process. The Maastricht Treaty organized this step-by-step process by imposing the famous ‘convergence criteria’ that were supposed to prepare future member countries for the uniform, ‘one-size-fits-all’ monetary policy of the European Central Bank (Cacheux, 2009).
income could lead to instability in both politics and economics. In the past, authors have conducted studies on the feasibility of a single currency for ASEAN by examining different criteria. Bayoumi and Eichengreen, 1994 (excerpt from Krawinee, 2003), Goto and Hamada, 1994 (excerpt from Krawinee, 2003), and Ngiam and Yuen, 2001 (excerpt from Krawinee, 2003), for example, looked at the symmetric and asymmetric shocks (Krawinee, 2003). The study by Ngiam and Yuen, 2001 (excerpt from Krawinee, 2003) also looked in depth at the issue in terms of labor mobility, exchange rate policy, and political will in East Asia. Yuen, 2001 (excerpt from Krawinee, 2003) used a structural vector auto regression analysis to look at the symmetric shocks. However, not many studies have used economic convergence modeling techniques to examine the prospects of having a common currency area in ASEAN (Krawinee, 2003). In addition, as is well-known, the ‘convergence criteria’ that were eventually included in the Maastricht Treaty were uniform, and were all about nominal convergence, in a very specific sense: exchange-rate stability, inflation-rate convergence toward the lowest ones, long-term, nominal interest-rate convergence also toward the lowest ones, and the famous public finance criteria (Cacheux, 2009).
total number of people in the country at the total money, time and resources of a firm engaged in the business of financing accounts receivable which is the activity known as factoring with a purchase or activity that adjusted for inflation. The results of all economic indicators above can be used to examine the region’s suitability for forming a single currency area (Rasheed and Ahmed, 2007).