www.elsevier.com/locate/econedurev
Education and employment status: a test of the strong
screening hypothesis in Italy
Sarah Brown
a,*, John G. Sessions
baDepartment of Economics, Loughborough University, Loughborough, Leicestershire LE11 3TU, UK bDepartment of Economics and Finance, Brunel University, Uxbridge, Middlesex UB8 3PH, UK
Received 1 September 1997; accepted 31 July 1998
Abstract
We apply the comparative techniques originated by Wolpin, K.I. (1977, Education and screening, American Economic
Review, 67, 949–958) and Psacharopoulos (1979, On the weak versus the strong version of the screening hypothesis, Economics Letters, 4, 181–185) to discriminate between the ‘weak’ and ‘strong’ screening hypotheses. Controlling for
sample selection, we find evidence for weak but not strong screening in the Italian labour market. [JEL J3, J24, J41] 1999 Elsevier Science Ltd. All rights reserved.
Keywords: Education; Screening; Self-employment
1. Introduction
The relationship between schooling and productivity has long intrigued economists and in recent years two contrasting views have emerged. Human capital theory holds that schooling directly augments individual pro-ductivity (Mincer, 1974; Becker, 1975). The screening hypothesis, in contrast, attests that schooling merely sig-nals inherent productivity. To be sure, the strong screen-ing hypothesis (SSH) presumes productivity to be immu-table with schooling being used exclusively as a signal (Psacharopoulos, 1979). The weak screening hypothesis (WSH), on the other hand, concedes that whilst the pri-mary role of schooling is to signal, it may also augment inherent productivity (Spence, 1973; Arrow, 1973; Stig-litz, 1975).
The observed correlation between education and earn-ings renders the debate over the true nature of schooling largely redundant at an individual level. Regardless of whether schooling signals or augments productivity, it certainly enhances lifetime earnings and as such
rep-* Corresponding author. Tel.: 1 44-1509-222701; fax:1
44-1509-223910; e-mail: [email protected]
0272-7757/99/$ - see front matter1999 Elsevier Science Ltd. All rights reserved. PII: S 0 2 7 2 - 7 7 5 7 ( 9 9 ) 0 0 0 0 2 - 3
resents a good investment for individual workers (Psacharopoulos, 1994). Whether or not schooling is a good investment for society is less clear.1If its only
pur-pose is to provide signals to prospective employers then questions arise as to the appropriateness of investing in the expansion and/or qualitative upgrading of schooling.2
Indeed, if evidence is found in support of the SSH then student-centred funding policies are perhaps justified because there is a divergence between the private and social marginal benefit of higher education. If, however, evidence is found in support of the WSH then the debate should centre upon which certificates are typically acquired as screens—and perhaps have little effect on productivity—and which augment productivity to a greater extent. Finally, if evidence is found to reject
1It could be argued that the debate is equally redundant at
the social level. The fact that firms still pay higher wages to more educated workers means that either education raises pro-ductivity or that it most efficiently signals desirable, but unob-servable, individual characteristics (Lang, 1994).
2In terms of the original Spenciarian analysis, there is no
398 S. Brown, J.G. Sessions / Economics of Education Review 18 (1999) 397–404
screening in favour of human capital theory then student-centred funding may be criticised since increased pro-ductivity via increased education represents both an indi-vidual and social benefit.
Both the SSH and WSH have been the subject of numerous empirical tests, predominately on data from the USA (see Weiss, 1995). One of the most popular approaches has been to use a particular subsample of the population as an unscreened control group and then to compare the rates of return to education across these and other screened subsamples. Psacharopoulos (1979), for example, compares returns across relatively competitive (e.g. private) and non-competitive (e.g. public) sectors, presuming that screening is more likely in non-competi-tive environments where bureaucratically set wage rates can deviate persistently from somewhat esoteric mar-ginal products. Advocates of the so-called ‘P(sacharopolous)-test’ include Lee (1980); Ziderman (1992); Lambropolous (1992); Arabsheibani and Rees (1997).
A similar approach has been to focus on self-employed workers as the unscreened control group (Wolpin, 1977). The presumption here is that since the self-employed have no need to signal inherent ability, any return they make to education must represent a true return to human capital investments. Such a method-ology has yielded some support for weak, but not strong, screening (Riley, 1979; Katz & Ziderman, 1980; Fred-land & Little, 1981; Shah, 1985; Tucker, 1986; Cohn, Kiker & Mendes De Oliveira, 1987; Grubb, 1993).3
A potential problem with both approaches is the implicit assumption that education is acquired solely with a view to future employment opportunities. But education may be acquired for non-investment purposes and employment ambitions are not always realised. Blanchflower and Oswald (1990), however, found that respondents who were self-employed at age 23 were twice as likely as employees to have predicted at age 11 their worker type 12 years hence and that such ‘childish predictions’ were not random. This is important since it is assumed in most screening models that individuals formulate their employment plans on the basis of an offered wage schedule set by potential employers. If the
3Other empirical methodologies include: (i) ‘Wiles tests’—
comparing the earnings of similarly educated workers employed in areas related and unrelated to their qualifications (Wiles, 1974; Miller & Volker, 1984; Arabsheibani, 1989); (ii) focusing on any divergence between actual and ‘efficient’ (i.e. the time nominally required to complete a course) years of schooling (Oosterbeek, 1992; Oosterbeek & Groot, 1994); (iii) focusing on the percentile ranking in the distribution of years of edu-cation (Sakamoto & Chen, 1992); (iv) focusing on information available to the firm at the time of the hiring process (Albrecht, 1981); and (vi) focusing on the return to tenure groupings (Tucker, 1986; Liu & Wong, 1982).
decision to be self-employed or employed in an unscreened sector is made prior to the acquisition of cer-tification then, under the screening hypothesis, we would expect such individuals to acquire less certification for signalling purposes relative to both potential employees and to those who have ambiguous aims.
More generally, there is evidence to suggest that the extent to which education is used as a screen depends critically on the nature of indigenous cultures and insti-tutions. For instance, evidence of screening has been found in Israel (Ziderman, 1992), Japan (Sakamoto & Chen, 1992), Singapore (Liu & Wong, 1982) and Aus-tralia (Miller & Volker, 1984), but not in Greece (Lambropolous, 1992), Malaysia (Lee, 1980), the Netherlands (Oosterbeek, 1992), Sweden (Albrecht, 1981) or Egypt (Arabsheibani, 1989). Mixed results have been found for the UK (Shah, 1985; Psacharopoulos, 1979) and the USA (Riley, 1979; Layard & Psacharo-poulos, 1974).
We contribute to this debate by focusing on the Italian labour market. Adopting both the Wolpin (1977) and Psacharopoulos (1979) methodologies on data derived from the 1989 Banca d’Italia Survey of Household Income and Wealth, and controlling for sample-selection bias, we find evidence in favour of weak but not strong screening.
The remainder of the paper is set out as follows. Sec-tion 2 presents some background pertaining to the Italian education system. Section 3 discusses the data and meth-odology. Section 4 presents the results and Section 5 offers some overall conclusions.
2. Background
The Italian labour market is a particularly interesting case to explore given its apparently endemic high rates of unemployment and low rates of educational attain-ment. To some extent, the latter factor reflects the severe under-funding of the education system, the relatively low minimum school leaving age of 14 and the subsequent small proportion of students continuing through to uni-versity-level education (European Commission, 1994). Indeed, relative to the rest of Europe, Italy has higher average government expenditure per primary-school pupil, but lower average government expenditure per student in higher education (Anon., 1995).
(intermediate certificate) the attainment of which permits access to higher secondary schools.
Higher secondary schools educate 14- to 19-year-olds and fall into one of five categories; grammar schools, art schools, teacher training schools, technical institutes and vocational institutes. Graduation from a higher secondary school allows an individual to apply to university or allows a graduate from a vocational institute access to an intermediate profession. Italian university courses normally last for at least 4 years and very few students receive a student grant from the state. Unlike the UK, Italy has no specific student loans system and enrolment fees have to be paid by the individual.
Although re-examinations are more common in Italy than in the UK (see Raban, 1991), figures for 1989 show that approximately 6 percent of Italians (aged 25 to 64) graduated from university, in comparison to 9 percent of the population in the UK. In comparison, the population proportions with only nursery, primary or lower second-ary education as their highest education level are 74 per-cent for Italy and 33 perper-cent for the UK (for more details see OECD, 1992, Table 1C).
3. Data and methodology
Our data are derived from the 1989 Banca d’Italia Sur-vey of Household Income and Wealth (SHIW). The questionnaire comprises six main sections which record household characteristics, details of income, savings, consumption, wealth and the banking behaviour of a national cross-section of Italian families.
From the 1989 survey a subset of data for male house-hold heads who were working full-time was con-structed—see Table 1 for details of the variables selec-ted. Due to problems encountered with missing data we were obliged to use family net disposable income as a proxy for individual income. We controlled for house-hold composition, however, by selecting only those respondents who reported that there were no other wage earners in their household.
The following Mincerian earnings equation was esti-mated for full-time workers:
ln W5a 1 b1c1b2x1b3x21b4d1e
where W5hourly earnings,4a 5average wage for
ref-erence respondent, c5educational certification dumm-ies, x5years of labour market experience (proxied by age), and d 5 vector of regional, marital status and industrial dummy variables. The certification dummies in vector c denote the respondent’s highest level of cation, namely: (i) low education—i.e. no formal
edu-4This is calculated from household net disposable income,
hours and months worked in 1989 (in 1000s Italian lire).
Table 1 Data definitions
Variable name Description ln earnings Log hourly earnings Age Respondent’s age in years
Respondent is married or living as Married
married
Single Respondent is single
Divorced/widowed Respondent is divorced or widowed Respondent has either no formal edu-Low education
cation or a primary school certificate Respondent’s highest educational cer-Intermediate education tificate is intermediate school
certifi-cate
Respondent’s highest educational cer-High education
tificate is high school diploma Respondent’s highest educational cer-Degree
tificate is university degree North West Respondent lives in the North West North East Respondent lives in the North East
Respondent lives in the Central Central
Region
South Respondent lives in the South Island Respondent lives in Sicily or Sardinia Notes: North West5Piemonte, Valle d’Aosta, Lombardia, Lig-uria, Toscana; North East5Trentino–Alto Adige, Friuli–Vene-zia Giulia, Emilia Romagna; Central5Umbria, Marche, Lazio, Abruzzi, Molise; South5Campania, Puglia, Basilicata, Calab-ria.
cation or primary education; (ii) intermediate (school) education; (iii) high (school) education; (iv) university education.
Our empirical estimation is rendered somewhat prob-lematic by the potential for sample selection bias. Our earnings data are derived from observing a particular employment contract and there may be variables that affect both the probability of observing such a contract and the return to any factor employed under such a con-tract. More energetic and/or ambitious individuals may, for example, be more (or less) likely to become self-employed and thus some allowance for incidental sample truncation is required. The problem is further compli-cated because there is strong evidence to suggest that the real dimension of employment choice in Italy is in fact trivariate: namely, private sector employment, public sector employment and self-employment (see Bardasi & Monfardini, 1997). To control for such a possibility we therefore adopted both the standard Heckman (1979) bivariate, and Lee (1983) multivariate, sample selec-tion approaches.5
400 S. Brown, J.G. Sessions / Economics of Education Review 18 (1999) 397–404
4. Results
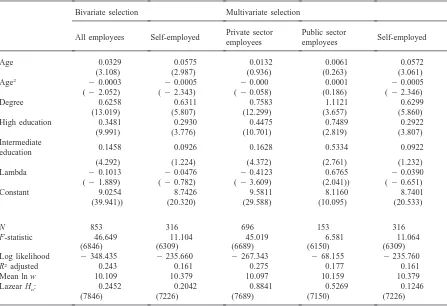
Table 2 presents sample statistics for the various sub-samples used in the study. It is apparent that the pro-portion of self-employed workers with ‘low’ education is significantly higher than that for either public or priv-ate sector employees. The proportion of employees with ‘middle’ or ‘high’ education, in contrast, is significantly higher than the proportion for the self-employed. These two observations accord with the screening hypothesis in that the self-employed are relatively less interested in acquiring education than employees. Note, however, that there is no substantial difference in the subsample pro-portions of private sector or self-employed graduates. This might be taken as evidence that higher education levels do not differ by worker type, perhaps due to their human capital value or because self-employment plans may not come to fruition and students are hedging against their future.
Our estimated earnings equations are set out in Table 3. We present two sets of results: first, earnings equations for employees and self-employed workers with bivariate sample selection; and second, we follow Bardasi and Monfardini (1997) in presuming that the real dimension of employment sector choice in Italy is actually trivariate (private sector employee, public sector employee, self-employed). We are thus able to obtain some perspective on both the Wolpin (1977) and Psacharopoulos (1979) methodologies.
4.1. Bivariate sample selection
Considering the bivariate results first, it is apparent that age and age-squared are both significant in the deter-mination of the earnings of both worker types and sug-gest a concave relationship between earnings and age. Following Riley (1979), we would predict that if edu-cation is an effective screening device, then it should be an accurate signal of worker productivity. The estimated earnings function of employees is, therefore, expected to fit the data better than that for the self-employed. This is indeed the case with approximately 24 (16) per cent of the variation in employed (self-employed) earnings being explained by the regression, suggesting a rejection of the null hypothesis that there is no evidence of screen-ing.
The WSH presumes that all worker types invest in education for human capital to the same extent, whilst screened workers also invest as a signal of inherent pro-ductivity. Unscreened workers have no need to signal their productivity and we therefore expect their wages to be relatively less correlated with education. Any return to the these groups from education should represent a ‘pure’ return to investment in human capital since they gain nothing from education as a signal. Screened work-ers, in contrast, need to signal their ability in the labour
market and thus accrue a return from both the signalling and productivity augmenting functions of education. The WSH implies, therefore, a higher return for the screened relative to the unscreened subsample. The SSH, in con-trast, implies a significant return for the screened sub-sample only.
Our results would appear to support weak, but not strong, screening. It is apparent from Table 3 that, rela-tive to respondents with only primary level or no formal education, the possession of an intermediate school cer-tificate or university degree significantly raises the earn-ings of both worker types, whilst the possession of a high school certificate significantly raises the earnings of employed, but not self-employed, workers. Moreover, the rates of return to both intermediate and high school education are significantly higher for employees, whilst there is no significant difference in the rates of return to university education across the two subsamples.
4.2. Trivariate sample selection
A similar conclusion may be drawn from the trivariate sample selection results. The two employee subsample regressions explain more of the variance of earnings than the self-employed subsample regression, whilst the coef-ficients on the educational certificate dummy variables are significant for all three subsamples, but larger for the two employee subsamples. Thus again one would con-clude tentatively in favour of weak, but not strong, screening.
Focusing exclusively on the employee subsamples allows us to perform a P-test comparison across the ‘competitive’ private and ‘uncompetitive’ public sectors. The presumption underpinning the P-test is that screen-ing is relatively more likely in the public sector where wages are more readily linked to education via long-standing bureaucratic practice. Psacharopoulos argues that under the WSH employers will offer relatively high starting salaries to the more educated, ceteris paribus. Under the SSH, they will maintain this differential over time—i.e. even after the employee’s true productivity has been discerned.
Our results would appear to offer some support for the SSH, with the returns to education in the public sector dominating those in the private sector even when we proxy for an individual’s job tenure through age. Such a conclusion is, however, extremely tentative. We are unable to control fully for tenure and the coefficients on both age terms are insignificant. Moreover, the returns to education in the private sector are, albeit relatively low, nevertheless significant. More generally, the results, which accord with those of Bardasi and Monfardini (1997), might simply reflect the peculiar aspects of the Italian public sector:
401
S.
Brown,
J.G.
Sessions
/Economics
of
Education
Review
18
(1999)
397–404
Summary statistics
All workers All employed Private sector employees Public sector employees Self-employed
Mean S.D. Mean S.D. Mean S.D. Mean S.D. Mean S.D.
ln earnings 10.182 0.478 10.109 0.420 10.097 0.420 10.159 0.421 10.379 0.563 Married 0.868 0.338 0.880 0.325 0.901 0.299 0.790 0.409 0.835 0.371 Divorced/widowed 0.028 0.166 0.0246 0.155 0.023 0.150 0.032 0.176 0.038 0.191 Single 0.104 0.305 0.095 0.293 0.076 0.265 0.178 0.384 0.127 0.333 No. children 1.491 1.135 1.545 1.141 1.595 1.140 1.325 1.122 1.345 1.106 Degree 0.094 0.292 0.094 0.292 0.078 0.268 0.166 0.373 0.095 0.294 High education 0.295 0.456 0.304 0.460 0.274 0.447 0.433 0.497 0.272 0.446 Intermediate education 0.341 0.474 0.352 0.478 0.358 0.480 0.325 0.470 0.313 0.465 Low education 0.585 0.493 0.251 0.434 0.290 0.454 0.076 0.267 0.320 0.467 Age 42.252 10.317 41.669 9.726 41.806 9.587 41.064 10.331 43.822 11.637 North West 0.180 0.384 0.174 0.379 0.175 0.381 0.166 0.373 0.1962 0.398 North East 0.128 0.335 0.115 0.319 0.111 0.314 0.134 0.342 0.165 0.371 Central 0.204 0.403 0.233 0.423 0.243 0.429 0.191 0.394 0.123 0.329 Island 0.184 0.388 0.181 0.385 0.174 0.379 0.210 0.409 0.193 0.395 Construction 0.175 0.380 0.183 0.387 0.224 0.417 0.000 0.000 0.152 0.360 Energy 0.192 0.394 0.225 0.418 0.276 0.447 0.000 0.000 0.101 0.302 Commerce 0.173 0.378 0.072 0.258 0.088 0.283 0.000 0.000 0.446 0.498 Transport/communications 0.102 0.303 0.122 0.327 0.149 0.357 0.000 0.000 0.048 0.213 Finance 0.026 0.158 0.033 0.178 0.040 0.197 0.000 0.000 0.006 0.079 Consultancy 0.028 0.166 0.026 0.159 0.032 0.175 0.000 0.000 0.035 0.184 Public sector 0.138 0.345 0.184 0.388 0.000 0.000 1.000 0.000 0.013 0.112
402 S. Brown, J.G. Sessions / Economics of Education Review 18 (1999) 397–404
Table 3
Earnings equations for Italian male full-time workers (T-statistics in parenthesis) Bivariate selection Multivariate selection
Private sector Public sector
All employees Self-employed Self-employed
employees employees
Age 0.0329 0.0575 0.0132 0.0061 0.0572
(3.108) (2.987) (0.936) (0.263) (3.061)
Age2 20.0003 20.0005 20.000 0.0001 20.0005
(22.052) (22.343) (20.058) (0.186) (22.346)
Degree 0.6258 0.6311 0.7583 1.1121 0.6299
(13.019) (5.807) (12.299) (3.657) (5.860)
High education 0.3481 0.2930 0.4475 0.7489 0.2922
(9.991) (3.776) (10.701) (2.819) (3.807)
Intermediate
0.1458 0.0926 0.1628 0.5334 0.0922
education
(4.292) (1.224) (4.372) (2.761) (1.232)
Lambda 20.1013 20.0476 20.4123 0.6765 20.0390
(21.889) (20.782) (23.609) (2.041)) (20.651)
Constant 9.0254 8.7426 9.5811 8.1160 8.7401
(39.941)) (20.320) (29.588) (10.095) (20.533)
N 853 316 696 153 316
F-statistic 46.649 11.104 45.019 6.581 11.064
(6846) (6309) (6689) (6150) (6309)
Log likelihood 2348.435 2235.660 2267.343 268.155 2235.760
R2adjusted 0.243 0.161 0.275 0.177 0.161
Mean ln w 10.109 10.379 10.097 10.159 10.379
Lazear Ho: 0.2452 0.2042 0.8841 0.5269 0.1246
(7846) (7226) (7689) (7150) (7226)
Notes: The Lazear hypothesis refers to the Chow (1960) test of equality between the regression illustrated and one omitting self-employed professionals.
of education generally required (very high, parti-cularly in some sub-sectors like those of health and education), the structure of working hours in most sub-sectors (which offer a large amount of leisure and the opportunity of a collateral activity) and the social reputation of many occupations. On the other hand, the private sector leaves more scope for individual initiative and personal responsibility and, thanks to a greater mobility and flexibility, offers more possi-bilities for a career. (Bardasi & Monfardini, 1997, p. 4.)
A definitive conclusion is, perhaps, unwise and we would prefer to conclude in favour of weak screening and to offer our findings as an incitement to future research into this issue.
4.3. Consumer screening
As a final test, we considered the Lazear (1977) ‘con-sumer screening’ hypothesis that self-employed pro-fessionals acquire qualifications in order to signal the
quality of their services to potential clients, thereby upwardly biasing the coefficients on educational certifi-cates for this worker type. Removing self-employed pro-fessionals from the sample, re-estimating the various equations and performing Chow (1960) equality tests yielded F-statistics which in all cases rejected the pre-sumption of such a bias (see Table 3).
5. Final comments
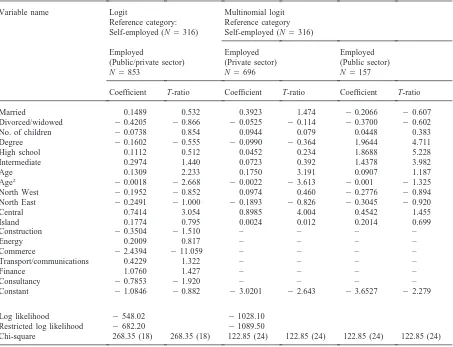
Table 4 Sample selection
Variable name Logit Multinomial logit
Reference category: Reference category Self-employed (N5316) Self-employed (N5316)
Employed Employed Employed
(Public/private sector) (Private sector) (Public sector)
N5853 N5696 N5157
Coefficient T-ratio Coefficient T-ratio Coefficient T-ratio
Married 0.1489 0.532 0.3923 1.474 20.2066 20.607
Divorced/widowed 20.4205 20.866 20.0525 20.114 20.3700 20.602
No. of children 20.0738 0.854 0.0944 0.079 0.0448 0.383
Degree 20.1602 20.555 20.0990 20.364 1.9644 4.711
High school 0.1112 0.512 0.0452 0.234 1.8688 5.228
Intermediate 0.2974 1.440 0.0723 0.392 1.4378 3.982
Age 0.1309 2.233 0.1750 3.191 0.0907 1.187
Age2 20.0018 22.668 20.0022 23.613 20.001 21.325
North West 20.1952 20.852 0.0974 0.460 20.2776 20.894
North East 20.2491 21.000 20.1893 20.826 20.3045 20.920
Central 0.7414 3.054 0.8985 4.004 0.4542 1.455
Island 0.1774 0.795 0.0024 0.012 0.2014 0.699
Construction 20.3504 21.510 – – – –
Energy 0.2009 0.817 – – – –
Commerce 22.4394 211.059 – – – –
Transport/communications 0.4229 1.322 – – – –
Finance 1.0760 1.427 – – – –
Consultancy 20.7853 21.920 – – – –
Constant 21.0846 20.882 23.0201 22.643 23.6527 22.279
Log likelihood 2548.02 21028.10
Restricted log likelihood 2682.20 21089.50
Chi-square 268.35 (18) 268.35 (18) 122.85 (24) 122.85 (24) 122.85 (24) 122.85 (24)
Acknowledgements
We are grateful to the Banca d’Italia for supplying data from their 1989 Survey of Household Income and Wealth. The use of the data, however, lies under the full responsibility of the authors since the Banca d’Italia is not involved in the conclusions of the research. We are also grateful to Orn Bodvarsson and two anonymous ref-erees for helpful comments.
References
Albrecht, J.W. (1981). A procedure for testing the signalling hypothesis. Journal of Public Economics, 15, 123–132. Anon. (1995). Britain’s university challenge. The Economist 22
April, 20–21.
Arabsheibani, G. (1989). The Wiles test revisited. Economics Letters, 29, 361–364.
Arabsheibani, G., & Rees, H. (1997). On the weak versus the
strong version of the screening hypothesis. Economics of Education Review, 17(2), 189–192.
Arrow, K.J. (1973). Higher education as a filter. Journal of Pub-lic Economics, 2, 193–216.
Bardasi, E., & Monfardini, C. (1997). The choice of the work-ing sector in Italy: a trivariate probit analysis. European Uni-versity Institute Working Paper ECO No. 97/9.
Becker, G.S. (1975). Human Capital. Chicago, IL: University of Chicago Press.
Berg, G. (1971). Education and jobs: the great training rob-bery. New York: Praeger.
Blanchflower, D.G., & Oswald, A. (1990). Self-employment and the enterprise culture. In: R. Jowell, S. Witherspoon, & L. Brook (Eds.), British social attitudes: The 1990 report. Aldershot, UK: Gower.
Chow, G. (1960). Tests of equality between sets of coefficients in two linear regressions. Econometrica, 28(3), 591–605. Cohn, E., Kiker, B., & Mendes De Oliveira, M. (1987). Further
evidence on the screening hypothesis. Economics Letters, 25, 289–294.
404 S. Brown, J.G. Sessions / Economics of Education Review 18 (1999) 397–404
system of documentation on employment (SYSDEM). Employment Observatory Trends, 18–20.
Fredland, J.E., & Little, R.D. (1981). Self-employed workers: returns to education and training. Economics of Education Review, 1(3), 315–337.
Grubb, W.N. (1993). Further tests of screening on education and observed ability. Economics of Education Review, 12(2), 125–136.
Heckman, J. (1979). Sample selection bias as a specification error. Econometrica, 47, 153–162.
Katz, E., & Ziderman, A. (1980). On education, screening and human capital. Economics Letters, 6, 81–88.
Lambropolous, H.S. (1992). Further evidence on the weak and the strong versions of the screening hypothesis in Greece. Economics of Education Review, 11(1), 61–65.
Lang, K. (1994). Does the human capital/educational sorting debate matter for development policy? American Economic Review, 84(1), 353–358.
Layard, R., & Psacharopoulos, G. (1974). The screening hypothesis and the returns to education. Journal of Political Economy, 82(5), 985–998.
Lazear, E. (1977). Academic achievement and job performance: a note. American Economic Review, 67, 252–254. Lee, K.-H. (1980). Screening, ability, and the productivity of
education in Malaysia. Economics Letters, 5, 189–193. Lee, L.-F. (1983). Generalised econometric models with
selec-tivity. Econometrica, 51(2), 507–512.
Liu, P.-W., & Wong, Y.-C. (1982). Educational screening by certificates: an empirical test. Economic Inquiry, 20(1), 72–83.
Miller, P.W., & Volker, P.A. (1984). The screening hypothesis: an application of the Wiles test. Economic Inquiry, 22, 121–127.
Mincer, J. (1974). Schooling, experience and earnings. New York: Columbia University Press.
OECD (1992). Education at a glance. Paris: OECD Centre for Educational Research and Innovation.
Oosterbeek, H. (1992). Study duration and earnings: a test in relation to the human capital versus screening debate. Eco-nomics Letters, 40, 223–228.
Oosterbeek, H., & Groot, W. (1994). Earnings effects of differ-ent compondiffer-ents of schooling: human capital versus screen-ing. Review of Economics and Statistics, 76(2), 317–321. Psacharopoulos, G. (1979). On the weak versus the strong
ver-sion of the screening hypothesis. Economics Letters, 4, 181–185.
Psacharopoulos, G. (1994). Returns to investment in education: a global update. World Development, 22(9), 1325–1343. Raban, A.J. (1991). Working in the European Community: A
guide for graduate recruiters and job-seekers (3rd ed.). Office for Official Publications of the European Communi-ties, Cambridge, UK: Hobsons.
Riley, J.G. (1979). Testing the educational screening hypoth-esis. Journal of Political Economy, 87(5), 227–251. Sakamoto, A., & Chen, M.D. (1992). Effect of schooling on
income in Japan. Population Research and Policy Review, 11(3), 217–232.
Shah, A. (1985). Does education act as a screening device for certain British occupations. Oxford Economic Papers, 37, 118–124.
Sicherman, N. (1991). Overeducation in the labor market. Jour-nal of Labor Economics, 9(2), 101–122.
Spence, M. (1973). Job market signalling. Journal of Labour Economics, 87, 355–374.
Stiglitz, J.E. (1975). The theory of ‘screening’, education, and the distribution of income. American Economic Review, 65, 283–300.
Tucker III, I.B. (1986). Evidence on the weak and the strong versions of the screening hypothesis in the United States. Economics Letters, 21, 391–394.
Weiss, A. (1995). Human capital vs. signalling explanations of wages. Journal of Economic Perspectives, 9(4), 133–154. Wiles, P. (1974). The correlation between education and
earn-ings: the external-test-not-content hypothesis (ETNC). Higher Education, 3(1), 43–58.
Wolpin, K.I. (1977). Education and screening. American Econ-omic Review, 67, 949–958.