MONITORING AND DEFORMATION ANALYSIS OF GROYNES
USING TLS AT THE RIVER ELBE
F. Tschirschwitz a *, K. Mechelke a, H. Jansch b, T. P. Kersten a
a HafenCity University Hamburg, Photogrammetry & Laser Scanning Lab, Überseeallee 16, 20457 Hamburg,
(felix.tschirschwitz, klaus.mechelke, thomas.kersten)@hcu-hamburg.de b
Federal Waterways Engineering and Research Institute, Hydraulic Engineering in Coastal Areas, Wedeler Landstraße 157, 22559 Hamburg, [email protected]
Commission V, WG V/5
KEY WORDS: 3D, Deformation, Groyne, Monitoring, Point Cloud Library (PCL), TLS
ABSTRACT:
To enter the Port of Hamburg, one of Europe’s busiest ports all vessels need to navigate around 145 km along the Elbe river, a tide influenced navigation channel. To protect the Elbe shoreline from erosion and to channel the waterway groynes (rigid hydraulic structures) have been built along the river. In the past years since ca. 2001 there has been a large increase in damage of groynes structural integrity at parts of the German waterways. The reason for this was determined in the ever growing size of container vessels passing by and inducing long periodical primary waves which have such a force that they erode the groynes rock structure. To analyse and improve the groynes structural resistance for vessel-induced long periodical wave loads an in-situ study is carried out at Juelssand, located at the Elbe river estuary. Over a period of two years the change of the geometrical structure of two different groyne shapes is monitored automatically by utilising two terrestrial laser scanners mounted in protective housings, located each on a 12 m high platform. The self-contained monitoring systems perform scanning of the two groynes one to two times a day at low tide, as the structures are fully submerged at high tide. The long-periodical wave loads are also determined using pressure sensors in each groyne. To correlate the captured data with vessel events and analyse the effects, vessel related parameters are recorded utilizing the Automatic Identification System (AIS).
This paper describes the automated processes for the data acquisition and focusses on the deformation that is calculated using current, extended and new algorithms of the Point Cloud Library. It shows the process chain from the acquisition of raw scan files from an elevated station to the filtering of point cloud, the registration, the calculation of pointwise changes and the aggregation to a grid for later correlation with ship parameters. When working outdoor in all kinds of weather conditions, the processes and equipment need to be robust and account for various cases and situations. This is especially applicable for the algorithms, which need to be adaptable to different scenarios like wet surfaces or snow and unwelcome objects ranging from flotsam to birds sitting on the groyne. At the current stage of the research, deformation in the magnitude of a couple of decimetres is observable. The orientation and location of the deformation is on the seaward side and corresponds to the lower distance of vessels leaving the harbour.
* Corresponding author
1. INTRODUCTION
In recent years terrestrial laser scanners (TLS) have been used for deformation analysis. The method was successfully utilized to cover a multitude of applications such as monitoring of geotechnical objects (e.g. slopes), whereby mainly long-range laser scanners with more than 500 m distance measurements are used (Wiatr et al. 2009). Also for monitoring of civil engineering structures, the scanning technology has been successfully applied. Thus for example Kutterer & Hesse (2006) detected structural deformations of a lock using terrestrial laser scanning, while Zogg & Ingensand (2008) verified the load-dependent deformation of a bridge. Holst et al. (2012) used terrestrial laser scanning to derive the deformation of main reflector of a telescope, while Eling (2009) shows the successful use of TLS for dam monitoring. TLS has also been used for monitoring of rough surfaces such as cliffs (Lim et al. 2005). Further monitoring applications along waterways have been
carried out by Korth & Lösch (2015) who monitored historic wooden pillars at a channelled river.
Automatic monitoring systems on the other hand, especially with fully automatic data evaluation, are rarely used. Challenges are in the huge amount of data for processing and the reliable derivation of the required characteristics such as rigid body movements of geometrical shapes. First attempts of automatic monitoring and analysis using TLS were made by Pfaffenholz et al. (2007) using a Leica HDS4500 and difference images. Ohlmann-Lauber (2010) describes a "TLS for rock fall observations" and Mechelke et al. (2012) automated TLS for different purposes under laboratory and field conditions. A practical example was the deformation analysis of a temple wall of the historic Almaqah temple in Ethiopia caused by the temperature changes of a single day.
Although TLS has been used in various applications and measurement modes, data analysis is a very specific and individual case. Grosse-Schwiep et al. (2015) use the high frequency of the contactless laser scanning to document deformations of rotor blades of wind turbines using only distance measurements (1D). Malikov & Ohlmann-Lauber (2014) employ a profile scanner to detect deformations in building interiors (2D). For processing of 3D scans a lower dimensionality is often useful for the calculation of specific parameters as shown by Schneider (2006) using consecutive profiles of 3D scanning data to describe the bending line of a tower.
2. PROJECT
The Federal Waterways Engineering and Research Institute (BAW) is a technical and scientific federal authority, which provide consultancy and expertise by advising the Federal Waterways and Shipping Administration (WSV) about technical waterway engineering aspects. This includes optimizing the function and stability of hydraulic structures within the federal waterways. An example of hydraulic structures are groynes, which serve various purposes in hydraulic engineering such as shore protection, river regulation and channelling.
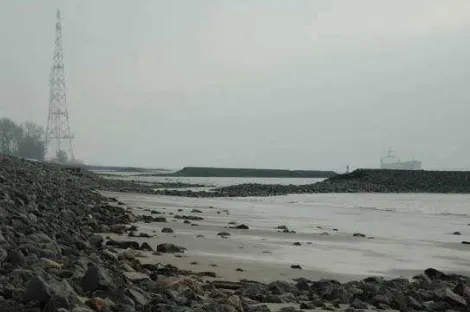
Since around 2001 an increasing rate of damages to groynes and bank revetments is observable. In the river Elbe section Juelssand groyne breakthroughs with a width of approximately 20 m have been observed (Fig. 1). The reason of these damages is an increasing load due to the long periodic primary waves induced by the increasing size of vessels.
Figure 1. Breakthrough between groyne and revetment connection at Juelssand due to vessel-induced long-periodic
wave loads
In order to considerably reduce future maintenance costs for groyne structures in waterways, the BAW has initiated a pilot study of a stability test utilising optimized groyne variants as part of a research project. A fundamental part of the study is the geodetic monitoring of structural damage occurring despite optimization due to vessel-generated events. For this task, an automated, area-based monitoring by terrestrial laser scanning is suitable and therefore currently implemented in a research cooperation between BAW and HafenCity University Hamburg for a period of two years.
The long-periodical wave loads are determined by using up to 5
pressure sensors individually mounted at the groyne’s structure.
To correlate the captured data with vessel events and analyse the effects, vessel related parameters are recorded utilizing the Automatic Identification System (AIS). AIS is a radio system, transmitting vessel particulars and navigational data, used for general vessel traffic navigation.
Ideally the scanning would be carried out after each vessel’s
passage. That is impossible because the structures are fully submerged at high tide. To reduce the time difference to a minimum, scanning takes place at low tide while the groyne is mostly visible so a single vessel or series of vessel passages can be identified as a cause for the deformation.
The rate of deformation is unknown and a discontinuous deformation is expected, therefore the scanning is carried out with the maximum scan resolution possible. The demands for the accuracy are not only limited by the scanning system but also by the definition of the hydraulic structure itself, which consists of dark and heavy stones. As they do not form a closed surface, holes in between the individual rocks can result in deformations with huge uncertainties up to stone size of a few decimetres (Fig. 2).
Figure 2. Damages despite optimized groyne design and construction
In the study area two groynes are rebuilt with varying parameter in design, construction type and stone class. Based on preliminary results they will be iteratively rebuilt optimising the configuration further. The simultaneous monitoring with two identical measurement setups also allows for a direct comparison of two groyne configurations at nearly identical environments.
3. SETUP OF MEASUREMENT SYSTEM
One of the first tasks in designing a monitoring system after the determination of the accuracy requirements and the expected rate of deformation is the selection of the equipment to use. In preliminary studies various measurement systems were tested to generate a single data set of a groyne at low tide. For testing purposes scanning was carried out both at ground level and from an elevated position by utilising a lifting carriage. Conclusively scanning was verified as a feasible method for monitoring the groyne’s deformation. The next task is selecting the positions for the monitoring sensors. For an elongated object with different inclinations such as a groyne, the following two sensor configurations for the monitoring are possible: The measurement from multiple stations or the data acquisition from an elevated position. For measurements from
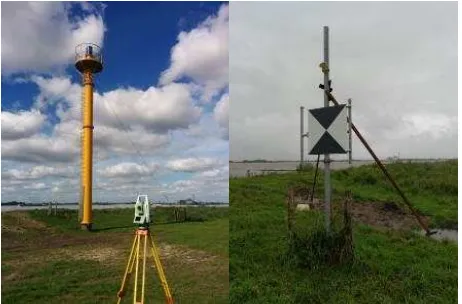
multiple views, sensor relocation or the use of multiple devices is necessary. For economic and technical reasons both options are not feasible. Since both luv and leeward side of the structure should be investigated (Fig. 2), the possible elevated scanner positions are limited along the axis of the object (groyne crown). However considering safety aspects objects must not be setup in waterways, therefore sensor positioning on and in front of the groyne is impossible. These positions are also unsuitable, since they would influence the vessel-induced wave load or even the structure itself. The only adequate and at the same time most practical position for the monitoring system is therefore at an elevated position onshore behind the summer dyke and revetment. Based on these preliminary considerations, two platforms were installed by the Waterways and Shipping Office Hamburg (Fig. 3, left). Each sensor platform is about 12 m high, founded several meters deep, strutted with steel cables in different directions and secured against unauthorized entry.
Figure 3. Platform for monitoring system at the bottom of the summer dyke (left), strutted pile with reference target as chess
pattern 80×80 cm2 (right)
From the predefined acquisition geometry, the requirements on the measuring sensor can be obtained by simulation and have been verified by test measurements. The measuring distances are between 15 m and 120 m with an angle of incidence of about 5° to 35°. However, not only technical, but also economic (price), logistical (available software) and safety aspects are crucial for the final selection of an appropriate instrument. For example, for safety reasons it is only allowed to scan with laser category I using an invisible laser at the measuring location Juelssand. Based on these criteria, as well as extensive tests and preliminary investigations (Kersten & Mechelke 2013), an IMAGER 5010 from Zoller+Fröhlich was chosen to be acquired and used for the monitoring project. The highest possible angular scanning resolution for this system is an angle increment of 0.0002° allowing a theoretical grid spacing of 1 cm at the groyne head. However due to the angle of incidence and roughness of the object, the grid spacing is considerably larger. The entire groyne structure can be scanned under normal weather conditions with about 65 million points when fully emerged from the water.
As a part of further preliminary investigations, even an oscillatory movement of the sensor platform was detected despite the strutting. At medium wind speed the top of the tower registers lateral position changes of several millimetres. However the integrated dynamic tilt compensation of the IMAGER 5010 is capable to compensate for the inclination component of the movement.
The registration of the scans in the reference coordinate system is carried out using three well-distributed target plates at a distance of 120 meters (Fig. 3, right). These plates are connected to a metal frame set up with a concrete foundation and secured by strutting against wind pressure. The target used has a 45° rotated black and white chessboard pattern. Suitable for the specified long measurement distances, the dimension of 80×80 cm2 were specified for the targets in order to guarantee a sufficient point density on each target for determining the scanner position even in adverse weather conditions. The determination includes positional and rotational differences between epochs. The possible positioning differences of the sensor within one epoch are currently not computed, thus neglected now.
Another important component for an outdoor monitoring system is the protective housing (Fig. 4, right). In this project presented, the system is operating continuously over a period of several months (10 months, status April 2016). The system is subjected to different weather conditions as well as to the usual daily and seasonal variations in temperature. The protective housing consists of two concentric cylinders. The inner cylinder has four openings, which are arranged in the direction to the reference targets and the object itself, while the outer cylinder has only one opening, which coincides in dimension with the largest window (towards the groyne).
At predefined measuring time, the outer cylinder rotates so that a scan window opens in the direction of the respective measurement object and the data acquisition will be performed. At the end of the measurement period, the outer cylinder rotates again so that all openings are closed. Afterwards it is secured with a locking pin against opening by external influences such as wind. If a measurement system is located at a remote location or is not directly connected to the Internet and the energy supply network, it has to be controlled by radio and operated on a self-contained power supply. In this case the power supply consists of a solar panel, a wind generator (Fig. 4, left) and a fuel cell. Wind and solar energy can be assumed as complementary power sources, because in the study area only one resource is usually dominant. In times of a shortage of renewable energy sources, the fuel cell is used as a buffer coupled with a lithium-ion battery (LiFePO4 / 135 Ah), which is charged regularly by the three power generating systems. The setup presented requires regular replenishment of the fuel as part of a two- to four-week maintenance cycle.
Figure 4. Complete system setup with case, solar panel and wind wheel (left), casing for the scanner on top of the platform
(right)
To relieve the power supply, the control and evaluation logic is
The operation of the measuring system is based on the expected time of low tide calculated by the Federal Maritime and Hydrographic Agency (BSH) provided in the form of an Excel spreadsheet. The groynes are completely overflooded at high tide and can therefore only be scanned at low tide. This predefines the timeslots for scanning the groynes to about every 10.5 to 12.5 hours. Considering the water level monitored by gauging stations (Pegel Online, 2016), it can be derived that a time frame of 30 minutes before and 10 minutes after low tide is an optimal period for scanning expecting the lowest water levels at the location. In this specified time period, the scan of the relevant object surface takes place, while the reference targets are always available and independent of the water level and thus scanned after the groyne itself. For the recording of an entire measurement epoch, the system needs less than one hour using the current configuration which corresponds to about 500 MB data per groyne.
Although the system is working automatically, it currently needs manual supervision and infrequent control. The computer controlling the measurement process is connected to the network of the BAW, so that remote maintenance and system monitoring is possible. System failures at the early project stage caused by unexpected events could be remedied quickly. Operational loss could be limited to short periods of time since the correction could be carried out from the office as part of the normal work routine.
The general vulnerability of monitoring systems is the power supply. Although the most software driven problems were identified and resolved after some weeks of the testing phase, problems with the power supply are difficult to simulate. They will occur when various factors emerge at the same time and even then, will only become visible at a later time due to the energy buffering. All power supply sources are neatly prepared to generate sufficient energy for the predefined measurement process, e.g. less than one hour of scanning, motors and switches turned off, etc. However unexpected conditions resulting in undefined system behaviour will therefore be a danger for correct operation of the system. For example if there are problems in the context of the radio transmission and important commands like turning the scanner off are not received by the system, the components will stay turned on and the system is operating above its power supply capacity. Since the scanner is the largest energy consumer, a failure of the transmission will generate an issue in the energy section and the power supply will cause a system failure. Such a failure is hard to locate but the consequences are also wider for the systems operation. Most of the time, above mentioned energy problems will force a direct response at the site and therefore a technician has to check the equipment. Due to the location of the scanning device and power supply on top of the platform, the technician has to be trained working at heights and must be accompanied by a second person for safety reasons. The relocation of the control computer to a remote location introduces another source
of error by the addition of a WLAN connection. Due to the fact that the piles are located in the center of a nature reserve, there is no other option then using radio transmission and an autonomous power supply, as interfering into the nature reserve is strictly forbidden e.g. by laying cables. Furthermore, it must also be noted that the temperature and the weather conditions can take decisive influence on the reliability of the measurement system. Temperatures below 0°C for example require a special procedure before scanning with such a high scan resolution as used in this project. This is due to the motor used, which can only ensure their constant running speed at low temperatures, a pre-heating period of the sensor has to be performed. Another possibility due to the not availability of the pre-hearting routine is to perform some scans beforehand at a lower resolution to heat up the system and to discard their results. More experiences for scanning at low temperatures will show whether the measures taken in the measurement process are sufficient to get reliable results at all temperatures that are common in the study area.
Another important aspect in the operational use of the monitoring system is the detection of errors and the handling of system failures. For that reason, parts of the software functionality have been designed as separate components, which allow for an independent dataflow and to draw conclusions about the reason and cause of failures. A first step in the automation of this procedure is the remote maintenance that was described earlier. A second step is an e-mail alert for critical system conditions. This alert will be expanded in the future to a general communication system that regularly monitors the current state of the system and frequently sends a report to an e-mail address after each epoch in order to reduce manual system monitoring effort even further.
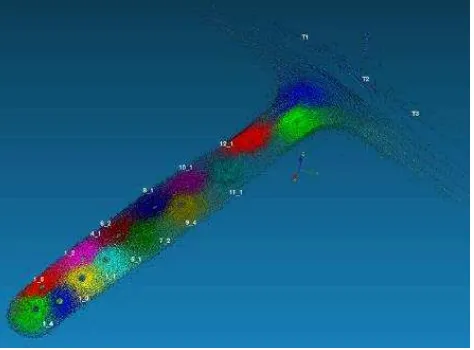
Figure 5. Acquired data of the reference epoch of groyne 31 representing the 15 scan stations by different colour
5. DATA PROCESSING
The data evaluation of the groynes is carried out by 3D comparison of each measured period in respect to a reference period (Fig. 6). The measurement of the reference period took place directly after completion of the reconstruction of the two structures in July 2015 with a terrestrial laser scanner Zoller+Fröhlich IMAGER 5010 and a Faro Focus3D X 330. Both groynes were scanned simultaneously at low tide with different equipment from about 15 scan stations on the structure itself (Fig. 5). The registration of the scans was carried out using well distributed targets placed on the objects outer edges.
The standard deviation of the target positions was 2 mm, with a maximum residual of less than 1 cm. The three targets at the coast and five at the head were measured with a Leica TS60 and are connected to the local reference system on the dykes and fields around the sensor platform. The targets in between were used as identical tie points without reference coordinates for registration. For consistency reasons all following numbers, values and figures are taken from the measurement of the groyne 31.
The laser scans of the reference epoch were processed using the scanner manufacturer’s standard software. Filters for single points, mixed pixel points, low intensity or high range points have been applied and the resulting point clouds have been subsampled to 5 mm point spacing. Subsequently the point cloud was imported into the software Geomagic Wrap and a mesh with a spacing of 20 mm, resulting in 4.2 million triangles, was calculated. This spacing was chosen togenerate a 2.5D surface where at each location only one single height is valid. The holes in the data due to the rocky structure of the stones were closed, using flat and curvature based filling methods to generate a closed surface model of the groyne (Fig. 6).
Figure 6. Mesh of reference epoch, closed surface with 20 mm point spacing
To calculate the deviations for each measured epoch, the resulting point cloud of each epoch has to be registered into the superior coordinate system of the monitoring network. As described above, each epoch consists of scans of the groyne and the three stable reference targets, which are used for the registration of each epoch in the same coordinate system. The proprietary (*.zfs) scan files are processed using the Software Development Kit from Zoller+Fröhlich (ZFS SDK), while all further processing is based on data structures and algorithms provided by the Point Cloud Library (PCL). The ZFS SDK provides the most important filter routines such as filtering for single or mixed pixels. It is capable to read the proprietary binary scanning files. The usage of the SDK is restricted and requires a special software license key. PCL, used in version 1.8.0, provides datatypes for intensity and coloured point clouds, standard filtering algorithms and among others tools for data visualisation (Rusu & Cousins, 2011). It is developed as part of an open-source initiative to offer tools for all kinds of computer vision / perception based tasks in 3D like OpenCV for the image based (2D) community.
Due to varying conditions (dry / wet rock surfaces, snow, birds, etc.) during scanning the groynes, a lot of outliers still persist in the data, even after applying the above mentioned filter algorithms. The first step to eliminate those is a spatial plausibility filter This filter is based on a hull that is defined by the outline of the groyne with a thickness of a few meters. Only points that lie inside of this volume are considered as valid
measurements and are therefore used for further evaluation. By following the visible outline of the structure at the reference epoch, all invalid points from the water surface had been excluded. It can be assumed that the groyne will erode over time
and therefore the maximum height won’t change, so the height of valid points has to be lower than the groyne crown (ridge). It can also be assumed that material will not disappear, but is relocated into the visible and invisible part of the groyne as well as the groyne field. For this reason, a deposition of material is expected at some areas and therefore the plausibility hull cannot follow the slope directly as valid points will also be above the height of the reference epoch. Therefore a simple box filter is not appropriate, but these effects can be solved by using a PCL filter CropHull. The CropHull filter generates a subsample of the point cloud based on a watertight mesh. This hull is generated manually only once for the whole scan area and is based on the outline visible in the reference epoch (Fig. 7).
Figure 7. Spatial plausibility hull (CropHull) for groyne 31, consisting of 140 triangles approximating the given outline
All filters used which deemed necessary were extended to take into account multiprocessor setups with OpenMP (Dagum 1998). OpenMP uses the C++ features of pragma directives to implement the desired functionality. In this case, the general data processing has been split into various CPU threads for balancing the processing load. Based on the potential of the algorithms memory and CPU usage, a performance increase of 30 to 80% per core has been achieved.
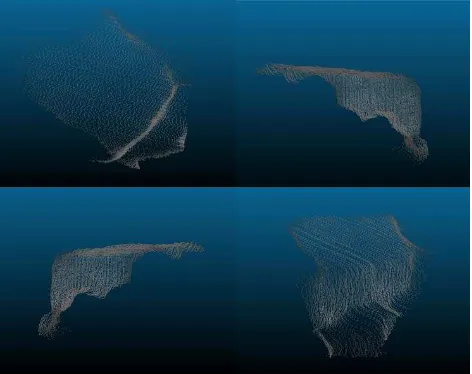
Figure 8. Top, left, front and iso view of a cropped scan of a single stone (30×40×20 cm³)
Even after the elimination of irregular points not all remaining points follow the definition of representing the top surface of the structure. In Fig. 8 it can be seen that due to the angle of incidence points will not represent only the top, but all kinds of stone faces. Therefore the comparison is bounded not only bythe measurement precision but also by to the definition accuracy since also side faces of the rocks are considered.
The effect is reduced using a voxel grid filter, which reduces the point cloud density close to the scan station, where the high scan resolution results in far too many points. The number of points on vertical surfaces has been reduced as well by volumetric filtering. The edge length does not have to be equal for all coordinates axes and therefore it is a good way to reduce the effect in the later gridding process. Using a voxel based approach, apart from a range image based approach, the best possible sampling on the object is achieved and regions with low density are not affected.
For the final revision the workflow will consider normal vectors for the selection of points to evaluate. In areas with high point density the normals are calculated from their neighboring points and offer a good representation for the orientation of the values are variants of 2x where x equals 5 and 7. Therefore the segmentation in 4096 cells is carried out in a recursive loop for various points in parallel. The grid is aligned to the groyne so that 50% of the cells are luv and the other 50% are leeward the crown of the groyne.
6. PRELIMINARY RESULTS
To analyse the movement of rock material it has to be acknowledged that a few limitations persist due to the system itself and the measurement configuration. First, due to the measurement at different weather conditions and water levels, not the whole groyne is always visible and therefore comparable. Second, when material has eroded, holes are created. Holes have edges which are easier visible for the measurement system than the top of the surface. This is even more relevant, the further the observed point is away from the monitoring system. For the weather aspect one has to look at the signal intensity which is used to calculate a valid distance measurement. The further the points are away, the lower is the intensity by the inverse-square-law and therefore the likelihood for invalid points will increase. For the second argument the signal strength is not only relative to the material and the distance, but also to the angle of incidence (Zámečníková et al., 2014). When holes are developing, vertical edges become movement of stones at the groyne can be determined. In Fig. 9, the gridded data starting with differences to the reference epoch from the first epoch to the latest calculations of February 2016
is visualised. The difference in the observable part of the groyne is clearly visible. Some cells still represent blunders because the point cloud is not satisfactorily filtered at the moment. Therefore a layer of manual plausibility checks is involved to decide which measurements are excluded for the further analysis.
By examining regions in consecutive scans the areas of erosion and deposition can be identified. At the latest evaluated epoch of February 2016 a depression parallel to the groyne crown is visible. This depression causes nearly most of the groyne crown to collapse.
The highest erosions can be found at one third of the groyne length apart from the shore. This is as well the part of the groyne where the crown has the highest elevation and most likely has to withstand the highest wave loads. The groyne material has mainly been displaced by the vessel-induced wave loads to the northwest side of the groyne in an almost parallel shift of ca. 10 m to the groyne crown. The reason for this one-sided shift is that the vessels passing by from Hamburg to the North Sea (sailing in the northwestern direction) passing by in short distances inducing a higher load than the vessels sailing to Hamburg, as they pass by in a larger distance almost having no impact on the groyne.
The current relative stable parallel shift did not develop at once, but there have been several different stages in between. Evaluating for example the scan after 5 months (Fig. 9, middle row, right) a regular wave like pattern running perpendicular to the crown line can be detected. Further analyses of the derived data will provide a better understanding of the causes and the process of the groynes deformation and vessel-induced long-periodical primary wave loads.
To verify the results and to get a true dimension for the accuracy reached, measurements with different systems have to be carried out. The standard data acquisition procedure involves the profiling of the structure with GNSS or totalstation measurements. This also includes the human factor for the decision which points represent the profile and thereby the full groyne. Since this information is not available at the moment, the accuracy is estimated by the distribution of difference in a single grid cell and number of measurements. If this information is gathered at a later stage, a verification of the estimated accuracy is planned.
The next step in the data evaluation and analysis is to correlate the deformation with vessel-induced loads at a passage. For that matter not only the whole deformation is considered but also the inter epoch differences of two consecutive measurements. With that information it will be possible to pinpoint the deformation to a series or even a single event of vessel-induced loads.
Due to the system failures described earlier, epoch-wise or multi-day outages hinder a continuous data analysis. Since the deformation is caused by vessel-induced events, a discontinuous deformation is expected and values are not interpolated. At stages without data, the correlation will provide a greater time frame listing a larger number of possible events responsible for this deformation.
7. CONCLUSION AND OUTLOOK
In this contribution a new methodology for a monitoring system is introduced, which meets the requirements for quantitative deformation documentation of hydraulic structures by terrestrial laser scanning. The methodology permits a review of the deformations in the cycle of low tide for the subsequent correlation with vessel passages and therefore long-periodic primary loads. Based on preliminary results, the stability of the tested groyne design and construction can be quantified. Deformations up to several decimetres are detectable and show an erosion of the structure. The displacement is mainly parallel to the groyne crown and primarily one sided (NW). A high percentage of the shifted material still remains in the area of the groyne and becomes visible at low tide. At spring tides areas of the groyne that were covered by water at the reference measurement become visible and therefore a greater part of the actual hydraulic structure can be properly analysed. This extension of the area to be evaluated will be implemented in the future, as a visual inspection proposes that the alternating pattern of erosion and deposition continues even under the water surface including the groyne field.
Existing downtime of the system due to unexpected events and challenging conditions resulted in data gaps, where a single or a series of epochs are not available. Downtimes were reduced considerably in 2016 after problems with the operation in low temperatures were eliminated and the reliability of the power supply was improved by exchanging the fuel cell against a different model.
The precise geometric distribution of the deformation will help to optimise the design of the groyne. In the next stage of the research project, one of the two groynes will be rebuild using larger stone material and possibly optimising the design according to the derived monitoring results. It is assumed that if
the optimised groyne does not withstand the vessel-induced wave loads that the start of the deformation is timewise shifted backwards and reduced in its amount. This will already be an economic improvement due to the lower maintenance interval of the groyne.
Various parts of the data processing are still under development. The selection of the points for comparison, other filtering algorithms and the system accuracy have to be investigated further and adapted to the challenging conditions. A new stochastic model for the single point precision as proposed in Wujanz et al. (2016) may help to get a better estimation for the grid cells value by weighting the induvial points with their varying single point precision.
By evaluating the deformation in consecutive epochs a considerable improvement in the reliable calculation should be achieved. Objects like floatsam or birds will not be visible in consecutive epochs and therefore filtered by temporal averaging.
The automatic detection of area-based deformation is not only interesting in hydraulic engineering. For monitoring structures or geotechnical processes a continuous and area-based data acquisition is often useful. Especially due to the high point density of terrestrial laser scanning, it is possible to increase the monitoring accuracy potential due to the derivation of averages or representing standard geometries such as planes or ellipsoidal sectors. In the methodology presented further automation levels and lower epoch intervals can be realized. The software is expandable in its structure and functionality, so that a transfer to other geodetic monitoring tasks is possible. The development of the algorithms used for the optimisation of the system is planned for the next months. Especially the outlier detection is important to improve the automation in quality control. This new method of this monitoring system has great potential to be applied to other challenging surveying tasks.
Figure 9. Visualisation of gridded deformation [m] from left to right and top to bottom. Epoch interval is about 1 month starting with the measurement of the reference epoch till 7 month later
Outline of groyne
Waterway
REFERENCES
Dagum, L. & Menon, R., 1998. OpenMP: an industry standard API for shared-memory programming. Computational Science & Engineering, IEEE, 5, pp.46-55.
Eling, D., 2009. Terrestrisches Laserscanning für die Bauwerksüberwachung. Dissertation, German Geodetic Commission (DGK). Munich, Series C, 641.
Holst Ch., Zeimetz, Ph, Nothnagel, A., Schauerte, W., Kuhlmann, H., 2012. Estimation of focal length variations of a 100-m radio telescope`s main reflector by laser scanner measurements. Journal of Surveying Engineering ASCE, 138 (3), pp. 126-135.
Grosse-Schwiep, M., Piechel, J., Luhmann, T. 2014. Measurement of Rotor Blade Deformations of Wind Energy Converters with Laser Scanners. Journal of Physics: Conference Series, 524 (1), IOP Publishing.
Kersten, T., & Mechelke K., 2013. Einsatz von terrestrischen 3D-Laserscannern beim Monitoring von Strombauwerken. Pilot study for the Federal Waterways Engineering and Research Institute, internal report, 20 p.
Korth, W., & Lösch, P., 2015. Deformationsmessungen an Uferbefestigungen mit Laserscanning. 18. Internationale Geodätische Woche Obergurgl. Hanke, K. & Weinold, T. (Hrsg.), Herbert Wichmann Verlag, VDE VERLAG GMBH, Berlin/Offenbach.
Kutterer, H., & Hesse, Ch., 2006. High Speed Laser Scanning for Near Real-Time Monitoring of Structural Deformations. Dynamic Planet IAG Symposia, P. & C. Rizos (Eds.), 130, Springer, pp. 776-781.
Lim, M., Petley, D. N., Rosser, N. J., Allison, R. J., Long, A. J. & Pybus, D. 2005. Combined digital photogrammetry and time‐of‐flight laser scanning for monitoring cliff evolution. The Photogrammetric Record, 20 (110), pp. 109-129.
Malikov, S., Ohlmann-Lauber, J. 2014. A contribution to the application of the 2D laserscanner SICK LMS511 for deformation analysis. Blue Series Books at the Chair of Geodesy, 22, 12/2014.
Mechelke, K., Sternberg, H. & Keller, F. 2013. A Monitoring System with TLS Sensor. Proceedings of the 2nd Joint International Symposium on Deformation Monitoring, Nottingham UK, JISDM 2013, submission 153, September.
Ohlmann-Lauber, J., 2010. TLS für Felssturzbeobachtungen. Terrestrisches Laserscanning TLS 2010 – mit TLS-Challenge, Schriftenreihe des DVW, Band 64, Beiträge zum 101. DVW-Seminar am 6. und 7. Dezember 2010 in Fulda. Wißner-Verlag, Augsburg, pp. 129-138.
Paffenholz, J.-A., Neumann, I., Kutterer, H. 2007. Entwicklung eines remote-monitoring Systems für den HDS 4500.
Photogrammetrie, Laserscanning, Optische 3D-Messtechnik. Beiträge der Oldenburger 3D-Tage 2007. T. Luhmann und C. Müller (Eds.). Heidelberg, Germany. Wichmann Verlag, pp. 188-195.
Pegel Online (2016): Gewässerkundliches Informationssystem der Wasser und Schifffahrtsverwaltung des Bundes (WSV)
https://www.pegelonline.wsv.de/webservices/files/-Wasserstand+Rohdaten/ELBE/HETLINGEN (16.02.2016).
Schneider, D. 2006. Terrestrial laser scanning for area based deformation analysis of towers and water dams. Proccedings of 3rd IAG/12th FIG Symp., Baden, Austria, May 2006, pp. 22-24.
Rusu, R. & Cousins, S., 2011. 3D is here: Point Cloud Library (PCL). IEEE International Conference on Robotics and Automation (ICRA), 9.-13. May, Shanghai, China.
Wiatr, T., Fernandez-Steeger, T. & Reicherter K. 2009. Untersuchung von Massenbewegungen und Störungsflächen mit terrestrischem Laserscanning. Photogrammetrie, Laserscanning, Optische 3D-Messtechnik - Beiträge der Oldenburger 3D-Tage 2009, Th. Luhmann & Ch. Müller (Eds.), Wichmann Verlag, Heidelberg, pp. 118-126.
Wujanz, D., Burger, M., Mettenleiter, M., Neitzel, F. 2016. Modellbasierte Standpunktplanung für terrestrische Laserscanner (TLS) unter ingenieurgeodätischen Gesichtspunkten. Photogrammetrie, Laserscanning, Optische 3D-Messtechnik – Beiträge der Oldenburger 3D-Tage 2016, Th. Luhmann & Ch. Schumacher (Eds.), Wichmann Verlag, in preparation.
Zámečníková, M., Neuner, H., Pegritz, S., & Sonnleitner, R.,
2015. Influence of surface reflectivity on reflectorless electronic distance measurement and terrestrial laser scanning. Journal of Applied Geodesy 8.4 (2014): pp. 311-326.
Zogg, H.-M. & Ingensand H. 2008. Terrestrial Laser Scanning for Deformation Monitoring – Load Tests on the Felsenau Viaduct (CH). The International Archives of the Photogrammetry, Remote Sensing and Spatial Information Sciences, 37 (B5), pp. 555-561.
![Figure 9. Visualisation of gridded deformation [m] from left to right and top to bottom](https://thumb-ap.123doks.com/thumbv2/123dok/3283964.1402700/7.595.53.532.63.332/figure-visualisation-gridded-deformation-m-left-right.webp)
