HYPERSPECTRAL ANOMALY DETECTION IN URBAN SCENARIOS
J. G. Rejas Ayuga a,b , R. Martínez Marín b, M. Marchamalo Sacristán b , Bonatti, J. c and Ojeda, J.C.b
a National Institute for Aerospace Technology, INTA. Ctra. de Ajalvir km 4 s/n
28850 Torrejón de Ardoz (Spain), [email protected]
b Department of Engineering and Land Morphology, Technical University of Madrid, UPM.
Ramiro de Maeztu, 7, 28040 Madrid (Spain), [email protected], [email protected], [email protected], [email protected]
c Costa Rica University, UCR. Campus UCR 4058 San José (Costa Rica), jbonatti2011@gmail
Commission VII, WG VII/3
KEY WORDS: Anomaly Detection (AD), Urban Areas, Hyperspectral, High Resolution Data, DATB.
ABSTRACT:
We have studied the spectral features of reflectance and emissivity in the pattern recognition of urban materials in several single hyperspectral scenes through a comparative analysis of anomaly detection methods and their relationship with city surfaces with the aim to improve information extraction processes. Spectral ranges of the visible-near infrared (VNIR), shortwave infrared (SWIR) and thermal infrared (TIR) from hyperspectral data cubes of AHS sensor and HyMAP and MASTER of two cities, Alcalá de Henares (Spain) and San José (Costa Rica) respectively, have been used.
In this research it is assumed no prior knowledge of the targets, thus, the pixels are automatically separated according to their spectral information, significantly differentiated with respect to a background, either globally for the full scene, or locally by image segmentation. Several experiments on urban scenarios and semi-urban have been designed, analyzing the behaviour of the standard RX anomaly detector and different methods based on subspace, image projection and segmentation-based anomaly detection methods. A new technique for anomaly detection in hyperspectral data called DATB (Detector of Anomalies from Thermal Background) based on dimensionality reduction by projecting targets with unknown spectral signatures to a background calculated from thermal spectrum wavelengths is presented. First results and their consequences in non-supervised classification and extraction information processes are discussed.
1. INTRODUCTION
Detection of spectral anomalies aims at extracting automatically pixels that show significant responses in relation to their surroundings. This paper deals with the non supervised technique of target detection, also called Anomaly Detection (AD), applied to hyperspectral urban scenes. Since this technique assumes no prior knowledge about the target or the statistical characteristics of the data, the only available option is to look for objects that are differentiated with respect to a background. Several methods have been developed in the last decades, allowing a better understanding of the relationships between image dimensionality and the optimization of search procedures (Duran and Petrou, 2007; Schaum, 2005; Stein et al., 2002) as well as the subpixel differentiation of the spectral mixture and its implications in anomalous responses (Bar et al., 2010; Eismann et al., 2009; Manolakis and Shaw, 2002; Nasrabadi 2008).
In other sense, image spectrometry has proven to be efficient in the characterization of materials based on statistical methods using specific reflection and absorption bands (Marino et al., 2001). Spectral configurations in the VNIR, SWIR and TIR have been successfully used for mapping materials in different urban scenarios (Malpica et al., 2008; Rejas et al., 2007; Segl et al., 2003).
There has been an increasing interest in the use of high resolution data (both spatial and spectral) to detect small objects and to discriminate surfaces in areas with an urban complexity. This has come to be known as target detection which can be
either supervised or unsupervised. In supervised target detection algorithms lean on prior knowledge such as the spectral signature. The detection process for matching signatures is not straightforward due to the complications of converting data acquired by airborne sensors with material spectra in the ground (Haboudane et al., 2002). This could be further complicated by the large number of possible objects of interest, as well as uncertainty as to the reflectance or emissivity of these objects and surfaces.
An important aim in this research is to establish relationships that allow the interconnection between spectral anomalies with informational anomalies and, therefore, identify actual information about surfaces, materials and their state of preservation related to anomalous responses in urban areas rather than simply differences from a background without a specific meaning. In this sense this work presents a multi-methodology approach applied to the analysis of the correlations between spectral anomalies and urban materials in Alcalá de Henares city (Spain) and San José city (Costa Rica). We analyse the influence of spectral resolution in the determination of the background as a critical parameter in order to detect of anomalies using hyperspectral sensors.
2. STUDY CASES AND DATA SETS
Several anomaly detectors have been tested with images of the AHS for Alcalá de Henares and HyMAP and MASTER for Costa Rica corresponding to two different test urban areas but with similar complexity. We used reflectance images of the AHS (Rejas et al., 2005) acquired on April 8, 2004 in Alcalá de
Henares city. The AHS scene (80 channels between 0.4589 µm and 12.70 µm) has a dimension of 750 x 4075 pixels, with a spatial resolution of 3.4 m.
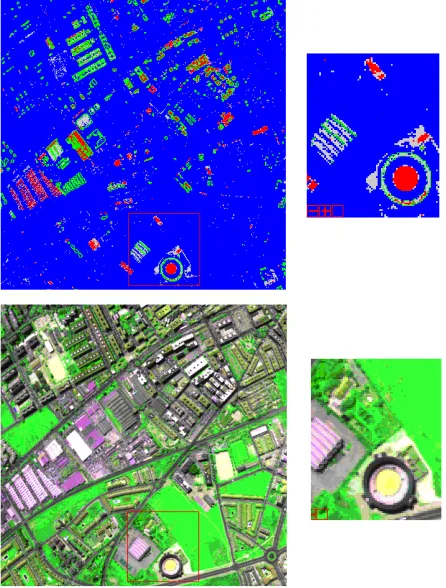
Figure 1. AHS rgb 12,6,2 combination image of Alcalá de Henares (right) and MASTER rgb 13,7,4 combination of San José (left).
We used reflectance images of HyMAP sensor (Cocks et al., 1998) and the MASTER sensor (Hook et al., 2001), acquired both the 7 March 2005 in the San José city. The scene HyMAP (125 channels between 0.4589 µm and 2.491 µm) has a dimension of 710 x 2415 pixels, with a spatial resolution of 15 m fused with aerial photography to 4 m. The MASTER scene is 1650 x 4466 pixels, with spatial fused resolution of 9 m and radiometric resolution of 16-bit. The 50 MASTER image channels are grouped in a port of 25 channels in the VNIR-SWIR (0.463 µm – 2.427 µm), and 25 channels between 3.075 µm and 13 µm in the MIR and TIR.
An algorithm Minimum Noise Fraction (MNF) has been applied to all data set. Channels sensors presenting a high signal/noise ratio were rejected, particularly ranging from 53 to 63, and the 38,42,44,53 channels for AHS; channels 62 to 65 and 125 for HyMAP; and channels 16 to 19, 25 to 41 and 50 for MASTER. The airborne images have been georeferenced directly by GLT ENVI algorithm, using the geometry computed from position and orientation data measured by an inertial GPS/ IMU at the same time of acquisition over the study areas in all cases.
3. ANOMALY DETECTION
Anomalies obtained based on the standard method RX (Reed and Xaoli, 1996), have been verified by those computed using methods based on subspaces, as the Subspace SSRX and the Orthogonal Subspace Projection-OSPRX (Borghys et al., 2012), as well as the Uniform Target Detector (UTD), a mixed detector RXD-UTD and a projection pursuit (PP) image method (Malpica et al., 2008).
The computation in all methods has been carried out separately for spectral ranges of reflective channels and emissive for the AHS test data set. The main challenge is how to accurately characterize “interestingness” in a numerical fashion. In the case of this paper “interestingness” can be defined in terms of
outliers. In this sense, we have been calculated a thermal index THI (Rejas et al., 2009), taking advantage of the spectral discrimination between diagnostic bands in the emissive spectrum.
The proposed methodology DATB, Detector of Anomalies from Thermal Background has been tested with hyperspectral images from different imaging spectrometers corresponding to several urban scenarios, therefore with different spectral background. The four phases of the DATB that can be developed separately are: (i) definition of spectral subspaces; (ii) extraction of endmembers in subspace VNIR; (iii) projection on the thermal background and dimensionality reduction and (iv) searching the best projection maximizing the thermal index THI by the RX standard. The parameters on DABT require an expert knowledge giving by the expression:
C VNIR
b Sr f
n =( /2)⋅ (1)
Where SrVNIR is the spectral resolution in the VNIR port
wavelengths between 0.4 µm and 2.5 µm, and fc a complexity
factor between 0 and 2, meaning the minimum 0 to a scene with absent complexity (for example an image of water) and maximum 2 for a scene with the highest proportion of surfaces and materials that can be detected as spectral anomalies (for example images of urban scenarios). DATB method as a variation of PP is not looking for the best imaging projection for all the hyperspectral cube, but in the identity matrix n×n, n is the number of channels in the hyperspectral cube VNIR channels, and thermal nb the number of channels used to model
the subspace bottom (1 ≤ nb <n), thus responding to the above
image segmentation strategy between the reflective and the emissive spectrum.
Figure 2. OSPRX anomalies in red colour (thermal anomalies in green colour not detected in VNIR) from VNIR channels of AHS (up) and AHS rgb 6,12,2 combination (down) of the Alcalá de Henares test site.
The results show the benefits of the strategy to detect of a variety of targets whose VNIR spectral signatures have significant deviation in relation to their thermal background. DATB is an automated technique in the sense that there is not necessary to adjust parameters, providing successfully results in all cases. Subpixel anomalies which cannot be distinguished by the human eye, on the original image, however can be detected as outliers due to the projection of the VNIR endmembers with a very strong thermal contrast. Furthermore, a comparison between the proposed approach and the well-known RX detector and others is performed at both modes, global and local.
The suggested method outperforms the existents in particular scenarios, demonstrating its performance to reduce the probability of false alarms, as we will discuss in the next section.
Figure 3. HyMAP RXD-UTD detail of anomalies (up left) and OSPRX (up rigth) of the San José test site, 4 m pixel size. MASTER RXD (down left) detail of anomalies and DATB anomalies (down right) for the same semi-urban area of San José.
It can be seen that DATB in Figure 3 (down right) ignores the shadows of the clouds in order to detect anomalies in a wide area of the city beneath them. The fire can be seen in the lower left corner (Figure 3, up left), is detected as strong anomaly in MASTER SSRX, and HyMAP RXD-UTD and OSPRX, although global DATB, although it is detected, the value of the anomaly is lower.
It is very significant the change in the results of the anomalies detection obtained with MASTER set. This result proves the thermal sensitivity of DATB in relation with certain surface
responses as well the input radiance shadow produced by clouds. In above in Figure 3 (down right) lightness tones
represent the pixels detected as strong anomalies that were detected in DATB and not SSRX. The water reservoir of the central square of San José is detected as anomaly in these conditions by DATB method, while it is not in SSRX.
The results of the automatic algorithm DATB have demonstrated improvement in the qualitative definition of the
spectral anomalies by replacing the classical model by the normal distribution with a robust method. For their achievement has been necessary to analyse the relationship between biophysical parameters such as reflectance and emissivity, and the spatial distribution of detected entities with respect to their environment, as for example some buried or semi-buried materials, or building covers of asbestos, cellular polycarbonate-PVC or metal composites.
Anomalies detected for all methods have been classified (see Figure 4) with an unsupervised K-Means algorithm in five clusters: error (cluster 1), background 1 (cluster 2), background 2 (cluster 3), anomaly at confidence level of 50 % (cluster 4) and anomaly at confidence level of 100% (cluster 5).
DATB method has been chosen as the most suitable for anomaly detection using imaging spectrometers that acquire them in the thermal infrared spectrum, since it presents the best results in comparison with the reference data, demonstrating great computational efficiency that facilitates its implementation in a mapping system toward as a Real-Time Mapping technique.
Figure 4. Example of comparison of RX global anomalies (left) and DATB anomalies (right) by K-Means algorithm from MASTER image of San José. The anomalies have been classified in five cluster: error, background 1, background 2 in withe colour; strong anomalies in black and smooth anomalies in red.
4. DISCUSSION AND COMPARATIVE ANALYSIS
The relationship between the spectral anomalies and the diagnostic bands of the urban materials has been studied. In order to do that, it has been linearly adjusted a sample space of 35 points of urban materials and covers (asphalt, concrete, sport infrastructures, building roofs, asbestos, gravel roof, tile roof, PVC roof, metal, glass, synthetic polycarbonate-petrol stations, water, sand, trees, bush, etc.) in both test areas of Alcalá de Henares and San José.
All regressions have been calculated at a confidence level of 95%, removing in each adjustment the sample values that showed unusual residues and which correspond with radiometric distortions and shadows mainly for the MASTER set data of San José. The highest correlation coefficients from the regressions,-0.83 and 0.85, indicate a moderately strong relationship.
0% 20% 40% 60% 80% 100% 1
2 3
AHS_Image_02_subALC4_SSRX VNIR
Background 0 Background Anomaly 50% Anomaly
Figure 5. Example of comparison of SSRX anomalies from VNIR AHS image of Alcalá de Henares: (1) Town, (2) Industrial and (3) Semi-urban areas.
It has been established a clear relationship between thermal anomalies and particular urban materials, as PVC, metal and roofs of petrol stations, as well as a clear relationship between VNIR anomalies and urban materials with a great influence of the diagnostics bands in SWIR spectrum (for example tile roofs, asbestos or bullfighting place).
Anomaly Detection (%) – Alcalá de Henares city (Spain) Detector Town Urban/Resid. Industrial
RX 0.38 4.18 1.94
SSRX 0.44 3.85 1.50
OSPRX 0.31 3.91 1.89
RX-vnir 0.30 3.38 1.66
RX-tir 0.24 3.26 1.65
SSRX-vnir 0.29 3.38 1.48
SSRX-tir 0.33 4.00 1.92
OSPRX-vnir 0.24 2.86 1.36
OSPRX-tir 0.84 5.74 2.51
DATB 1.86 4.17 2.76
Table 1. Comparison of results (anomalies %) between anomaly detectors for Alcalá de Henares city in relation with the full scene (580563 pixels).
Anomaly Detection (%) – San José city (Costa Rica) Detector Town Urban/Resid. Industrial
RX 3.00 3.31 8.55
RX local 4.05 4.43 6.50
SSRX 3.19 3.99 9.86
OSPRX 2.45 2.42 5.36
UTD 3.48 10.03 9.66
RX-UTD 3.52 4.49 13.32
DATB 43.14 5.35 0.01
Table 2. Comparison of results (anomalies %) between anomaly detectors for San José city in relation with the full scene (1228656 pixels).
The difference between spectral anomalies with and without VNIR diagnostic bands of the AHS case is 0.75%, and for TIR diagnostic bands of the AHS case is 0.84%, while the difference with respect to the background was -2.52% and -2.32%, respectively.
The difference between spectral anomalies with a 10 m pixel size and with a 4 m pixel size for the MASTER and HyMAP data set of San José test site was -0.80%, while the difference with respect to the background was 1.03%. Results of the standard RX, OSPRX, SSRX, UTD, mixed RXD-UTD anomaly detectors and DABT were compared in spectral ranges of
different image technologies into two urban test areas with similar complexity, Alcalá de Henares and San José.
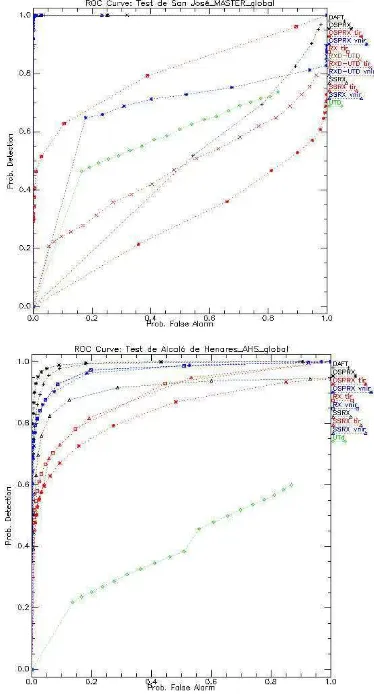
ROC (Receiver Operating Characteristic) curves, showing the detection rate (Prob. Detection) versus the false alarm rate (Prob. False Alarm), are used to evaluate the results obtained with the various detectors. Instead of arbitrarily choosing a threshold, it is preferable to select several thresholds and see how the proportion of pixels correctly or incorrectly classified varies with changes in the value of the threshold. This information comes from what is known as the ROC curve which plots the probability of detection versus probability of false positive. The Figure 6 sets out the ROC curves for all methods analyzed with the AHS and MASTER test data set of Alcalá de Henares and San José, respectively. For both test data set with resolved targets, an ROC curve is calculated based on all RX targets in the image.
Figure 6. ROC curves for San José MASTER test data set (up) and for Alcalá de Henares AHS test data set (down).
The results show the best anomaly detector for the HyMAP test data set of San José is the RXD-UTD, while for the AHS test data set of Alcalá de Henares is the OSPRX detector.
From the analysis of the thermal spectral anomalies we have observed that the AHS data show great discriminatory power for some urban covers (see Figure 8, right). It has been proved how the cover of petrol stations and PVC roofs, with insulating material, respond with a very close radiation to the black body for the AHS. These urban covers are mainly placed in the
urban/residence areas and the historical city centre of the Alcalá de Henares in this case (Figure 7).
In other sense, VNIR anomalies are mainly detected in the industrial area of the Alcalá de Henares test site, corresponding with the big number of the SWIR diagnostic bands for the urban materials and objects in this area.
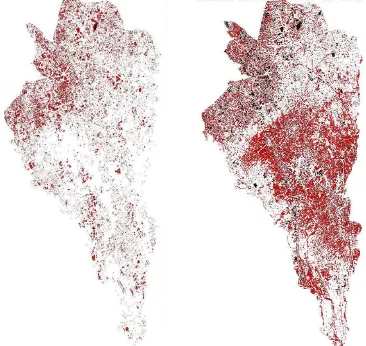
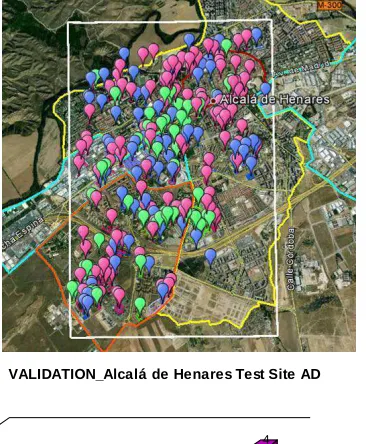
Figure 7. Comparison of AHS anomalies between Semi-urban areas (1, orange area), Industrial (2, cyan area), Urban/Residence (3, yellow area) and Town (4, red area) in the Alcalá de Henares test site. Validation for Alcalá de Henares test site (white rectangle is the AHS image cover). VNIR anomalies (blue), TIR (magenta) and both VNIR-TIR (green). (Source: Google Earth).
We have obtained some very strong anomalies corresponding to different surfaces of great interest (Marino et al., 2001). For Alcalá de Henares test site (see Figure 8) one of them corresponds to cellular polycarbonate of a cover gas station, other corresponds to the Polytechnic School building cover of the University of Alcalá composed mainly by zinc, and other anomaly detected of great interest corresponds with an asbestos illegal building cover.
For the San José MASTER data set, it is found that DATB is more sensitive to detected some particular outliers, including very dark surfaces with diagnostic bands such as black fabric used in greenhouses for agricultural purposes, while other methods as SSRX, RX or OSPRX does not detect these zinc building cover and (3) asbestos building cover.
5. CONCLUSIONS
The characteristic of high resolution data, both spatial and spectral, for urban covers has been studied by different anomaly detection methods, using AHS, HyMAP and MASTER test data sets. This paper evaluates the performance of anomaly detection methods in scenes with similar backgrounds and types of targets for Alcalá de Henares city (Spain) and San José city (Costa Rica), respectively.
Some different anomaly detectors were considered besides the global RX: subspace methods, local methods, and segmentation based anomaly detection methods. For global anomaly detection in hyperspectral scenes of high complexity, OSPRX gives the best results for the Alcalá de Henares test site with the AHS data set, while for San José MASTER data set SSRX gives the best results. However, the DATB method was obtained similar results than the best methods when it was possible to implement it (that means DATB requires TIR channels), but with the advantage to detect anomalies different meaningfully corresponding with urban covers of great interest such as asbestos, metals and PVC.In this sense, this research improves the unsupervised classification processes, searching areas and automatically detecting urban materials of interest by virtue of their surface characteristics.
Higher concentrations of some urban materials in scenarios where the sources of error are minimized, are correlated with the anomalies in the VNIR range. Subjective evaluation of the detection results shows that the best performing detectors give complimentary results, and that “false alarms” are mainly due to objects with anomalous spectra in the scene such as cars, elements of buildings or radiometric distortions.
The spectral mixing associated directly with the spatial resolution has an impact in a significantly way on the characterization of the urban and semi-urban backgrounds, and thus in the spectral anomalies.
ACKNOWLEDGEMENTS
The authors would like to acknowledge to the Costa Rica University (Costa Rica) for providing the HyMAP and MASTER test data set of San José city.
The AHS test data set of Alcalá de Henares was provided by the Spanish National Institute for Aerospace Technology (INTA).
The present study has been partially supported by the research Project: COOP-XV-19 (Technical University of Madrid) and 1
AHS Spectral Anom alies: (1) Sem i-urban, (2) Industrial, (3) Urban, (4) Tow n
MACOSACEN, Manejo comunitario de suelos y aguas en Centroamérica A2/037794/11 (AECID Spanish Agency for International Development Cooperation - Technical University of Madrid).
REFERENCES
Bar, D.O., Wolowelsky, K., Swirski, Y., Figov, Z., Michaeli, A., Vaynzof, Y., Abramovitz, Y., Ben-Dov, A., Yaron, O., Weizman, L. and Adar, R., 2010. Target detection and verification via airborne hyperspectral and high-resolution imagery processing and fusion. Ieee Sensors Journal, Vol. 10, No. 3, March 2010.
Borghys, D., Achard, V., Kasen, I. and Perneel, C., 2012. Comparative evaluation of hyperspec-tral anomaly detection methods in scenes with diverse complexity. In Proc. OPTRO2012 Symposium on Optronics in Defence and Security, Paris, France.
Cocks T., R. Jenssen, A. Stewart, I. Wilson, and T. Shields, 1998. The HyMAP Airborne Hyperspectral Sensor: The System, Calibration and Performance. Proc. 1st EARSeL
Workshop on Imaging Spectroscopy (M. Schaepman, D.
Schläpfer, and K.I. Itten, Eds.), 6-8 October 1998, Zurich, EARSeL, Paris, p. 37- 43.
Duran, O. and Petrou, M., 2007. A time-efficient method for anomaly detection in hyperspectral images. IEEE Transactions
on Geoscience and Remote Sensing, Vol. 45, No. 12, December
2007.
Eismann, M.T., Stocker, A.D. and Nasrabadi, N.M., 2009. Automated Hyperspectral Cueing for Civilian Search and Rescue. Proceedings of the IEEE, No. 6, June 2009.
Haboudane, D., Miller, J.R., Tremblay, N., Zarco-Tejada, P.J. and Dextraze, T., 2002. Integrated narrow-band vegetation indices for prediction of crop chlorophyll content for application to precision agriculture. Remote Sensing of Environment. vol. 81, no. 2/3, pp. 416–426, Aug. 2002.
Hook, S. J. Myers, J. J., Thome, K. J., Fitzgerald, M. and A. B. Kahle, 2001. The MODIS/ASTER airborne simulator (MASTER) - a new instrument for earth science studies. Remote
Sensing of Environment, vol. 76, Issue 1, pp. 93-102.
Manolakis, D. and Shaw, G., 2002. Detection Algorithms for Hyperspectral Imaging Aplications. IEEE Signal Processing Magazine, January 2002.
Malpica, J.A., Rejas, J.G. and Alonso, M.C., 2008. A projection pursuit algorithm for anomaly detection in hyperspectral imagery. Pattern Recognition 41 (11) pp: 3313-3327, 2008. ISSN 0031-3203.
Marino C.M., Panigada C. and Buetto L., 2001. “Airborne hyperspectral remote sensing applications in urban areas: asbestos concrete sheeting identification and mapping”. IEEE/ISPRS Joint Workshop on Remote Sensing and Data Fusion over Urban Areas, 0-7803-7059-7/01.
Nasrabadi, N.M., 2008. Multisensor Joint Fusion and Detection of Mines Using SAR and Hyperspectral. Proceedings of IEEE
Sensors 2008 Conference.
Reed, I.S. and Xiaoli, Y., 1990. Adaptative multiple-band CFAR detection of an optical pattern with unknown spectral distribution. IEEE Transactions on Acoustics. Speech and
Signal Processing, Vol. 38, No 10, October 1990.
Rejas J.G., Prado E., Jiménez M., Fernández-Renau A., Gómez J.A. y De Miguel E., 2005. “Caracterización del sensor hiperespectral AHS para la georreferenciación directa de imágenes a partir de un sistema Inercial GPS/IMU”. International Congress 6ª Semana de Geomática, 10 pgs., Barcelona febr. 2005.
Rejas J.G., Martínez R. and Malpica J. A., 2007. Hyperspectral remote sensing application for semi-urban areas monitoring.
URBAN 2007 4th IEEE GRSS/ISPRS Joint Workshop on Remote
Sensing and Data Fusion over Urban Areas, Paris (France)
11-13 April 2007. IEEE, ISBN-1-4244-0711-7.
Rejas, J.G., Martínez-Frías, J., Bonatti, J., Martínez, R. and Marchamalo, M., 2012. Anomaly detection and comparative analisys of hydrothermal alteration materials trough hyperspectral multisensor data in the Turrialba volcano. XXII ISPRS International Conference, Melbourne, Australia, eISSN 2194-9034.
Schaum, A., 2005. Hyperspectral detection algorithms: Operational, next generation, on the horizon. Proceedings of the
34th Applied Imagery and Pattern Recognition Workshop (AIPR05).
Segl K., Roessner S., Heiden U. and Kaufmann, 2003. “Fusion of spectral and shape features for identification of urban surface cover types using reflective and thermal hyperspectral data”. ISPRS Journal of Photogrammetry & Remote Sensing 58 (2003) 99-112.
Stein, D.W.J., Beaven, S.G., Hoff, L.E., Winter, E.M., Schaum, A.P. and Stocker, A.D., 2002. Anomaly Detection from Hyperspectral Imagery. IEEE Signal Processing Magazine, January 2002.