METHODS FOR THE UPDATE AND VERIFICATION OF FOREST SURFACE MODEL
M. Rybansky a, *, M. Brenova a, P. Zerzana J. Simonb, T. Mikitab
a Dept. of Military Geography and Meteorology, University of Defence, Brno, Czech Republic – [email protected] b Dept. of Forest management and Applied Geoinformatics, Mendel University in Brno, Czech Republic – [email protected]
Commission IV, WG IV/1
KEY WORDS: Vegetation, Forest growth measurement, LIDAR, Digital Terrain Model (DTM), Digital Surface Model (DSM), Canopy height model (CHM), Forest database updating
ABSTRACT:
The digital terrain model (DTM) represents the bare ground earth's surface without any objects like vegetation and buildings. In contrast to a DTM, Digital surface model (DSM) represents the earth's surface including all objects on it. The DTM mostly does not change as frequently as the DSM. The most important changes of the DSM are in the forest areas due to the vegetation growth. Using the LIDAR technology the canopy height model (CHM) is obtained by subtracting the DTM and the corresponding DSM. The DSM is calculated from the first pulse echo and DTM from the last pulse echo data. The main problem of the DSM and CHM data using is the actuality of the airborne laser scanning.
This paper describes the method of calculating the CHM and DSM data changes using the relations between the canopy height and age of trees. To get a present basic reference data model of the canopy height, the photogrammetric and trigonometric measurements of single trees were used. Comparing the heights of corresponding trees on the aerial photographs of various ages, the statistical sets of the tree growth rate were obtained. These statistical data and LIDAR data were compared with the growth curve of the spruce forest, which corresponds to a similar natural environment (soil quality, climate characteristics, geographic location, etc.) to get the updating characteristics.
1. INTRODUCTION
Currently many developed countries invest significant funds for mapping the earth's surface using laser airborne scanning. The results of the mapping are usually presented in the form of digital terrain models and digital surface models (DTM and DSM), see Hubacek at all (2014, 2015). It is necessary to consider their reliability and actuality, see e.g. Hoskova-Mayerova (2013). While the DTM is relatively stable over time, see Demek at all. (2011), DSM has been significant changed, especially in forested areas. Acquisition of new airborne LiDAR data for the purpose of restoring the DSM is a very costly process. The authors describe a method of the DSM modification using the growth characteristics of vegetation and photogrammetric data analysis. Summary of the method consists in the determination of height changes of forest stands by using the growth curves for different types of trees, taking into account the factors that affect the growth. That method was tested on a spruce forest stand, located in the south-eastern part of the Czech Republic, northeast of Brno, near Utechov village. This spruce forest was chosen because it is the most common tree species in the Czech Republic and this location may be a representative sample of the natural vegetation environment in the Czech Republic. The current age of this forest is about 50 years. To determine changes in the canopy height the series of aerial photographs were used. The photographs were acquired during the military topographic maps up-dating periods from 1973 to the present. Also the DSM with an average density of 1 point per square meter was used to compare both data sources (aerial photographs and laser data). This DSM was generated from LIDAR data in 2013.
Natural environment and consequently the nature and structure of forest stands are highly differentiated in the Czech Republic. The conifers occupy more than 67% of area (Norway spruce 47,5%, Scots pine 13,9%), broadleaves about 32% of area (oaks 7,4%, European beech 7,2%). The occurrence of individual tree species and tree stand differentiation depend on the forest and vegetation zones, habitat, water-supply and the character of the site. It can be said, that about 8% of habitats from the position of micro orography does not allow the passage of routine and special techniques. Based on the indicated aspects it can be stated that the assessment of vegetation and analysis of dendrometric quantities are always specific issues.
There are many forest assessment methods based on the growth analysis process, e.g. KORF (1939), SLOBODA (1971), RICHARDS (1959) and many others.
Updating of the digital surface models, based on the similar growth curves, is very complicated because of the above mentioned heterogeneous tree species compositions. Use of these models is only appropriate in monocultures, in mixed stands would require the identification of the individual trees and the use of specific growth curves for each tree species. Another aspects which influence the tree growth are also spatially heterogeneous characteristics of forest habitats. In recent decades the development of growth simulators have been increased. These systems are targeted on the simulation of the forest behavior using the principle of ecosystem modeling. An example used in the Czech Republic is the simulator of forest biodynamics, named SIBYLA (Fabrika. 2005). Its use is wide, as valuable is the visual simulation allowing even the spatial updating of digital surface models.
The International Archives of the Photogrammetry, Remote Sensing and Spatial Information Sciences, Volume XLI-B4, 2016 XXIII ISPRS Congress, 12–19 July 2016, Prague, Czech Republic
This contribution has been peer-reviewed.
Another option of updating is the use of photogrammetric models.
For verification of growth were also used surveying methods and aerial photos from various periods. We analyzed the images from the years 2003, 2006, 2009, 2012 and 2014. For the analysis of DSM (CHM) changes was selected a test plot in forest stand situated approximately 300 meters south of village Brno –Útěchov. There were detected and measured the heights of the trees in the forest stand of the Training Forest Enterprise Křtiny (TFE). The test plot is part of the forest stand, situated approximately 300 meters south of the village Brno - Útěchov. The selected site is covered mainly by spruce forest stands with age of 27 years. Forest stand age was determined from Forest Management Plan (FMP) and confirmed from aerial photographs (AP) that were also used to determine the tree heights. Checking the older periods of AP we found that this area were freshly planted by young seedlings in 1993.
Terrain relief occurring in the area is rugged, sloping slightly towards the northeast. From geodetic and photogrammetric measurements it was found that currently the average height of a spruce stand is approximately 19 m, spacing between trees is between 2 to 4 meters and a stem circumference average is 0.7 meters. Important factors in selecting of the plot was representativeness of forest stand in terms of the prevailing tree species compositions of forest canopy in the Czech Republic, plot distance from Brno and the ability to link survey points to the geodetic points.
Figure 1. Location of TFE Křtiny
2. THE METHODS USED FOR HEIGHT CHANGE DETECTION
2.1 Geodetic surveying and photogrammetric evaluation
To determine changes in the heights of trees were selected two basic methods:
- Geodetic survey,
- Photogrammetric evaluation.
Another method that has been used to determine the height of the trees was using heights from a digital surface model (DSM) from Airborne LiDAR. However, this method was not proved as sufficiently effective and accurate in determining the heights of trees with the decimeter accuracy. Results from DSM significantly underestimated tree heights, therefore these results were not included into final evaluation.
2.2 Geodetic survey
Measurement of position of 116 trees and their heights were carried out by total station Leica TC 1500 during May 2015. To determine the position of trees points the polygon traverse was used.
Problems in geodetic measurement of the tree heights:
Geodetic survey of the tree heights must be taken as indicative. The first difficulty in measurement was very steep targeting to the top of a tree. This means that the telescope tachymeters was in a very reclined position, which was given by a very short distance to the measured trees. Another problem occurred in targeting to the top of a certain tree, because it was significantly influenced by low visibility through overlapping tree canopies of surrounding trees and the final location of tree tops had to be estimated.
2.3 Photogrammetric evaluation
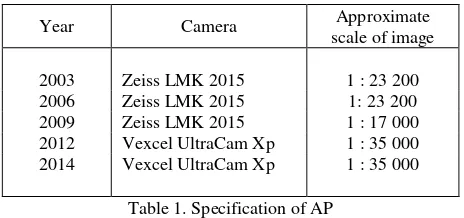
For the photogrammetric determination of tree heights in different time periods the colored AP were used. They were captured by the Military Geographical and Hydrometeorological Office (VGHMÚř) Dobruška at regular photographing periods in the Czech Republic. The AP specification are shown in Table 1:
Year Camera Approximate
scale of image
Table 1. Specification of AP
Images from the years 2003, 2006 and 2009 were recorded by analog (film) camera and were subsequently digitized.
In order to determine the tree heights, it was necessary to create a stereoscopic model. To create a stereoscopic models the elements of external orientation (PVO) AP were used. They were designed in the calculation of the analytical aerotriangulation (MATCH-AT software, the company INPHO). They were also provided by VGHMÚř Dobruška. For photogrammetric evaluation software was used ERDAS IMAGINE.
The heights of selected trees were determined as follows: - Through module Leica Photogrammetry Suite (LPS)
were created stereoscopic models using the following steps:
- defining the geometric model and sensor model (chamber),
- retrieving image data (LMS),
- defining elements of internal orientation of AP, - loading destined PVO,
- automatic determination of stereoscopic model. - to evaluate the heights of trees StereoAnalyst module
was used as a means for creating a stereoscopic perception active-controlled crystal glasses infrared emitter;
- height of individual trees have been identified as the altitude difference of treetops from photogrammetric measurement and altitude base of the tree from geodetic measurement.
Photogrammetric evaluation of heights can lead to various errors, the purposes may be follows:
The International Archives of the Photogrammetry, Remote Sensing and Spatial Information Sciences, Volume XLI-B4, 2016 XXIII ISPRS Congress, 12–19 July 2016, Prague, Czech Republic
This contribution has been peer-reviewed.
- different quality of image data: high-quality data are represented by images from the years 2014 and 2012 and images from 2003 has the lowest quality, - various scale of image data (see table 2), - various maximum possible usable scale of
stereoscopic models for evaluation (see Table 2) - which is dependent on a scale, and in particular on the quality of the AP (when the scale of stereoscopic model is higher, the greater is the accuracy of the defined features),
- the sweep of trees caused by wind - during acquisition of images by plane,
- the possible evaluator errors - it depends on the quality of vision and experience of evaluator.
Year maximum possible usable scale
2014 1 : 200
2012 1 : 200
2009 1 : 360
2006 1 : 650
2003 1 : 730
Table 2. maximum possible usable scale in different periods
3. RESULTS OF THE EVALUATION OF CHANGES IN FOREST HEIGHTS
3.1 Results of photogrammetric evaluation
The following Table 3 and Fig. 3 show the average values obtained by the tree height measurements. The average elevation of the tree bases (ground) is taken as the average of the geodetically measured values and is 469.32 m above sea level. From this value was subtracted the average height of the treetops in order to obtain the average height of the tree.
Method of height
detection fgm fgm fgm fgm fgm
Year 2003 2006 2009 2012 2014
Average altitude of
treetops 477,3 479,8 483,0 486,9 488,1
Average height of trees 7,96 10,43 13,63 17,58 18,74
Number of trees 60 87 101 110 102
Table 3. Changes in tree heights
In 2015 were geodetically measured the real heights of all trees, the average height of selected trees was 19.4 meters. The following Fig. 2 shows the progress of the growth of trees in the test area. Also the DSM with an average density of 1 point per square meter was used to compare both data sources (aerial
Figure 2. Progress of the growth of trees in the test area.
photographs and laser data) – see Fig. 3. This DSM was generated from LIDAR data in 2013.
The fact, that LIDAR data don’t correspondent with reality is due to the fact that the density of the reflected laser beams (1 m x 1 m) is not sufficient enough to catch the peaks of trees. The LIDAR average tree height is 6 m less than average height determined by photogrammetric method.
Figure 3. The DSM average height values generated from LIDAR data in 2013.
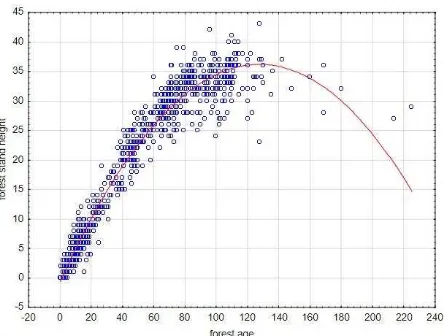
3.2 Comparison with data from FMP
Based on data analysis of FMP in TFE was developed growth model in dependency of the height of spruce stands on age (Fig. 4). As seen, the growth curve may have a wide range of values depending on the habitat, the spatial structure of the forest and climatic conditions and its common usage in larger scale is not appropriate. Using FMP there was determined height of forest stand 8 meters in 2003 (from photogrammetry - 7,96 m), that corresponds with measured height. In year 2012 the height was conducted to 15 meters (from photogrammetry 17,58 m). This irregularity could be caused by inaccuracy of height estimation during data collection for FMP.
The International Archives of the Photogrammetry, Remote Sensing and Spatial Information Sciences, Volume XLI-B4, 2016 XXIII ISPRS Congress, 12–19 July 2016, Prague, Czech Republic
This contribution has been peer-reviewed.
Figure 3. Height x age graph of spruce stands on TFE
The results of the measurements in a representative spruce forest and statistical calculations show that the tree growth curves rises relatively quickly from the beginning (young canopy), but becomes more flattened at the higher age. Repeatedly conducted photogrammetric evaluation of forest stands and the data from FMP could bring a new approach for the forest growth analysis and could be one of sufficient methods for DSM updating in different growth conditions of forest stands in Czech Republic. The results of this experiment show that this method is fully applicable for the DSM generated from LIDAR data. The method can be appropriately implemented as a relatively cheap up-dating tool in the GIS technology between two laser scanning campaigns of a territory. This method can also be refined using the growth curves of individual types of trees. It is also necessary to search the relationships between the natural environment factors and the specific canopy growth.The above mentioned DSM updating method could be used for many applications, e. g. in forestry, military, etc. – see e.g. Mazal at all (2015), Stodola and Mazal (2015).
ACKNOWLEDGEMENTS
This paper is a particular result of the defence research project DZRO K-210 and Specific research project 2016 at the department K-210 managed by the University of Defence in Brno.
References:
Demek, J., Balatka, B., Kirchner, K., Mackovčin, P.,Pánek, T., and Slavík, P., 2011. Relief of Czechia: Quantitative evaluation in the GIS environment. In: Geografie, 116, 2011, no. 2, pp. 111–129.
Fabrika, M., 2005. Simulátor biodynamiky lesa SIBYLA, koncepcia, konštrukcia a programové riešenie (in Slovak). Habilitation thesis. Technická univerzita vo Zvolen, 238 p.
Hubacek, M., Kratochvil, V., Zerzan, P., Ceplova, L., and Brenova, M., 2015. Accuracy of the new generation elevation models. In: ICMT2015 International Conference on Military
Technologies 2015. Brno: University of Defence, Faculty of
Military Technology, 2015, pp. 289-294. ISBN 978-80-7231-976-3., doi:10.1109/MILTECHS.2015.7153725.
Hubacek, M., Brenova, M., Ceplova, L., & Zerzan, P., 2014. Verification of accuracy of the new generation elevation models. In: Advances in Military Technology, 2014, vol. 9, no. 2, p. 21-32. ISSN 1802-2308.
Hoskova-Mayerova, Š., Talhofer, V., Hofmann, A., Kubíček, P., 2013. Spatial database quality and the potential uncertainty sources. In: Studies in Computational Intelligence, 448, pp. 127-142, DOI: 10.1007/978-3-642-32903-6-10.
Korf, V., 1953. Dendrometrie (in Czech). Státní zemědělské nakladatelství Praha, 327 s.
Mazal, J., Stodola, P., Hrabec, D., Kutěj, L., Podhorec, M., Křišťálová, D., 2015. Mathematical Modeling and Optimization of the Tactical Entity Defensive Engagement. In: International Journal of Mathematical Models and Methods in Applied
Sciences, vol. 9, no. summer 2015, p. 600-606. ISSN
1998-0140.
Richards, F.J., 1959. A flexible growth function for empirical use. J Exp Bot 10:290–300.
Sloboda, B., 1971. First order differential equations for depicting growth processes (in German) Mitt. Bad. –Württemb. Forstl. Vers. u. Forsch. Anstalt. Heft. 32.
Stodola, P. and Mazal, J., 2015. Tactical Models based on a Multi-Depot Vehicle Routing Problem Using the Ant Colony Optimization Algorithm. International Journal of Mathematical
Models and Methods in Applied Sciences, vol. 9, no. summer
2015, p. 330-337. ISSN 1998-0140.
The International Archives of the Photogrammetry, Remote Sensing and Spatial Information Sciences, Volume XLI-B4, 2016 XXIII ISPRS Congress, 12–19 July 2016, Prague, Czech Republic
This contribution has been peer-reviewed.