SUSTAINABLE AND SMART CITY PLANNING USING SPATIAL DATA IN WALLONIA
N. Stephenne a, *, B. Beaumont a, b, E. Hallot a, E. Wolff b, L. Poelmans c, C. Baltus d
a ISSeP, Remote Sensing and Geodata Unit, 4000 Liège, rue du Chéra, 200, Belgium – (n.stephenne, b.beaumont, e.hallot)@issep.be b
ANAGEO, IGEAT-ULB, 1050 Bruxelles, Av. F.D. Roosevelt, CP 130/03, Belgium – [email protected] c
VITO, Environmental Modelling Unit, 2400 Mol, Boeretang, 200, Belgium – [email protected]
d Service Public de Wallonie - DGO3, 5100 Namur, Av. Prince de Liège, 15, Belgium – [email protected]
KEY WORDS: Smart City, Population Density Mapping, Land Use Mapping, Spatial Modelling, Risk Management, WebGIS.
ABSTRACT:
Simulating population distribution and land use changes in space and time offer opportunities for smart city planning. It provides a holistic and dynamic vision of fast changing urban environment to policy makers. Impacts, such as environmental and health risks or mobility issues, of policies can be assessed and adapted consequently. In this paper, we suppose that “Smart” city developments should be sustainable, dynamic and participative. This paper addresses these three smart objectives in the context of urban risk assessment in Wallonia, Belgium. The sustainable, dynamic and participative solution includes (i) land cover and land use mapping using remote sensing and GIS, (ii) population density mapping using dasymetric mapping, (iii) predictive modelling of land use changes and population dynamics and (iv) risk assessment. The comprehensive and long-term vision of the territory should help to draw sustainable spatial planning policies, to adapt remote sensing acquisition, to update GIS data and to refine risk assessment from regional to city scale.
* Corresponding author
1. INTRODUCTION
The “Smart” management and planning of a city are emerging strategies to mitigate the challenges and strengthen the opportunities caused by urban population growth (2%/yr worldwide (WorldBank, 2014)) and rapid urbanization (Chourabi et al., 2012). Indeed, urbanization is reaching unprecedented levels around the world. Currently, 73% of European citizens are urban and this ratio reaches an even more impressive value in Belgium with 98% (WorldBank, 2014). Urbanization increases pressures on multiple sectors and activities impacting human living, working and natural environments. It also brings opportunities to develop new short- and long-term smart, efficient and sustainable management and planning strategies. Developing reliable and precise land use classes and population distribution datasets for analysing and predicting health and environmental risks, the topic of this paper, refers to these strategies.
Smart city is a new and evolving concept based on innovative information and communication technologies (ICT). It aims to turn challenges related with 21st century urbanization into opportunities for efficient and sustainable management and planning of the urban environments. According to Caragliu et al. (2011), a city is smart when investments in human and social capital as well as traditional (transport) and modern (ICT) communication infrastructure fuel sustainable economic growth and a high quality of life, with a wise management of natural resources, through participatory governance. In this paper, we distinguish three objectives in the smart concept which should be sustainable, dynamic and participative. To be called sustainable, smart city developments should tackle the urbanization related challenges by developing long-term viable, profitable, environmentally friendly and integrated solutions and services that are in agreement with current and future citizens’ needs. To be successful, a smart city initiative has to
depict comprehensively and holistically the urban environment affected by its application (UE, 2015). In a dynamic perspective, the initiative must also remodel the city as a sustainable and viable on the long-term smart ecosystem with spatial, economic, social and governance aspects. Finally, smart city has to be participative in the sense of being built by and for the citizens who must be the main concern of all urban development (Branchi et al., 2014).
Firstly, smart city concept introduces new practices and services for policy making and planning by municipal and regional authorities (Leonidas & Athena, 2012). These multi-scale solutions aim to design a sustainable future and decrease the risks related to population growth and densification. Short and long-term urban planning addresses the relationship between expected population growth and space availability (CPDT, 2015), land use modeling (Zhu & Ferreira, 2015), health and environmental risks (Stephenne et al., 2013), smart industrial planning (Joseph, 2014) and natural resources or financial requirement analysis (for future needs in transport, health or safety infrastructures and services). For risk assessment, the precise location of population, target of pollutions, is one essential aspect that is discussed in this paper.
Secondly, holistic and dynamic visions of fast changing urban environments are essential for city planning. City managers require reliable and frequently updated geospatial data to represent the city. Geospatial data are produced by modern ICT from smart devices, human agents and remote sensing technologies. Many initiatives have proven the usefulness of geospatial data within geographic information systems (GIS) for smart city management: for efficient traffic management (1spatial, 2014), for land suitability analysis (Pettit et al., 2015) or for efficient energy production (Cohen, 2012). However, potential applications and operational use of these data are ISPRS Annals of the Photogrammetry, Remote Sensing and Spatial Information Sciences, Volume IV-4/W1, 2016
constrained by their availabilities, access policies, acquisition and maintenance costs, qualities, heterogeneities and sizes (big data). This paper makes use of existing geospatial data to better understand the dynamic of population and urbanization.
Thirdly, strong citizens’ involvement is essential for successful application of smart city initiatives (Branchi et al., 2014). This implies building participatory planning frameworks before and during the initiative application as well as open access and communication platforms. Web-based applications (WebGIS) and e-Services are key tools for both of these goals (UE, 2015). Concrete initiatives exist (Salvador, 2012).
This paper addresses these three objectives in the context of risk assessment in urbanized environment and in particular in better mapping of population. For holistic city planning, the project focuses on two key geospatial datasets which are essential for city managers: population distribution and land use / land cover (LULC) maps. . The impact of LU classes and population distribution simulations on risks models will be tested at regional scale using various scenarios. For the participatory objective, the research also includes strong potential user’s involvement and communication platforms developments. The existing tools for geospatial data diffusion and web application will help to involve decision makers and potential users.
2. CASE STUDY
2.1 Study area
Belgium is one of the most urbanized (WorldBank, 2014) and densely populated (349 inhabitants/km²; SPF Belge, 2010) countries in the world. Many challenges are impacting living, working and natural environments. For example, Belgium is ranking number one in terms of traffic congestion in Europe (INRIX, 2014). The 2014 Walloon regional environmental monitoring report (Brahy, 2014) states unfavourable values for many key indicators, even deteriorating in the last years (e.g. degree of territory’s artificiality or agricultural space consumption for housing). Local and regional Belgian authorities propose smart development of their territory to answer these environmental issues.
The current research has two integrated study scales: the entire Walloon region (16,844 km²), for population distribution and land use mapping and predicting, and the area surrounding the city of Liege for land use updating. The spatial resolution of 1 ha for planning purposes at the Walloon level is compared to a finer resolution for the city of Liege. Liege is the fourth biggest municipality of Belgium with 198,105 inhabitants in 2013 (Liege, 2013).
2.2 Data context in Wallonia
Spatial planning relies heavily on existing and accessible geospatial data. Access to geospatial data in Wallonia is heterogeneous. A willingness of data dissemination is currently on-going at the regional level to answer to Inspire (2007/2/EC) and PSI (2003/98/EC, consolidated by 2013/37/EU) directives. Walloon authorities have developed a geoportal (WalOnMap (SPW, 2015)) which give access to a large range of datasets. However the land use land cover map of Wallonia (COSW) has not been updated since 2007. The fact that land use changes in Wallonia varied from –1.5% for agricultural land to +6.2% for urbanized land between 2005 and 2014 shows that data update is essential (IWEPS, 2015).
Wallonia, like many other European regions, has a remotely sensed data acquisition framework. Every year a full coverage of aerial photos is ordered, a LiDAR campaign has recently been performed and a Pleiades coverage over the whole region has been acquired. This research makes use of these existing remotely sensed data. Ancillary geospatial and statistical information are integrated in the analysis: LULC maps, zoning plan, protected areas, networks, soil, risks and socio-economic datasets.
3. METHODS
This project aims to be operational in the sense of exploiting existing methods and data rather than developing new algorithms. The literature and data reviews and the consistence with neighbouring regions explain the methodological choices. Each method presented in this section is the result of a research process comparing available techniques and testing new adaptation in terms of data and algorithms, but this project makes use of previous research to integrate the results in a solution including four steps: (i) updating the Walloon LULC map, (ii) disaggregating statistical population figures on this map, (iii) simulating these two maps in the future, and (iv) integrating the population maps inside risk analysis. The methods chosen for this project are summarized in this part and challenges of their application in Wallonia are discussed in section 4. Application of these methods for the Walloon region should help in building smart decision making.
3.1 Detailed land cover/land use mapping
Geographic Object-Based Image Analysis (GEOBIA) has proven to be an efficient method to classify urban fabrics from metric to sub-metric remotely sensed data to derive land cover map (Blaschke, 2010; Carleer et al., 2006, Patino, 2013). LiDAR point cloud creates a 3-D representation of the earth’s surface which is filtered to yield information on height and texture of ground features such as buildings. LiDAR-derived data-sets substantially improve land cover detection in urban environments (Mathieu et al., 2007; Zhou et al., 2009; Dinis et al., 2010; Wurm et al., 2010). Being an active sensor, LiDAR overpasses shadowing issues and reduces classification uncertainties between artificialized surfaces (3D). Very High Resolution (VHR) data can be fused with LiDAR data for building reconstruction (Kim et al., 2014).
In Wallonia, the rule-based GEOBIA approach developed by Van De Kerchove et al. (2015) is being adapted to segment and classify urbanization. This method integrates spectral indices (from Pleiades or aerial photos), LiDAR metrics (normalized Digital Surface Model (nDSM), intensity, point density and standard deviation (Zdev)) and constraints (land cover datasets such as master plan, COSW or NGI). Accuracies will be assessed using confusion matrices based on a large set of stratified random points.
To translate urban land cover into land use, spatial metrics help to characterise and discriminate land use patterns from a land cover map (Herold et al., 2003). Efficient use of fine scale geocoded data on human activities (Mesev, 2005; Aubrecht et al., 2009) also eases the distinction between buildings according to their functions (residential, commercial, industrial, administrative …). For Wallonia application, we propose to integrate socio-economic datasets to the land cover map to translate it to a functional land use map compatible with the COSW in order to update this map.
3.2 Population density mapping
Obtaining a proper cartographic representation of population distribution has been challenging the scientific community since the nineteenth century when the innovative dasymetric technique was popularised by the work of Wright (Petrov, 2012). Dasymetric mapping techniques use ancillary information to distribute population data in meaningful homogenous spatial zones. They have proved to increase the spatial accuracy dramatically (Eicher and Brewer, 2001). Traditionally, population density is mapped based on data provided at administrative units scale by national statistical institutes, showing the density in terms of inhabitants per unit. While these administrative units have various size and shapes, these heterogeneities cause distortions in the spatial analysis. This problem is known by the scientific community as the Modifiable Areal Unit Problem (MAUP). Dasymetric mapping techniques have been applied worldwide to derive gridded, MAUP-free maps of population distribution. To do so, ancillary cartographic information representative of the features’ locations is used. Some examples can be cited like gridded urban population density mapping using night time imagery (Sutton, 1997), the Landscan global population database (Dobson et al., 2000) or the European population map developed by Gallego and Peedell (2001). The last one disaggregated official European population counts into 100m cells using Corine Land Cover (CLC) products. When more detailed ancillary data are available for some specific land use classes such as the impervious areas, a nested approach of the disaggregation protocol can be defined (Batista et al., 2013). Moreover, two resolutions can be integrated in the method if information at finer resolution exists for the urban areas.
In Wallonia, the dasymetric mapping protocols developed by Van Esch et al. (2009) is combined to the grid binary method, originally developed by Langford et al. (1991), in which population figures per administrative unit were assigned to populated land use pixels. Three protocols are compared in terms of feasibility and applicability (1) a standard dasymetric mapping procedure in which population numbers are distributed over different land use classes given a specified weight for each class, (2) an extension of the previous approach in which the weight for each land use class in each region is corrected for deviations of the distribution of the land use class in that region from the distribution of the classes across the entire study area and (3) a multi-resolution dasymetric mapping protocol in which ancillary data with a different resolutions than the output population map can be used.
3.3 Modelling land use changes and population dynamics
Cellular automaton (CA) based models have perhaps been the most popular way to model land use change and spatially-explicit population density (e.g. Li and Yeh, 2000, Caruso et al., 2007, Poelmans and Van Rompaey, 2010, Koomen, 2011) because (1) they are intrinsically dynamic, (2) they have high resolution and thus produce results with useful detail and (3) they outperform other models in realistically modelling land use change (Poelmans and Van Rompaey, 2010). As a consequence, these models are gradually becoming part of decision support systems for the assessment of policies aimed to improve spatial planning and sustainable development (De Nijs et al., 2004).
In this research the constrained CA (CCA) model developed by White, Engelen & Uljee (1997) is applied to the Walloon region. The CCA model has been previously applied for e.g. the
Flemish region (White et al., 2012), the Netherlands (LeefOmgevingsVerkenner) and a number of European urban regions (McCormick et al., 2002; Lavalle, 2009). The RuimteModel Vlaanderen is used in a policy context to analyse land use change mechanisms and to simulate possible land-use changes towards 2050.
3.4 Integrating population map in risk analysis
Since 1990s, early warning systems started incorporating more socio-economic data in vulnerability assessment to identify the susceptibility of individuals or large population to food insecurity (Stephen and Downing, 2001). According to these authors, whatever the concepts of risk, vulnerability, susceptibility or insecurity, the socio-geographic scale is a key issue. Environment and risk prevention are two key themes of EU cohesion since 2006. ESPON project defines the concept of hazard, vulnerability and risk but states that there is a range of differing definition and expression (Schmidt-Thomé and Klein, 2006). Stephenne et al. (2013) models the health risk as an equation multiplying the probability of danger (pollutions in air, soil or water and environmental pressures) with the exposure to human health. This exposure factor includes the population density and the localisation of some vulnerable categories of people.
Smart and sustainable planning needs to address, localize and measure the environmental risks for better development and management. Meteorological hazards that are strongly influenced by human activities and land use (forest fires, floods, landslides …) can be mitigated by better spatial planning. Policy makers need tools to identify the geographic areas where one or several exposure to environmental dangers and pollutions can be observed (Caudeville et al., 2011). Walloon authorities are responsible of managing the citizens’ health and the environmental quality. Understanding the links and interrelation between health and environment is a challenge because of the complexity of the system integrating these two aspects of citizens’ life. Stephenne et al. (2013) built an integrated approach of environmental exposure assessment in cooperation with the Environmental Services of the Walloon region. This simulation model integrates different pollution data to better understand and localise the individual or additive effects of pollution. Combining GIS, multi-criteria decision theory, fuzzy logic, and simulation model creates opportunities to better represent, understand, analyse a system to support the management of this system.
The representation of risks related to human health result from the combination of several maps of environmental pollutions with maps of populations: density and location of vulnerable groups. In Stephenne et al. (2013) paper the density map is the one developed by Gallego and Peedell (2001) with statistical data from 2001 and 2006 CLC map. The population map produced in 3.2 will update this information and provide to Walloon administration their proper method both for population mapping and consequently for risk assessment.
3.5 Participatory planning and communication
Decision making process comprises three major phases: intelligence, design and choice (Andrienko and Andrienko 2003). The intelligence phase involves situation analysis and problem recognition, the design phase involves finding possible variants of problem solution and the choice phase involves evaluation of the options and selection of the most appropriate ISPRS Annals of the Photogrammetry, Remote Sensing and Spatial Information Sciences, Volume IV-4/W1, 2016
ones. Scientists and decision makers need to better communicate to improve the third phase. Going further, scientists could already collaborate with policymakers within the development of their tools in a real participative approach for the two first phases. This integrated approach is attempted in this Walloon project.
Two participatory approaches can be applied in the GIS decision support approach of this Walloon project: the integration of decision makers by WebGIS consultation (Stephenne et al., 2015) and the crowdsourcing of spatial visual analysis (Fritz et al., 2012). Through user-friendly interfaces, WebGIS have improved the way to interact with a broader audience. These tools can now visualize trade-offs between the choices of the different users and to optimize their spatial choices. Interactive visual simulation tools present nearly immediately the alternative scenarios of combining spatial data. Moreover, these participatory tools allow feeding spatial data by editing and improving them. The movement of voluntary geographical information (VGI) provides extensive tools to increase the citizen participation and optimize the quality of their inputs (Fritz et al; 2012). The use of these tools within a network of stakeholders could promote better communication between scientists and regional or local decision-makers in the objective of a smart city or region.
This project was thought to answer specific needs expressed by Walloon local and regional authorities. To guaranty the close link with these direct and indirect users, the project includes a continuous users’ requirement analysis (survey and meetings), regular interactions with an implementation group and the development of users-friendly participatory, coaching and communication tools (WebGIS).
4. RESULTS AND DISCUSSION
Results obtained by the methods proposed in the third section are seen as sufficiently efficient for a Walloon application from LULC and population mapping to simulation. The risk modelling doesn’t integrate already the results of the previous part. This section discusses the improvements steps needed for the Walloon application and the first results in each part of the solution.
4.1 Detailed land cover/land use mapping
Van De Kerchove et al. (2015) mapped impervious/urbanized surfaces in a 186 km² rural area in Wallonia. Rule-based GEOBIA provides similar or higher global accuracy but better visual results than pixel-based and automated GEOBIA classification approaches (figure 1).
Figure 1. Classification methods: accuracies and illustrations (Van De Kerchove et al., 2015)
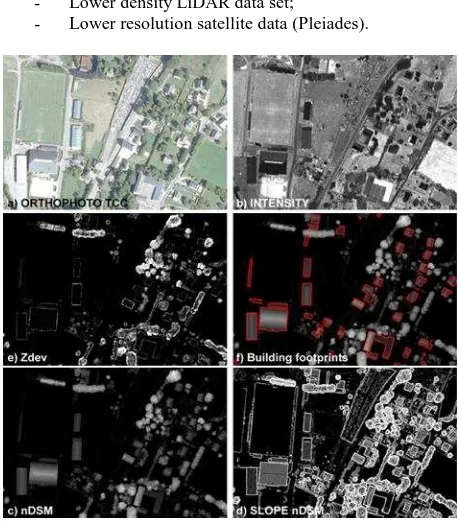
This research aims at updating the COSW map using existing GIS data, very high resolution aerial photos (4-bands and NDVI) and LiDAR metrics (intensity, nDSM, slope nDSM, Zdev and building footprints) (figure 2). The following challenges are considered:
- Urban vs rural areas classification;
- Morphological differences between urban fabrics; - Lower density LiDAR data set;
- Lower resolution satellite data (Pleiades).
Figure 2. LiDAR metrics used (Van De Kerchove et al., 2015)
4.2 Population density mapping
The application of the dasymetric mapping method (Van Esch et al. 2009, Engelen et al., 2011) for Wallonia (figure 3) aims to obtain homogeneous and complete coverage of population data for Belgium. Population census data are provided by Statbel at the same statistical sector scale in the 3 regions of Belgium. The main challenge in Wallonia is the adaptation of existing LU map to the protocol and then defining the LU classes cross semantic between the VITO land use map for Flanders (Van Esch et al., 2011) and the COSW map from 2008 in Wallonia.
Figure 3. First prototype of dasymetric population map for 2014 at 1 ha of Wallonia (Hallot et al., 2016)
4.3 Modelling land use changes and population dynamics
The RuimteModel Vlaanderen (De Kok et al., 2012) is based on three hierarchically embedded levels: the macroscopic, global level (Brussels and Flemish regions), the regional level (EU-NUTS3 entities), and the local, cellular level consisting of a matrix of individually modelled cells at 1 ha resolution. Ran over the period 2010-2050 (figure 4), the model allows estimating land use change and population dynamics.
Figure 4. Preliminary results of land use change between 2010 and 2050 in Wallonia
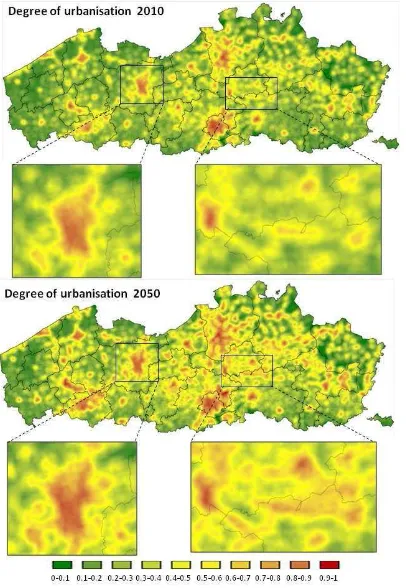
Figure 5. Degree of urbanisation 2010 vs 2050 (Engelen et al., 2011)
The model is constrained by global and regional trends regarding for instance employment (Desmet et al., 2008) or population structure (Maene, 2011). By applying different scenarios at the global and/or regional level, different land use change patterns can be simulated.
To apply this model in Wallonia it has been fed with the best available spatial and regional data and calibrated in order to mimic the specific Walloon context of land use change. However, data availability, quality and up-to-date status affect results’ quality. The final model will be used to simulate possible future land use change patterns and to obtain spatial environmental indicators that can be used for planning purposes (e.g. degree of urbanisation or urban pressure on agricultural land) (figure 5).
Furthermore, the method is envisaged to be refined to a city scale. This can be done by implementing an extra scale level in the CCA model. At this extra level results from the NUTS3 entities are further downscaled to the municipal level before being further disaggregated to the local (1ha) scale. Moreover, sub-pixel information can be used to further detail the simulated land use patterns at the 1ha spatial level to the level of individual building blocks or to a finer raster resolution.
4.4 Integrating population map in risk analysis
The risk model is under continuous development. Stephenne et al. (2013) illustrated the methodology and first results of this modelling exercise. The feasibility phase ends up with some initial simulation maps. But as human health is a sensitive aspect in regional management, results need the agreement of responsible authorities before diffusion to the population. Considering this, figure 6 a, b and c below do not refer to the reality of the danger and exposure but rather illustrate the integration of existing data to point out methodological, data or conceptual issues in the model. The similar pattern between population (density and vulnerable groups) and risk maps (figure 6 b and c) illustrates the impact of the MAUP problem. The socio-economic zones referring to the spatial pattern of economic vulnerability are only available at the level of the commune units. This dataset has a large impact on the aspect of the final result. This model will be fed and improved by better definition of targets with the population density map.
Figure 6. a, b and c: pollutions (a), populations (b) criteria and (c) health risk model related to environment in Wallonia
4.5 Participatory planning and communication
SmartPop project gather Walloon local and regional authorities needs through a survey, interviews and meetings. Their involvement in the research process consists in three aspects: (i) ISPRS Annals of the Photogrammetry, Remote Sensing and Spatial Information Sciences, Volume IV-4/W1, 2016
identification of issues in existing datasets and models, (ii) precision of evolving challenges in decision making needs and (iii) validation of their interest in the project outputs use. First feedbacks helped in identifying the LULC mapping and updating methodologies and in defining the semantic and geometric requirements for the desired products. A continuous involvement of these players is planned throughout the project with full access to reports and publications, regular meetings with the implementation group and the development of user-friendly, coaching and communication tools such as WebGIS.
5. DISCUSSIONS AND CONCLUSIONS
By making use of all existing geospatial data, detailed land cover and land use mapping provide a holistic and dynamic vision of the fast changing environment and contribute to a smart spatial management of the region and the city. By providing tools to simulate different scenarios of future changes in land-use, the project supports the authorities for smart, dynamic and sustainable planning. This sustainable future should assess the risks related to population growth in order to reduce or mitigate these risks for the citizens. Current and predicted population density maps will strengthen risks models values in Wallonia:
- Better estimates of current risks
- Better policies making and sustainable spatial planning
- Better long term and dynamic risk management The results presented in this paper will be compared to previous simulation to prove their adding value. However, first results of the risks maps illustrate the issues of the MAUP and future research should be carried out to increase the spatial quality of socio-economic vulnerability in the model.
This project makes use of existing ICT and scientific methods to have a common spatial planning model in Wallonia and Flanders. A national land-use change model is seen as a key asset for sustainable spatial planning. Homogenizing risks studies between regions is intended since natural hazards are not stopped by regional borders. However, model replication from one region to another is not straightforward. First of all different modelling goals, and geographical and social-economic contexts create a need for different parameter sets and scenarios. Secondly, availability, limited access, quality or semantic differences in existing data induce some model adaptations such as calibration, parameters and/or validation phases. Finally, knowledge of local and regional LU processes is required.
Participatory planning is a key factor for Smart City initiative success. As this project aims at developing tools for better decision support by the authorities for the citizens, this research wants to actively integrate users’ opinions and needs in the development and application processes. To do so, potential end users have already been contacted, some will be included in the project’s implementation group and some will even be included as project’s partners, such as the city of Liege or the SPW.
Geospatial data valorisation requires more than scientific and local media publications. City managers and planners, as well as citizens, must appropriate the results. Visualisation through dedicated or already existing web application is then a mandatory goal of this project. Opportunities such as integration of the maps produced inside of existing geoportal (WalOnMap, City of Liège) as well as use of these data for regional environmental monitoring (Brahy, 2014) will be taken
if presented. The consortium has already a deep experience in such kind of valorisation.
However, smart cities tools cannot be restricted to the spatial planning tools proposed in this paper. Smart management of urbanization should make use of various ICT tools in energy savings, in transport, in communication for a better quality of life. This paper only addresses a small aspect of population growth management by a better spatial planning using earth observation data and GIS.
ACKNOWLEDGEMENTS
Data and results presented in this paper were obtained from ULB (M. Strale, R. Van de Kerchove and E. Wolff), VITO (L. Poelmans and G. Engelen), IWEPS (J. Charlier), city of Liège (M. Duc) and SPW (C. Baltus). This project is funded by ISSeP call of project making use of the Moerman act budget.
REFERENCES
1spatial, 2014. Le petit livre des Smart Cities. http://1spatial.com/be/campaign/smartcities/.
Andrienko, N., Andrienko, G., Gatalsky, P., 2003. Exploratory spatio-temporal visualization: an analytical review. Journal of Visual Languages and Computing. 14(6), pp. 503-541.
Aubrecht, C., Steinnocher, K., Hollaus, M., Wagner, W., 2009. Integrating earth observation and GIScience for high resolution spatial and functional modeling of urban land use Computers. Environment and Urban Systems, 3, pp. 15-25.
Batista Silva, F., Gallego, J., Lavalle, C., 2013. A high-resolution population grid map. Journal of Maps, 9, pp. 16-28.
Blaschke, T., 2010. Object based image analysis for remote sensing. ISPRS Journal of Photogrammetry and Remote Sensing, 65, pp. 2–16.
Brahy, V. et al., 2014. Key Environmental Indicators for Wallonia in 2012 (KEIW), State of the Environment Directorate, SPW - DGO3 - DEMNA – DEE available online http://etat.environnement.wallonie.be/.
Branchi, P., Fernández-Valdivielso, C., Matias, I., 2014. Analysis Matrix for Smart Cities. Future Internet, 6(1), pp. 61– 75. http://doi.org/10.3390/fi6010061.
Caragliu, A., Bo, C. Del, & Nijkamp, P., 2011. Smart cities in Europe. Journal of Urban Technology, 18(2), pp. 65–82. Carleer, A.P., Wolff, E., 2006. Urban land cover multi-level region-based classification of VHR data by selecting relevant features. International Journal of Remote Sensing, 27(5-6), pp. 1035-1051.
Caruso, G., et al., 2007. Spatial configurations in a periurban city: a cellular automata-based microeconomic model. Regional Science and Urban Economics, 37, pp. 542–567.
Caudeville, J., G.G., Bonnard, R., Blanchard, O., Ung, A., Bessagnet, B., Cicolella, A., 2009. Construction d’un indicateur d’exposition spatialisé de l’environnement. Air Pur 76, pp. 49-55.
Chourabi, H., Nam, T., Walker, S., Gil-Garcia, J. R., Mellouli, S., Nahon, K., et al., 2012. Understanding Smart Cities: An Integrative Framework. The 45th Hawaii International Conference on System Sciences, pp. 2289 - 2297.
Cohen, B., 2012. The top 10 smartest cities in North America. Co.Exist. http://www.fastcoexist.com/1680967/the-top-10-smartest-cities-in-north-america#1. Accessed December 9, 2012.
CPDT, 2015. Vers un plan de secteur durable. Indice de durabilité résidentielle : analyse multi-critère. Notes de recherche. Juin 2015, pp. 1-46.
CPB, MNP, RPB, 2006. Welvaart en Leefomgeving, een scenario studie voor Nederland in 2040 (Welfare, Prosperity and Quality of the Living Environment, A scenario study of the Netherlands in 2040). Centraal Planbureau, Milieu Natuurplanbureau, Ruimtelijk Planbureau, Nederland. In Dutch. www.welvaartenleefomgeving.nl.
De Kok, J., Poelmans, L., I., Engelen, G., Uljee, I., Van Esch, L., 2012. Spatial-dynamic visualization of long-term scenarios for demographic, social-economic and environmental change in Flanders. In: R. Seppelt, A.A. Voinov, S. Lange, D. Bankamp (Eds.) Proceedings of the 2012 International Congress on Environmental Modelling and Software, Leipzig, Germany.
De Nijs T., De Niet R., Crommentuijn L., 2004. Constructing land-use maps of the Netherlands in 2030. Original Journal of Environmental Management, 72, pp. 35-42.
Desmet, R., Hertveldt, B. Mayeres, I. Mistiaen, P. and Sissoko, S., 2008. The PLANET Model: Methodological Report, PLANET 1.0, Working Paper 10-08, Federal Planning Bureau, Brussels.
Dobson et al., 2000. Landscan: A Global Population Database for Estimating Populations at Risk. Photogrammetric Engineering & Remote Sensing, 66, pp. 849-857.
Dinis, J., Navarro, A., Soares, T., Santos, T., Freire, S., Fonseca, A., Afonso, N., Tenedório, J., 2010. Hierarchical object-based classification of dense urban areas by integrating high spatial resolution satellite images and Lidar elevation data. In: Proceedings of GEOBIA 2010 – Geographic Object Based Image Analysis, Ghent, Belgium, 29 June-20 July 2010.
Eicher, C. L., Brewer, C. A., 2001. Dasymetric mapping and areal interpolation: Implementation and evaluation. Cartography and Geographic Information Science, 28, pp. 125–138.
Engelen G., C. Lavalle, J. I. Barredo, M. van der Meulen and R. White, 2007. The MOLAND modelling framework for urban and regional land-use dynamics, in: Modelling Land-Use Change. Progress and Applications, edited by: E. Koomen, J. Stillwell, A., Bakema, H., Scholten, J. Springer, The Netherlands, pp. 297-320.
Engelen, G., Van Esch, L., Uljee, I., de Kok, J., Poelmans, L., Gobin, A., van der Kwast, H., 2011. RuimteModel: Ruimtelijk-dynamisch landgebruiksmodel voor Vlaanderen. Steunpunt Ruimte en Wonen, 2011/RMA/R/242.
Fritz, S., McCallum, I., Schill, C., Perger, C., See, L., Schepaschenko, D., van der Velde, M., Kraxner, F., and
Obersteiner, M., 2012. Geo-Wiki: An online platform for improving global land cover. Environmental Modelling and Software, 31, pp. 110-123.
Gallego, F. J., Peedell, S., 2001. Using Corine Land Cover to map population density. In European Environment Agency. “Towards agri-environmental indicators: Integrating statistical and administrative data with land cover information”. Copenhagen, pp. 94–105.
Hallot, E., Poelmans, L., Uljee I., Beaumont, B., Stephenne, N., 2016. Localiser la population urbaine pour optimiser la gestion du territoire. Acte de colloque des 34èmes Rencontres Universitaires de Génie Civil de l'AUGC, Liège, Belgium 24 - 27/05/2016.
Herold, M., Goldstein, N.C., Clarke, K.C., 2003. The spatiotemporal form of urban growth: measurement, analysis and modeling, Remote Sensing of Environment, 86, pp. 286– 302.
IIED, 1995. A Trainers Guide for Participatory Learning and Action. IIED Participatory Methodology Series, pp. 1-267, London, UK.
INRIX, 2014. Urban Mobility Scorecard Annual Report. http://inrix.com/scorecard/. Accessed September 2015.
IWEPS, 2015. Statistiques - http://www.iweps.be/. Accessed September 2015.
Joseph, T., 2014. Smart City Analysis Using Spatial Data and Predicting the Sustainability, 12(1).
Kim, Y., 2014. Improved Classification Accuracy Based on the Output-Level Fusion of High-Resolution Satellite Images and Airborne LIDAR Data in Urban Area. IEEE Geoscience and Remote Sensing Letters 11, pp. 636–640.
Koomen, E., Borsboom – van Beurden, J., 2011. Land-Use Modelling in Planning Practice. Dordrecht, Heidelberg, London, New York: Springer.
Leonidas, A., Athena, V., 2012. Urban Planning and Smart Cities : Interrelations and Reciprocities. In. F. Alvarez et al. (Eds.): FIA 2012, LNCS 7281, pp. 178-189, 2012.
Langford, M., Maguire, D., Unwin, DJ., 1991. The areal interpolation problem: estimating population using remote sensing in a GIS framework. In: Masser I, Blakemore M. (eds) Handling Geographical Information: Methodology and Potential Applications, Longman, New York, pp. 55-77.
Lavalle, 2009. Modelling urban growth. Presentation from Joint Research Centre.
Lemma, T., et al., 2005. A Participatory Approach to Monitoring Slum Conditions. In International conference on participatory spatial information management and communication, 7-10 September, Nairobi, Kenya.
Liège, 2015. Statistiques - http://www.liege.be/. Accessed September 2015.
Li, X., Yeh, A., 2000. Modelling sustainable urban development by the integration of constrained cellular automata and GIS. International Journal of Geographical Information Science, 14, pp. 131–152.
Maene, S., 2011. Nieuwe Bevolkingsprojecties en huishoudensprojecties 2009-2030 Studiedienst Vlaamse Regering – Een vergelijking met projecties Federaal Planbureau 2007-2060 gebruikt in Milieuverkenning 2030.
Mathieu, R., Aryal, J., Chong, A. K., 2007. Object-Based Classification of Ikonos Imagery for Mapping Large-Scale Vegetation Communities in Urban Areas. Sensors, 7, pp. 2860-2880.
McCormick, N., Critchkley, M., Lavalle, C., Kasanko, M., Demicheli, L., Barredo, J., Engelen, G. 2002. Mapping and modelling the impact of land use planning and management practices on urban and peri-urban landscapes in the greater Dublin area, pp. 1-4.
Mesev, V., 2005. Identification and characterization of urban building patterns using IKONOS imagery and point-based postal data Computers, Environment and Urban Systems, 29, pp. 541-557.
Patino, J.E., Duque, J.C., 2013. A review of regional science applications of satellite remote sensing in urban settings. Computers, Environment and Urban Systems, 37, pp. 1-17.
Petrov, A., 2012. One Hundred Years of Dasymetric Mapping: Back to the Origin. The Cartographic Journal, 49, pp. 256-264.
Pettit, C., Barton, J., Goldie, X., Sinnott, R., Stimson, R., Kvan, T., 2015. The Australian Urban Intelligence Network Supporting Smart Cities. In S. Greetman et al. (eds.), Planning Support Systems and Smart Cities, Lecture Notes in Geoinformation and Cartography, pp. 243-259. DOI 10.1007/978-3-319-18368-8_7
Poelmans, L., Van Rompaey, A., 2010. Complexity and performance of urban expansion models. Computers, Environment and Urban Systems, 34(1): pp. 17-27.
Salvador, A., 2012. Smart Citizen is a platform to empower participatory processes of people in cities. https://smartcitizen.me/. Accessed September 2015.
Schmidt-Thomé, P., Klein, J., 2006. INTERACT-ESPON thematic study on environmental hazards and risk management. Final report, pp. 1-63.
Service Public Fédéral Belge, 2010. Portail belgium.be. http://www.belgium.be/fr/la_belgique/connaitre_le_pays/Popula tion/. Accessed September 2015.
Stephen, L., Downing, T., 2001. Getting the scale right: a comparison of analytical methods for vulnerability assessment and household-level targeting. Disasters. 25(0): pp. 113-135.
Stephenne, N., Remy, S., Eloy, S., Stassen, F., Defoux, J., 2013. A Walloon spatial simulation model of risks in Environment and Health. pp. 1-12 (not published).
Stephenne, N., Beaumont, B., Veschkens, M., Tigny, V., Goossens, R., Hemroulle, P., 2015. Risk of spontaneous combustion in Belgium mining waste deposits. Talk at EARSeL 2015.
SPW, 2015. Géoportail de la Wallonie – WalOnMap. http://www.geoportail.wallonie.be/WalOnMap/. Accessed September 2015.
Sutton, P., Roberts, D., Elvidge, C., Meij, H., 1997. A Comparison of Nighttime Satellite Imagery and Population Density for the Continental United States. Photogrammetric Engineering and Remote Sensing, 63, pp. 1303-1313.
UE, 2015. https://eu-smartcities.eu/blog/how-build-sustainable-cities-roadmap-mayors-city-managers-and-city-councils. Accessed September 2015.
ULg, 2014. Smart City Institute. http://labos.ulg.ac.be/smart-city/. Accessed September 2015.
Van De Kerchove, R., Strale, M., Hanson, E., Wolff, E., 2015. Cartographie des surfaces imperméables en Wallonie - CASIM. Rapport final Mars 2015, pp. 1-69.
Van Esch, L., Vos, G., Janssen, L., Engelen, G., 2009. The Emission Inventory Water: a planning support system for reducing pollution emissions in the surface waters of Flanders, in: Planning Support Systems: Best Practices and New Methods, edited by: Geertman S. and Stillwell J., Springer.
Verburg, P.H., Rounsevell, M., Veldkamp, A., 2006. Scenario-based studies of future land use in Europe. Agriculture, Ecosystems & Environment, 114, pp. 1-6.
White, R., Uljee, I., Engelen, G., 2012. Integrated modelling of population, employment, and land-use change with a multiple activity-based variable grid cellular automaton. International Journal of Geographical Information Science, 26(7): pp. 1251-1280.
White, R., Engelen, G., 2000. High-resolution integrated modelling of the spatial dynamics of urban and regional systems. Computers, Environment and Urban Systems, 24(2000), pp. 383-400.
Wisner, B., 2006. Self-assessment of coping capacity: Participatory, proactive, and qualitative engagement of communities in their own risk management. In: Birkmann, J. (Ed.) Measuring Vulnerability to Na tural Hazards, United University Press, 316-328.
WorldBank, Urban population growth (annual %), 2015. http://data.worldbank.org/indicator/SP.URB.GROW/countries/1 W?display=graph. Accessed September 2015.
WorldBank, Urban population 2014 (% of total), 2015. http://data.worldbank.org/indicator/SP.URB.TOTL.IN.ZS. Accessed September 2015.
Wurm, M., Taubenböck, H., Schardt, M., Esch, T., Dech, S., 2010. Object-based image information fusion using multisensor earth observation data over urban areas. International Journal of Image and Data Fusion 2, pp. 121-147.
Zhou, W., Huang, G., Troy, A., Cadenasso, M. L., 2009. Object-based land cover classification of shaded areas in high spatial resolution imagery of urban areas: A comparison study. Remote Sensing of Environment, 113, pp. 1769-1777.
Zhu, Y., Ferreira, J., 2015. Data Integration to Create Large-Scale Spatially Detailed Synthetic Populations. In S. Greetman et al. (eds.), Planning Support Systems and Smart Cities, Lecture Notes in Geoinformation and Cartography, pp. 121-141. DOI 10.1007/978-3-319-18368-8_7.