ALARMING SYSTEM FOR SHIFTING WILD ANIMALS FROM FOREST DURING FLOOD
USING DTED AND FINITE NUMERICAL METHODS
Rakesh K. Arya
Sr. Resource Scientist, Madhya Pradesh Council of Science and Technology, Bhopal, India, 462003, Email: [email protected]
KEY WORDS: MATLAB, DTED, Alarming System
ABSTRACT:
The paper presents a methodology to develop a three dimension model of any area using DTED data and mapping toolbox of MATLAB. This three dimension model is further use to calculate the volume from minimum bottom level using finite numerical methods and hence to classifying the area based on level and volume of water occupying upto particular level. This data is used to create the alarming system for shifting of wild animals from area based on volume and elevation data during flood. Further based on these results, areas are determined which are going to flood if water comes either through rain or through Tsunami.. Simulations are performed to compare the results between mathematical formulations and numerical methods.
1. INTRODUCTION
World wide Increments in Natural Disasters are one of the signals of unplanned development done by human being for their own interest without taking care of balancing Enviourment. Few well known natural disasters includes: Earthquake, Volcano Eruption, Flood, Tsunami, Landslides, Avalanches, Hailstorms, Cyclone, Draught etc .(P. S. Roy, 2011). Based on the intensity and nature, many new nomenclatures of natural disaster are hearing now days like Cloud Bursting, Laila, etc. Out of various types of natural disasters exists, Flood is most affecting one. It affects the life of human being, animals, birds, insects, water creatures and almost all living things of flooded area. It not only affects for time being rather it effects the life cycle of human being starting from agriculture to road and communication networks. One positive thing associate with flood is that, with the help of advance technology one can predict area going to flooded in near future and plan for rehabilitations of human being. India is the worst flood affected country in the world after Bangladesh and account one fifth of global death count due to flood. Around 40 million hectare of land in the country are subjected to flood according to National Flood Commission and average of 18.6 million hectare (P. S. Roy, 2011). One of the negative thought associate with flood is that people is more caring for rehabilitation of human being only not other components of eco cycle like land and water animals, birds etc.
Digital Terrain Elevation Data (DTED) is a well known terminology for researcher in the field of Remote sensing and widely used for 3D modelling of an area, implementing 3D GIS etc. Today it is freely available from various resources on different levels, resolutions and format. Few of the sources of these data are: NGA raster room, USGS website on DTED, DEM, DEM24K, ETOPOc, ETOPO2-2001 and ETOPO5, GTOPO30, SATBATH, SDTS DEM, TBASE, SRTM and many other formats (Mapping toolbox manual of Matlab). One can use the format, resolution and level based on their needs.
DTED data are used for different types of research work by many researchers. In (Fern A Musavi M. T., Miranda J., 1997), Auto-matic extraction of drainage networks is obtained from digital
ter-rain elevation data using Artificial Neural Network and local net-work approach. (Fountain J. R., 1997), explain a Digital Terrain System for measurements of the aircraft's dynamics and height above the ground, to provide navigation and terrain referenced cues. (Hofer M., et. al. 2006), proposed a methodology for Fair polyline networks for constrained smoothing of digital terrain. In (Louis A. Fatale, et. al.), the Impact of Digital Terrain Elevation Data Resolution on Terrain Visualization is studied and con-cluded that the resolution play a vital role. (Masavi M. et. al. 1999) use the DTED data for Knowledge based extraction of ridge lines. In (Stevens M. R., et. al. 2004), The DTED files are used for Motion imagery navigation. Finite Numerical methods are well known mathematical tools for calculating volume of irre-gular shapes. One of the techniques to estimate the volume of ir-regular surfaces is Simpson trapezoidal method in three dimen-sions (Grewal B. S., 2010). In this method overall irregular surface is consider to be divided into small pieces of volume as a piecewise linear, calculating the volume for that, when integrating the volume of these volumes gives consolidated volume of entire surface.
Matlab is a well known software tool to implement almost most mathematical model (Matlab Manual R2011a). It not only support the particular area of specialization via its toolboxes rather it sup-port to integrate different interdisciplinary tools like Finite Me-thods, Genetic Algorithm, Fuzzy, Neuro, Wavelet, Pattern Rec-ognitions etc. It is being popular among many researchers since past 15 years. The work presented in this paper is an integration of mapping toolbox of Matlab with Finite Element tools.
ISPRS Archives XXXVIII- 8/W20; Workshop Proceedings: Earth Observation for Terrestrial Ecosystems 2. STATEMENT OF PROBLEM
2.1 Area of Interest and DTED Files
DTED files of any satellite contain the set of files for maximum elevation, minimum elevation and average elevation of an area in digital domain. Further it is available in many resolutions and projections. Mapping toolbox of MATLAB also contains some DTED files and terrain model. One of such set of data is Korea DTED files considered for studies for this paper. The aerial view of this area is shown in Figure 1. These files are available in Orthorectified form to eliminate the projection problem. The resolution of this data is 1106 meters.
Figure 1: DTED Files of Korea
As per the colour bar of Fig. 1, the cyan colour of above figure shows sea with low depth, while dark blue shows the deepest part of sea, similarly the dark green colour shows the plain areas with low altitude, while the deep brown colour patches shows the highest mountain of altitude in the range of 1800 meters.
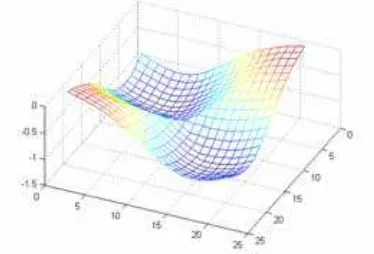
Figure 2: Three dimensional model from DTED files. 2.2 Three Dimension Model from DTED Files
Using the mapping toolbox of Matlab, a 3D model of DTED file is plotted with mesh of the four neighbouring pixel for better visualization as shown in Figure 2. This surface contains an asymmetrical up and down based on topology of the surface. 2.3 Elimination of Underwater Terrain
The three dimensional model of DTED files shows both undersea terrain as well as plateau, hills and mountain. The surface that we are interest for study is above sea level, hence this should be eliminated from three dimensional model as shown in Figure 3.
Figure 3: Irregular Surface above Sea Level from DTED. The elevation of surface considered for study varies from 0-1800 meters while in the case of worst flood or in the case of Tsunami from sea the maximum probability of increasing water level considered is upto 100meters. Hence in the proposed study, the water level considered is ranged from (0-100) meters from sea level and this range is further divided in to four sublevels as below:
Minor increase in water Level: (0-10) meters Mild increase in water level: (10-30) meters Alarming increase in water level: (30-60) meters Critical increase in water level: (60-100) meters
………..(1) 3. PROPOSED METHODOLOGY
3.1 Finite Numerical Methods for Irregular Surfaces
Finite Numerical Methods are one of the tools to calculate the area / volume of nonlinear surface. In these techniques, overall irregular / nonlinear surface is considered to be piecewise linear of small segment. For visualization purposes, let a small piece of nonlinear surface is taken from Figure 3 as shown in Figure 4.
Figure 4: An Example of Nonlinear surface.
extending one piecewise linear grid having coordinated of four points with A. B, C and D as shown in Figure 5.
Figure 5: Partition of Volume into Small Grids. 3.2 Estimation of Volume of a Grid
As explained in preceding sections, overall volume above of surface upto certain level is determined by integration of tiny grids as shown in Figure 5. The two dimensional figure of grid is shown in Figure 6.
Figure 6: Two dimensional representation of Grid.
Consider a grid made from points having different elevation as shown in Figure 6 as A, B, C, and D. the volume of grid is to be measured upto level h. The volume of grid consist of two parts
V1, and V2. Volume of grid between level A and A’ is easily calculated as V1 by:
Volume (V1)=l×l×minimum (A, B, C, D) (2)
Calculation of Volume (V2) is quite tedious when all the four points are having different elevations. For this, among four elevation points (A, B, C and D) let us arranged in increasing order as (A1, B1, C1 and D1). As the width of grid is tiny, we are approximating the average elevation points between two middle elevations (B1 and C1). Now Considering volume V2 as get the
shape of triangle with height of difference of maximum and minimum elevation.
Volume (V2)=0.5×l×average (B1, C1)×difference(A1,D1
+0.5×l×l × difference((B1,C)-D1 (3)
Volume of Grid= l×l×minimum (A, B, C, D)+
0.5×l×average (B1, C1)×difference(A1,D1)
+0.5×l×l × difference((B1,C)-D1
(4)
• When all points are having Same Elevation:
Volume of Grid= l×l× (A/ B/ C/ D) as difference is zero
(5)
• When two points are having Same Elevation:
Volume of Grid= l×l×minimum (A, B, C, D)+
0.5×l×average (B1, C1)×difference(A1,D1) (6)
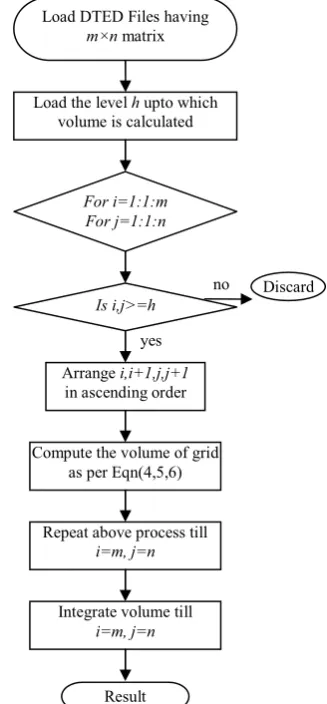
3.3 Algorithm and Flow Chart
The flow chart representation of methodology discussed, formulation used is pictorially shown in Fig. 7.
Figure 7: Flow Chart Representation of Methodology.
Load DTED Files having
m×n matrix
Load the level h upto which volume is calculated
For i=1:1:m For j=1:1:n
Is i,j>=h
yes
no
Arrange i,i+1,j,j+1 in ascending order
Compute the volume of grid as per Eqn(4,5,6)
Repeat above process till
i=m, j=n
Integrate volume till
i=m, j=n
Result
Discard
B C
D
A A
A’ B’ C’ D’ E’
l
h
V1
ISPRS Archives XXXVIII- 8/W20; Workshop Proceedings: Earth Observation for Terrestrial Ecosystems 4. SIMULATIONS
Based on the methodology discussed, approximations considered and formulations done, simulations are performed for calculation of volume of water upto level considered in Equation (1). The DTED data considered for simulations are having m×n matrix where m=2000 and n=1500 element. In other sense, the area of interest is latitude [30oN-45oN] and longitude [115oE-135oE] or 20o for Longitude and 15o for Latitude and the data we are using contains 2000 elevation points against 20o and 1500 elevation points against 15o. At these locations of globe the approximate distance for one degree is 110.6 Kms. Hence, the resolution of data is 1106 meters. The simulations are performed in Matlab environment.
5. RESULTS AND DISCUSSIONS
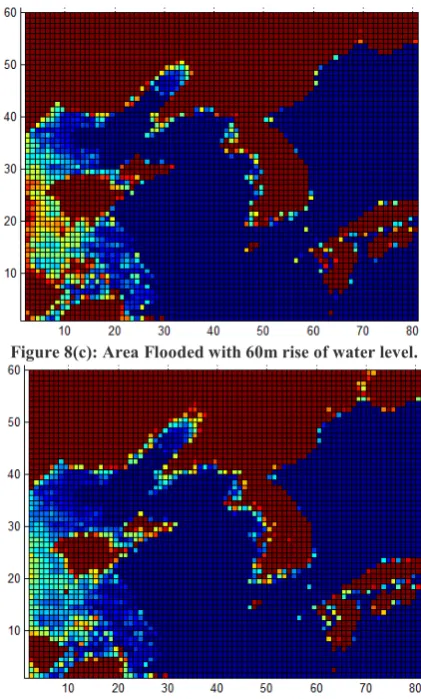
The Simulation results for rising of water level upto level of 10, 30, 60 and 100 meters and volume of water occupied is shown in Table-1. The areas going to flooded when water level increases to 10, 30, 60 and 100 meters are shown in Figure 8(a), (b), (c) and (d) respectively.
The area going to be flooded when 10 and 30 meters rise of water is also useful for arrival of Tsunami, because all those areas are coastal in nature and tsunami waves may contains height of 10-30 meters.
TABLE-1: Volume Vs Level S. No Level in Meters Volume in Cubic
meters
1 10 3.6484 lac
2 30 8.356 lac
3 60 26.498 lac
4 100 385.76 lac
Figure 8(a): Area Flooded with 10m rise of water level.
Figure 8(b): Area Flooded with 30m rise of water level.
Figure 8(c): Area Flooded with 60m rise of water level.
Figure 8(d): Area Flooded with 100m rise of water level.
6. ALARMING SYSTEM
coastal in nature. Using this data the alarming system can be established for shifting wild animals from forest going to flooded. The latitude and longitude of areas going to flooded while increase of water level can be obtained from simulations. This maximum elevation points for 10, 30, 60 and 100 meters rise can be used to establish an radio frequency based sensor to alarm the people responsible for shifting wild animals.
7. CONCLUSIONS
The paper presents methodology for developing an alarming system to rehabilitate the life associated with area going to flooded when particular level of water is increased. The mathematical formulations done for calculation of volume upto particular level provided the planner as estimated time for rehabilitation of life associated. Although, the area of interest taken for study is very wide due to the limitations of compatibility of DTED files in Matlab Enviourment, However, the methodology developed if applied to small area with high resolution elevation data, the outcomes will be really beneficial for planner. The paper presents the novel combinations of DTED, MATLAB and Finite Methods.
REFERENCES
Fountain J. R., (1997), Digital terrain systems, IEE Colloquium on Airborne Navigation Systems, pp 4/1 - 4/6.
Grewal B. S., Khanna, Engineering Mathematics, Khanna Publi-cation New Delhi, Vol 3, Chapter-Numerical Methods
Hofer M., Sapiro G., Wallner J., (2006), Fair polyline networks for constrained smoothing of digital terrain, IEEE Transactions on Geoscience and Remote Sensing Vol. 44 , Issue:10 pp 2983 – 2990.
Image Processing toolbox Manual of Matlab, R2011a, pp 1-1247, www.mathworks.com/help/toolbox/map
Louis A. Fatale, James R. Ackeret, Impact of Digital Terrain Ele-vatin Data Resolution on Terrain Visualization: Simulation Vs. Reality, Proceedings on ISPRS / XXIX / Congress/ part4/ pp, 938 Mapping toolbox Manual of Matlab, R2011a, pp 1-1486 www.mathworks.com/help/toolbox/map
Masavi M., Natarajan P., Binello S., McNeely J. (1999); Knowledge based extraction of ridge lines from digital terrain elevation data, Proceeding on IEEE International Symposium on Geosciences and Remote Sensing, Vol 5, pp 1272-1274.
Musavi, Fern A and M. T., Miranda J., (1997), Automatic extraction of drainage networks from digital terrain elevation data a local network approach, IEEE International Conference on Neural Network, Vol 3, pp 1512 – 1517.
Roy, P. S. Remote Sensing Applications, Chapter-6, Flood Disas-ter Management, pp 283-302.
Stevens M. R., Snorrason M., Eaton R. McBride J., (2004), Motion imagery navigation using terrain estimates, Proccedings of the ICPR 17th International Conference on Pattern Recognition, vol-4, pp 272-275.