SUBDIVISION OF PANTANAL QUATERNARY WETLANDS: MODIS NDVI
TIME-SERIES IN THE INDIRECT DETECTION OF SEDIMENTS GRANULOMETRY
N. C. Penatti a,* & T. I. R. de Almeida a
a
Institute of Geoscience, University of São Paulo, Rua do Lago, 562 - São Paulo - Brasil (natasha.penatti, talmeida)@usp.br
Commission VIII, WG VIII/6
KEY WORDS: Vegetation, MODIS, Geology, Comparison, Environment, Multitemporal, TIMESAT
ABSTRACT:
The Pantanal is the world's largest wetland presenting a variety of ecological sub-regions. The region is characterized by seasonal floods followed by long droughts. At this period, some areas rapidly dry, while others remain soaked. The study hypothesis was based on the statement that this phenomenon cannot be totally explained by small relief variations but by the sediment granulometry: the pelitic sediments allow the soil to retain moisture longer, implying that the vegetation has greater possibilities of continuing photosynthetically active even during the drought. It was developed based on the spectral behaviour of MODIS products, validated by previous fieldwork. Using MODIS, we studied a large scale patterns in spatial and seasonal dynamics of the vegetation in different regions of Pantanal. So, two indirect parameters of the local physical environment – sediment granulometry and water availability – potentially can be estimated. We calculated the NDVI from MOD09GQ for rainy and dry seasons, generating triplets (NDVI/NIR and Red bands) that allowed to identify vegetation changes in those periods. The 16-days composites of NDVI (MOD13Q1) were used to generate a 5-year time-series for pixels associated with 161 locals sampled for granulometric analyses. The samples were taken in 10 different areas from the 20 geological and environmentally homologous areas delimited in this research. The clear tendency in the time-series confirms the working hypothesis, indicating that there is a high relationship between drought-related changes in vegetation extracted from NDVI and sediment texture, parameter that plays an important role in soil moisture, influencing the vegetation response to droughts.
1. INTRODUCTION
The Pantanal is a vast wetland predominantly covered by savannas and, more locally, by forests. It is located in a tropical region at the center of South America over a sedimentary basin. This basin, originated at the end of Tertiary, is yet tectonically active, due to efforts between the tectonic plates of South America and Nazca (Assumpção, 1998). Nested in the Upper Paraguay River basin, the floodplain is located mostly in Brazil with smaller areas in Bolivia and Paraguay. Pantanal is a complex wetland characterized by seasonal floods with varied intensities, and markedly wet and dry phases, with geomorphic features derived from the present conditions and others inherited from successive Pleistocene and Holocene climate changes. This landscape has enormous internal variability due largely to the geological environment: the nature of the sediments, small relief variations associated with the sedimentary or erosional processes and neotectonics.
The large size of this feature and the access difficulties makes the remote sensing an indispensable tool. To detect phenological changes, the remote sensing community has relied on vegetation indices, usually derived from the Advanced Very High Resolution Radiometer (AVHRR) or the Moderate Resolution Imaging Spectroradiometer (MODIS) as these sensors have the advantages of greater image acquisition frequency and larger areal coverage (Redo and Millington, 2011). MODIS products are particularly suitable to study Pantanal because they can cover the entire wetland in a single orbit, providing a synoptic view of this dynamic region. From these data it is possible to extract products of vegetation indices which enhance the spectral response of plants, reducing the influence of soil, aiming to distinguish the vegetation
phenology and changes in land use/land cover at the analysis of a temporal image series (Wardlow et al., 2007).
Currently, satellite derived vegetation index data, such as Normalized Difference Vegetation Index (NDVI), plays an important role for vegetation drought response and flood monitoring (Kogan, 1998; McVicar and Jupp 1998, Ji and Peters 2003, Gu et al., 2008, Caccamo et al., 2011). The indices are useful for detection and monitoring large area vegetation stress resulted from drought or soil oversaturation following flooding and excessive rains. In dynamic areas, such Pantanal, annual cycle of floods and droughts, changes the landscape completely, creating different inside areas based on physical environmental characteristics. Between November and March, rains saturate the area; rivers overflow and flood the lowland forest and grassland areas, turning the plains into an immense freshwater wetland. From April onwards though, the waters start to recede, and by October, water can only be found in low-lying ponds and rivers. Although, drought effects in vegetation have a tendency to be more persistent in some areas than in others. The study hypothesis was based on the statement that this phenomenon cannot be totally explained by the small relief variations in Pantanal but by the sediment granulometries. In this context, the main objective of this study was to understand how MODIS-based NDVI correlates to sediments granulometry over the seasons and along a five year NDVI time-series in Pantanal. The knowledge of the velocity and intensity of NDVI values decrease at the sampled areas will enable the establishment of granulometric patterns for regions not visited during the fieldwork. This will provide an unpublished and essential indicative granulometric spatial data, that can allow the proposal of a subdivision of the Pantanal in geological and environmental homologous sub-areas.
2. METHODS 2.1 Study site
This study was carried out in the Pantanal wetlands of Mato Grosso and Mato Grosso do Sul states, south-western Brazil, in an area known as Pantanal Matogrossense. The area is the largest continuous freshwater wetland in the world, covering over 140,000 km2 (Alho et al., 1988), and is characterized by low terrain with an annual flooding regime.
The climate of the Pantanal is tropical with a marked wet season, with most rain falling between November and March. The vegetation is heterogeneous and influenced by four biomes: Amazon rainforest, Savanna (predominantly), Chaco, and Atlantic Forest (Adámoli, 1981). Note that Cerrado and Chaco are savannas.
According to RADAMBRASIL (1982) the soils are variable but generally contain more silt and clay in areas subject to riverine overflow and tend to be sandy on the higher parts of the alluvial fans, including areas subject to flooding by local rainfall. These soils are closely related to the nature of the sediments, a consequence of the source material and the processes of deposition and sedimentation (Assine and Soares, 2004). For example, the alluvial fan of Taquari has a predominance of sandstones in the source area and the sediment granulometry at the Alta Nhecolândia, Baixa Nhecolândia and Paiaguás sub regions are essentially sandy. This variety of source areas confers contrasting characteristics between the prevalent sediments in different alluvial fans that filled the depression of the Pantanal.
2.2 Field data - Sediment site selection and granulometric analysis
Sediment samples were acquired from 161 ground sites in August of 2011 (dry period) during 16 days fieldwork covering over 2,000 km within different Pantanal regions. The spectral behavior of MODIS during rainy and dry seasons guided the choice of sampling sites.
We focused our study on MODIS tiles H12V10 and H12V11, which cover the entire Brazilian Pantanal. There were obtained two images of the MOD09GQ product, one from the rainy season (March 5th 2005) and the other from the dry season (August 3rd 2005). These data were converted to NDVI, and then combined in triplets (NDVI, NIR and red bands) for both periods to identify vegetation changes in those seasons. The sampling was carried out using auger Dutch type, collecting the portion immediately below the soil with presence of roots. Grain-size analyses were performed. The method for determining the percentage of silt, sand and clay in a soil was described by Camargo et al. (2009).
2.3 Design of work hypothesis
The study hypothesis - the presence of a relationship between the annual behavior of vegetation, indicated by MODIS images with the granulometry of the soil / sediment - was based on the statement that this phenomenon cannot be totally explained by the small relief variations in Pantanal but by the different sediment granulometries. According to this hypothesis, in areas where the sediments are sandy the surficial water accompanies the lowering of water table, impairing the capacity of vegetation to face the dry season. The idea was tested and confirmed product provides a 250m resolution daily imagery including the red (620–670 nm) and infrared bands (841–876 nm) and the MOD13Q1 product is a 250m 16-day composite of the highest-quality pixels from daily images and includes Normalized Difference Vegetation Index (NDVI), Enhanced Vegetation Index (EVI), blue, red, near infrared (NIR), mid-infrared reflectance and pixel reliability. The images were obtained from the MODIS website (http://mrtweb.cr.usgs.gov/) as a free download using USGS MODIS Reprojection Tool Web Interface (MRTWeb). In this platform, the images were subset and projected to geographic coordinates using the WGS84 reference ellipsoid. Subsequently, the image processing was performed using the software Envi 4.7 and TIMESAT.
The subdivision of the Pantanal here proposed is an evolution of the proposal done in Penatti et al. (2011), in which Pantanal was divided in 18 areas of homologous behavior, taking into account the distribution of floods, the behavior of the vegetation, the differences in contrast and brightness, textures and patterns between periods of flood and drought (obtained from MOD09GQ products) and data extracted from digital elevation model obtained from the SRTM data. The new vectorization on the triplets generated was done in ArcGIS improving the limits of each area and analyzing the behavior of the vegetation between the seasons in each region. Then, we calculated each sub-area statistics mean, minimum, maximum and percentage of reduction between seasons for NDVI from the rainy and the dry periods.
The MODIS-NDVI 16-day composite data (MOD13Q1) was used to generate time-series from 2006 to 2010 (115 granules) for pixels associated with locals sampled for granulometric analyses. The NDVI is based on the relationship between the red and near infrared wavelength reflectance and responds to vegetation photosynthetic pigment concentrations (mostly chlorophyll) and structure. Detailed time series of this data follow the annual growth cycles – or phenology – of vegetation found in a pixel (Clark et al., 2010). Since soils act as substrate for plant communities, the information about its composition may be important contributions to vegetation studies. The vegetation analysis can provide indirect information about the sediment granulometry.
Although MODIS data have been corrected for atmospheric effects there is remaining disturbance affecting the data quality, e.g. geolocation errors, angular variations, residual clouds and atmospheric disturbance (Eklundh et al., 2007). To minimize these effects the data were smoothed with the Savitsky–Golay algorithm of the TIMESAT package (Jönsson and Eklundh, 2004, 2011), and 5-year NDVI time-series profiles were generated for each granulometric sample point. The MOD13 pixel reliability band was used to weight each point in the time series: value 0 (good data) had full weight (1.0), values 1–2 (marginal data, snow/ice) had half weight (0.5), and value 3 (cloudy) had minimal weight (0.1). Function-fitting parameters used in TIMESAT were: a Savitzky-Golay filter procedure, 4-point window over 2 fitting steps, adaptation strength of 2.0, no spike or amplitude cutoffs, season cutoff of 0.0, and begin and end of season threshold of 20%.
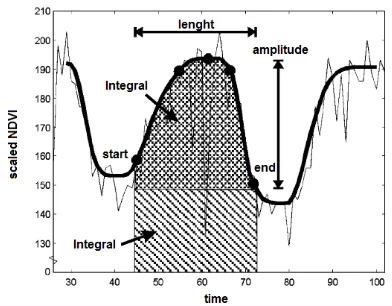
The output from TIMESAT is a set of files containing annual seasonality parameters (Length: length of the season; Base value: average of the left and right minimum values; Peak time: largest data value for the fitted function during the season; Peak value: largest data value for the fitted function during the season; Amplitude: seasonal amplitude, etc), as well as fitted
function files containing smooth renditions of the original data (Figure 1).
Figure 1. Seasonality parameters generated in TIMESAT (Modified from Jönsson and Eklundh, 2004)
Based on the granulometric analyses the samples were divided into four groups with different textural compositions, based on the amount of fine-grained sediments: Group 1 – samples containing more than 70% of fine-grained sediments; Group 2 – samples containing from 50 to 70% of fine-grained sediments: Group 3 – samples containing from 30 to 50% of fine-grained sediments and Group 4 – samples containing less than 30% of fine-grained sediments. Fine-grained sediments are described here in terms of their silt and clay content.
For each group we generated the time-series of the mean NDVI values by averaging the values of all granulometric samples identified in one of these groups. Then, we calculated each group statistics mean, standard deviation, minimum, maximum and range for NDVI. After all the annual seasonality parameters generated by TIMESAT for the samples were converted in mean values (mean of the 5-year seasonality parameters) for each group samples.
3. RESULTS
The two images obtained from MOD09GQ allowed the subdivision of Pantanal in 20 homologous areas (Figure 2). The triplets with the Red and NIR bands and vegetation index built on these bands, despite the spectral poverty, revealed to be tonally rich, allowing us to observe the different behaviors of vegetation in both seasons.
Since NDVI tells essentially about the photosynthetically active radiation, this parameter presents great importance in the differentiation of sub-areas of the Pantanal to inform, ultimately, about water availability in non-flooded parts of the region.
In Figure 2, it is possible to observe that some regions remain with a similar vegetation behavior (yellowish areas in both seasons), remaining with vigorous photosynthetic activity even in the dry period, while others have low photosynthetic activity in this period (bluish areas in the dry season). The areas that appear bluish during both seasons are dominated by sandy sediments and poor soils and have lower NDVI values, while areas that are reddish stay soaked most of the year.
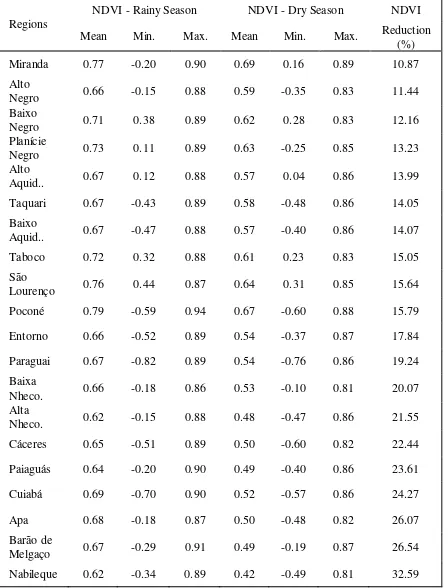
The analysis of the pair of MODIS triplets showed that the variations in mean NDVI values within each area are closely related to the predominant granulometry, ranging around 10% at the argillaceous areas and between 20 to 30% at the sandy areas (Table 1). Only three of the 20 areas analyzed filled with coarser sediments didn’t show these trends (Planície do Negro,
Taquari and Paraguai), because they are inundated most of the year.
Figure 2. Limits of Pantanal on MODIS triplets of the rainy and dry seasons, respectively (False colour composite:
NDVI/NIR/R)
Regions
NDVI - Rainy Season NDVI - Dry Season NDVI Mean Min. Max. Mean Min. Max. Reduction
(%)
Miranda 0.77 -0.20 0.90 0.69 0.16 0.89 10.87
Alto
Negro 0.66 -0.15 0.88 0.59 -0.35 0.83 11.44
Baixo
Negro 0.71 0.38 0.89 0.62 0.28 0.83 12.16
Planície
Negro 0.73 0.11 0.89 0.63 -0.25 0.85 13.23
Alto
Aquid.. 0.67 0.12 0.88 0.57 0.04 0.86 13.99
Taquari 0.67 -0.43 0.89 0.58 -0.48 0.86 14.05
Baixo
Aquid.. 0.67 -0.47 0.88 0.57 -0.40 0.86 14.07
Taboco 0.72 0.32 0.88 0.61 0.23 0.83 15.05
São
Lourenço 0.76 0.44 0.87 0.64 0.31 0.85 15.64
Poconé 0.79 -0.59 0.94 0.67 -0.60 0.88 15.79
Entorno 0.66 -0.52 0.89 0.54 -0.37 0.87 17.84
Paraguai 0.67 -0.82 0.89 0.54 -0.76 0.86 19.24 Baixa
Nheco. 0.66 -0.18 0.86 0.53 -0.10 0.81 20.07
Alta
Nheco. 0.62 -0.15 0.88 0.48 -0.47 0.86 21.55
Cáceres 0.65 -0.51 0.89 0.50 -0.60 0.82 22.44
Paiaguás 0.64 -0.20 0.90 0.49 -0.40 0.86 23.61
Cuiabá 0.69 -0.70 0.90 0.52 -0.57 0.86 24.27
Apa 0.68 -0.18 0.87 0.50 -0.48 0.82 26.07
Barão de
Melgaço 0.67 -0.29 0.91 0.49 -0.19 0.87 26.54
Nabileque 0.62 -0.34 0.89 0.42 -0.49 0.81 32.59
Table 1. NDVI mean values for each Pantanal region in rainy and dry seasons and the NDVI reduction between the seasons
from the pair of MOD09GQ images
From the 161 samples, only 63 generated good phenological profiles, because most of it did not have enough data to generate profiles in TIMESAT and some of the samples were located in the same pixel, so only few data could be used. Most of the samples were classified as group 4 - sandy samples (N=39), what was expected since the Pantanal sediments are mostly sandy. Only nine samples were classified as group 3, seven as group 2 and eight as group 1.
For each group with different textural compositions, based on the amount of fine-grained sediments we generated a time-series of the mean NDVI values (Figure 3). In areas characterized mostly by sandy sediments (groups 3 and 4) the NDVI (chlorophyll) decreased quicker after the rainy season and varied more along the seasons, while in areas with some siltic-argillaceous sediments (groups 1 and 2) the NDVI decreased slower and had less variation. Group 1 presented a slower increase and decrease in chlorophyll, while the other groups decreased more rapidly after the end of the rainy season. The response of vegetation to drought effects in soils with more than 50% of sand were very similar (groups 3 and 4), showing a rapid and intense decrease in chlorophyll (NDVI). The standard deviation (SD) is lower in group 1, but did not follow any patterns in the other groups.
Figure 3. NDVI time series representing the mean values for each group with different textural compositions
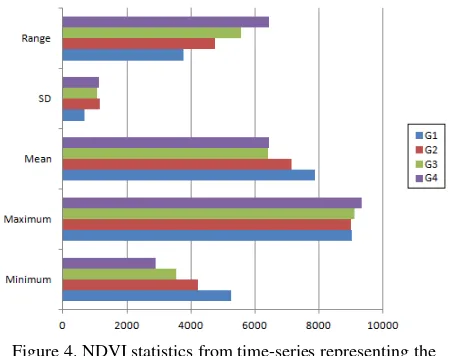
The seasonality parameters for each group can be seen in Table 2 and Figure 4. It can be easily verified that these data confirm the hypothesis. The range of variation is perfectly correlated with granulometric classes: the finer the sediment, the lower the seasonal variability. This statement, which can now be done, was the basis of the work hypothesis. And really, during the droughts the vegetation response comes to the lowest degree in the proposed classes. At the rainy season, with water disponibility, high temperatures and the graminea presence, the Group 4 presents a maximum NDVI response discretely higher than the other classes. On the other side, the minimum is hardly affected by the drought and the NDVI response is near perfectly correlated with the pelites presence. The mean NDVI response is, naturally, highly correlated with the pelites. The fact that Group 4, the more sandy, does not have a smaller response than Group 3 may be explained by the presence of graminea, often presenting planophyll leaves which are highly reflective in the NIR band. Finally, the standard deviation (SD) is not very important and is more discrete for the pelitic class, as expected. The reading of all the dataset used here shows a high percentage of agreement between the behavior of the temporal series and the punctual behavior of vegetation (NDVI), what can also be seen in Figure 2. This allied to fieldwork allows to evaluate the dominant particles size in areas of difficult access and well defined seasons. These results makes possible to proceed at the core of this research project: propose a subdivision of the Pantanal in geological and environmental homologous areas.
Seasonality
Parameters Group 1 Group 2 Group 3 Group 4 Mean
Length 17.69 18.74 18.58 18.09
Mean Base
value 7019.33 5974.79 5022.08 5110.60 Mean Peak
time 60.21 60.46 60.76 60.28
Mean
Amplitude 1604.57 2298.43 2610.23 2613.29 Maximum 9018.30 8991.63 9122.44 9323.46
Minimum 5250.92 4228.76 3542.16 2894.51
Mean 7862.23 7138.43 6408.97 6453.02
SD 672.46 1142.51 1067.19 1120.87
Range 3767.38 4762.87 5580.28 6428.95 Table 2. Seasonality parameters for each group with different
textural compositions
Figure 4. NDVI statistics from time-series representing the mean values for each group with different textural compositions, based on the amount of fine-grained sediments
4. DISCUSSION
The analysis of the pair of MODIS triplets allied to the 5-year NDVI time-series analysis and its seasonality parameters show clearly the possibility of estimating the sediment granulometry remotely through the behavior of the vegetation along the dry and rainy seasons. Each granulometric interval of the studied samples is associated with vegetation that has a particular intra-annual variability. This allows the proposal of a subdivision of the Pantanal in geological and environmental homologous sub-areas. The spatial distribution of these data can be done in pairs of MODIS images in the dry and rainy seasons, which were able to meet this demand.
This vegetation analysis seems to be a good method for providing indirect information about the sediment granulometry. Since soils have different moisture holding and drainage capacities, areas with higher amounts of fine-grained sediments presented higher index values in the dry season, when water disponibility is more critical, and presented lower NDVI seasonal amplitude, while areas with predominantly sandy sediments which dry out deeply during the dry season, presented a higher variation in NDVI seasonal amplitude, and lower NDVI values. In the rainy season water is not a limiting resource, and the NDVI values are higher in all sediment types, especially between November and begin of April, when the rainfalls occur.
Higher NDVI values reflect high leaf area and great vigor and photosynthetic capacity (or greenness) of vegetation canopy, whereas lower NDVI values for the same time period are reflective of vegetative stress resulting in chlorophyll reductions and changes in the leaves internal structure due to wilting (Gu et al., 2008). These authors found that correlations between MODIS 500-m satellite indices and the soil moisture index are highly dependent on both the level of land cover heterogeneity and soil type. We did not take in consideration the vegetation heterogeneity, because we worked with groups with different textural compositions, using mean phenological profiles, which attenuates the vegetation differences between sample sites. Probably when working with each sample profile, it will be interesting to take into account the vegetation type. Although, these authors found that NDVI and Normalized Difference Water Index (NDWI) had high statistically significant correlations with the 25-cm layer soil moisture, which indicates that this indices have slightly stronger responses to the soil
moisture variation at this depth, what is consistent with our findings.
The only sub-areas that did not follow this pattern were the ones that are inundated most of the year and the sandy areas that were not affected by inundations. This was due specially because they presented low NDVI amplitude most of the year, presenting almost the same behavior along the seasons. The seasonality parameters showed motivating data, but could be interesting analyzing each sample separately to understand the variations between different sub-regions in Pantanal, take into account the predominant vegetation type in the sampled area and its associations with the rainfall. The high inter-annual variability of rainfall in the region results in variability in the flooding regimes, and possibly in the phenological profiles. Adami et al. (2008) emphasized that, in the Pantanal, different kinds of vegetation receive different amounts of rainfall, in different locations and, consequently, have different spectral responses. So, the small variations in mean peak time might be the result of intra-regional rainfall differences, since the rainfall is significantly higher in some parts of the surrounding uplands of Pantanal, particularly in the north (EDIBAP unpubl. rep. apud Hamilton et al, 1997). The general inter-annual behavior, however, is maintained despite the inevitable variations due to local rainfall and different vegetation types that occur in the area, from dense forests to savannas with low rates of leaf area. The maximum values in NDVI between the groups were not very different, and it may be due to NDVI limitations. According to Jensen (2009), since this is an index based on ratio (non-linear), it can be influenced by the additive effects of noise, such as additive atmospheric effects like path radiance. Besides that, the NDVI is very sensitive to the substrate under the canopy, where the higher values occur with darker substrates. Nevertheless, the main limitation of the NDVI is the saturation problem over lands with high biomass such as tropical forest.
In general, this method showed useful, and the coarse resolution from MODIS (250-m) was considered adequate for showing granulometric tendencies in Pantanal, although it has to take in consideration the great size of this wetland. So, other regional scale areas need to be investigated to draw stronger conclusions about the robustness of the methodology. If confirmed for other regions, the coarse resolution time-series method will enable low-cost detection and mapping of the granulometry of large areas. Furthermore, phenological data profiles should be increased to complete the available data series (2000 to 2011) in order to reduce the loss of information due to clouds and atmospheric influences. Other vegetation indices, like NDWI, Enhanced Vegetation Index (EVI) and Leaf Area Index (LAI), with wider profiles also might gave significant improvements in the understanding of the relationship between the vegetation and the sediments granulometry.
5. CONCLUSION
Results from this study indicate that there is a high relationship between drought-related changes in vegetation extracted from NDVI and sediment texture, parameter that plays an important role in soil moisture, influencing the vegetation response to droughts. This method showed very good results on accessing sediment texture from vegetation phenology and improved our understanding of how phenological profiles vary over different granulometric sediments over space and time.
In conclusion, 16-day MODIS NDVI time-series may be used for detecting granulometry tendencies and mapping granulometric homologous areas with similar behavior in Pantanal. Although, it is necessary to take in consideration that
a previous knowledge of the region to be studied is indispensable and that auxiliary methods should be used, such the MODIS triplets and fieldwork samples
The good results do not eliminate the perspective to test the model with other spectral indices than NDVI in the remote assessment of sediments granulometry. Likewise, it would be interesting to test the method for different geographic regions with similar environmental characteristics, as well as other scales and images at Pantanal.
6. REFERENCES
Adami, M., Freitas, R.M., Padovani, C.R., Shimabukuro, Y.E., Moreira, M.A., 2008. Estudo da dinâmica espaço-temporal do bioma Pantanal por meio de imagens MODIS. Pesquisa Agropecuária Brasileira, 43, pp. 1371-1378.
Adámoli, J., 1981. O Pantanal e suas relações fitogeográficas com os cerrados. Discussão sobre o conceito de “Complexo do Pantanal.” Anais do XXXII Congresso Nacional de Botânica. Sociedade Brasileira de Botânica, Teresina, Brasil, pp. 109-119.
Alho, C.J., Lacher, T.E., Gonçalves, H.C., 1988. Environmental degradation in the Pantanal ecosystem. Bioscience, 38, pp. 164-171.
Assine, M.L., Soares, P.C. 2004. Quaternary of the Panatanal, west-central Brazil. Quaternary International, 114: 23-24. Assumpção, M., 1998. Focal mechanisms of small earthquakes in the southeastern Brazilian shield: a test of stress models of the South American plate. Geophysical Journal International, 133, pp. 490-498.
Caccamo, G., Chisholm, L.A., Bradstock, R.A., Puotinen, M.L. 2011. Assessing the sensitivity of MODIS to monitor drought in high biomass ecosystems, Remote Sensing of Environment., 115, pp. 2626–2639
Camargo, O.A., Moniz, A.C., Jorge, J.A., Valadares, J.M.A.S., 2009. Métodos de análise química e física de solos do Instituto Agronômico de Campinas. Campinas, IAC, (B. técnico, 106) Resolução CONAMA 344/04, pp. 94.
Clark, M.L., Aide, T.M, Grau, H.R., and Riner, G., 2010. A scalable approach to mapping annual land-cover at 250 m using MODIS time-series data: A case study in the Dry Chaco ecoregion of South America, Remote Sensing of Environment, 114, pp. 2816-2832.
Eklundh, L., Jönsson, P., 2011, Timesat 3.1 Software Manual, Lund University, Sweden.
Eklundh, L., Jönsson, P., Kuusk, A., 2007. Investigating modelled and observed Terra/ MODIS 500-m reflectance data for viewing and illumination effects. Advances in Space Research, 39, pp. 119-124.
Gu, Y.X., Hunt, E., Wardlow, B., Basara, J.B., Brown, J.F., Verdin, J.P., 2008. Evaluation of MODIS NDVI and NDWI for vegetation drought monitoring using Oklahoma Mesonet soil moisture data. Geophysical Research Letters, 35(5), L22401. Jensen, J.R., 2009. Sensoriamento Remoto do Ambiente: Uma perspectiva em Recursos Terrestre. São José dos Campos: Parêntese.
Ji, L., Peters, A.J., 2003. Assessing vegetation response to drought in the northern Great Plains using vegetation and drought indices. Remote Sensing of Environment, 87, pp. 85-98. Jönsson, P., Eklundh, L., 2002, Seasonality extraction and noise removal by function fitting to time-series of satellite sensor data, IEEE Transactions of Geoscience and Remote Sensing, 40, pp. 1824-1832.
Jönsson, P., Eklundh, L., 2004. TIMESAT - a program for analysing time-series of satellite sensor data, Computers and Geosciences 30, pp. 833-845.
Jönsson, P., Eklundh, L., 2004. TIMESAT - a program for analysing time-series of satellite sensor data, Computers and Geosciences, 30, pp. 833-845.
Kogan, F.N., 1998. Global drought and flood-watch from NOAA polar-orbiting satellites. Advances in Space Research, 21(3), pp. 477-480.
Lourival R., Drechsler M., Watts M.E., Game E.T., Possingham H.P.. 2011. Planning for reserve Adequacy in dynamic landscapes; maximizing future representation of vegetation communities under flood disturbance in the Pantanal wetland. Diversity and Distributions, 17, pp. 297-310.
McVicar, T.R., Jupp, D.L.B., 1998. The current and potential operational uses of remote sensing to aid decisions on drought exceptional circumstances in Australia: a review. Agricultural Systems, 57, PP. 399-468.
Penatti, N.C., Marques, H.G., Almeida, T.I.R., 2011. Imagens MODIS aplicadas ao estudo da subdivisão do Pantanal em áreas geológica e ambientalmente homólogas: resultados preliminares. Anais XV Simpósio Brasileiro de Sensoriamento Remoto - SBSR, Curitiba, Brasil, INPE, pp. 3559-3566. RADAMBRASIL, 1982. Project RADAMBRASIL. Folha SE.21 Corumbá. Geologia, geomorfologia, solos, vegetação uso potencia da terra. Min. Mines Energy, Rio de Janeiro. pp. 448. Redo, D. J., Millington, A.C., 2011. A hybrid approach to mapping land-use modification and land-cover transition from MODIS time-series data: A case study from the Bolivian seasonal tropics. Remote Sensing of Environment, 115, pp. 353-372.
Wardlow, B.D., Egbert, S.L., Kastens, J.H., 2007. Analysis of time-series MODIS 250m vegetation index data for crop classification in the U.S. Central Great Plains. Remote Sensing of Environment, 108, pp. 290-310.
7. ACKNOWLEDGEMENTS
The authors acknowledge FAPESP (Process 2010/52614-4) for financial support, Natasha Costa Penatti to CAPES for the Ph.D. scholarship and Teodoro Isnard Ribeiro de Almeida to CNPq for the grant.