PRIMITIVE-BASED BUILDING RECONSTRUCTION BY INTEGRATION OF LIDAR
DATA AND OPTICAL IMAGERY
W. Zhang a,*, P. Grussenmeyer b, G. Yan a, M. Mohamed b a
State Key Laboratory of Remote Sensing Science, School of Geography, Beijing Normal University, 100875 Beijing,
China - (wumingz, gjyan)@bnu.edu.cn
b
The Images Sciences, Computer Sciences and Remote Sensing Laboratory, INSA Strasbourg, France, –
(pierre.grussenmeyer, mostafa.mohamed)@insa-strasbourg.fr
Commission III, WG III/4
KEY WORDS: Building Reconstruction, LiDAR, Optical Imagery, Primitive-based, Bundle Adjustment
ABSTRACT:
Airborne LiDAR data and optical imagery are two datasets used for 3D building reconstruction. In this paper, the complementarities of these two datasets are utilized to perform a primitive-based 3D building reconstruction. The proposed method comprises following steps: (1) recognize primitives from LiDAR point cloud and roughly measure primitives’ parameters as initial values, and (2) select primitives’ features on the imagery, and (3) optimize primitives’ parameters by the constraints of LiDAR point cloud and imagery, and (4) represent 3D building model by these optimized primitives. Compared with other model-based or CSG-model-based methods, the proposed method is simpler. It only uses the most straightforward features, i.e. planes of LiDAR point cloud and points of optical imagery. The experimental result shows this primitive-based method can accurately reconstruct 3D building model. And it can tightly integrate LiDAR point cloud and optical imagery, that is to say, all primitives’ parameters are optimized with all constraints in one step.
* Corresponding author.
1. INTRODUCTION
3D reconstruction of buildings is an important approach to obtain the 3D structure information of buildings, and has been widely used in the applications of telecommunication, urban planning, environmental simulation, cartography, tourism, and mobile navigation systems. It has been the major topic of photogrammetry, remote sensing, computer vision, pattern recognition, surveying and mapping. Traditionally, photogrammetry is the primary approach for deriving geo-spatial information through the use of multiple optical images. Optical imagery has sharp and clear edges, so the 3D information derived from photogrammetric measurements consists of accurate metric and rich descriptive object information (Mikhail et al., 2001). But it is hard to obtain dense 3D points on the building’s surface because of the matching problem at the homogeneous or occluded places. Also because of matching problem, it is hard to generate 3D building model automatically by photogrammetry (Schenk and Csatho, 2002).
Since it was introduced in the 1980s, as a promising method, Light Detection And Ranging (LiDAR) technology is used in the applications of acquiring digital elevation data. Because LiDAR technology is fully automated for generating digital elevation data, many researchers have paid attention to the technology and its applications (Ackermann, 1999; Arefi, 2009; Habib et al., 2004; Mayer et al., 2008; Rottensteiner and Briese, 2002; Zhang and Li, 2006). Although LiDAR point cloud has dense 3D points, these points are irregularly spaced, and don’t have accurate information regarding breaklines such
as building boundaries. Thus, the reconstructed 3D building’s model is not very accurate (the accuracy depends on the points density), not only the shape but also the position of the building. Obviously, to generate a more accurate 3D building model using LiDAR point cloud, the help of other datasets with accurate boundaries is necessary.
Both ground plan and optical imagery satisfy this requirement. Compared with ground plan, optical imagery has the advantages of easy availability and up-to-date state. A variety of research has been conducted using LiDAR point cloud and optical imagery, whatever data-driven or model-driven approaches (Habib, 2009; Kim, 2008; Tarsha-Kurdi et al., 2007b; Wang, 2008). The existing methods have some drawbacks. Firstly, most of these methods use edges as the features to connect LiDAR point cloud and optical imagery, the data processing procedure is complex due to the edge detection, filtering, combination and other operations. Secondly, the LiDAR point cloud and optical imagery are often processed respectively, and then the results are combined simply.
There are two reasons for the selection of primitive-based method to reconstruct 3D building model.
Firstly, LiDAR point cloud has dense 3D points, but these points are irregularly spaced, and don’t have accurate information regarding breaklines such as building boundaries. On the contrary, optical imagery has sharp and clear edges, but it is hard to obtain dense 3D points on the building’s surface. In order to reconstruct 3D building model by integration of LiDAR point cloud and optical imagery, the selected object must have clear edges and dense surface points at the same time. Obviously, primitives, for example, box, gable-roof and hip-roof can satisfy this requirement. Suitable primitives will “glue” LiDAR point cloud and optical imagery.
Secondly, from the point view of computation, primitive-based representation of 3D building model has less parameters. For example, to represent a box, 3 parameters (width, length and height) are used to represent the shape; together with 3 parameters for position and 3 parameters for orientation, totally 9 parameters are enough to determine the shape and locate the box in 3D space. So the solution can be calculated easily and robustly.
For the selection of features, it is crucial because it affects the complexity of the process and the accuracy of the reconstructed 3D building model. As we have seen, LiDAR point cloud and optical imagery have different characteristics, so different features will be selected for these two datasets. The features should be as straightforward and simple as possible, so that they can be easily located and accurately measured. Plane is the feature that we selected for LiDAR point cloud, and corner is the feature that we selected for optical imagery. Using these straightforward and simple features, the computational procedure is simplified, and the result can be obtained precisely and robustly.
Because of above reasons, we select primitive-based method to reconstruct 3D building model, and plane feature for LiDAR point cloud and corner feature for optical imagery. In this paper, only two kinds of primitives are studied, i.e., box and hip-roof.
2.2 Workflow
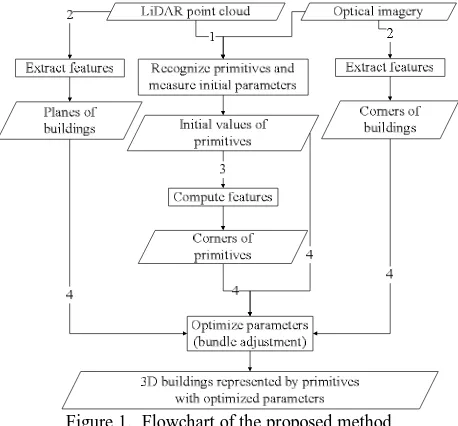
Fig. 1 shows the workflow of this primitive-based 3D building reconstruction method. The numbers denote the order of processing.
Figure 1. Flowchart of the proposed method
1. Recognize primitives and measure initial parameters. With the help of optical imagery and
LiDAR point cloud, the building is decomposed into several primitives. Then the primitive’s parameters are measured roughly on LiDAR point cloud and optical imagery, such as length, width, height, orientation and translation of the primitive. These measurements can be used as fixed values (constraints) or initial values in the following bundle adjustment procedure.
2. Extract features. Corners are detected/selected on
the optical imagery, and planes are detected/selected in the LiDAR point cloud. These features will be used as observed values/observations in the following bundle adjustment procedure.
3. Compute features. Based on the type and parameters of primitives, the 3D coordinates of the primitives’ features, such as corners, can be calculated. They will be used as model/computed values in the following bundle adjustment procedure. 4. Optimize parameters (bundle adjustment). Using
Collinearity Equation and 3D Plane Equation as mathematical models, a cost function can be established. The inputs of this cost function are observed values, model values, and initial values above. When the bundle adjustment procedure is finished, the optimized/refined primitives’ parameters will be outputted.
Finally, 3D building can be represented by these primitives with the optimized parameters.
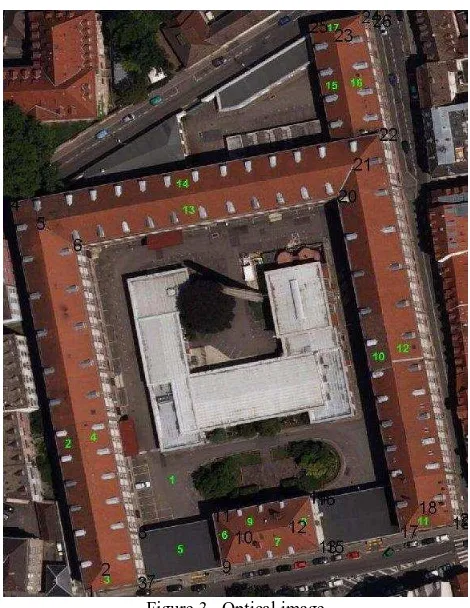
Figure 2. LiDAR point cloud
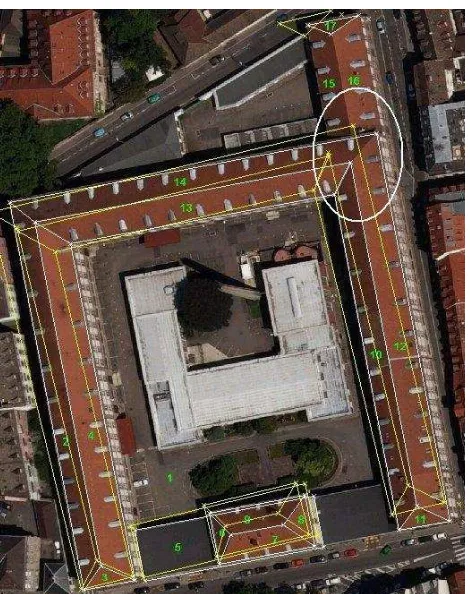
Figure 3. Optical image
2.3 Recognize Primitives and Measure Initial Parameters
2.3.1 Hip-roof Primitive: The primitive mainly used in
this example is hip-roof primitive, which is shown in Fig. 4. The coordinates framework and the parameters are labelled. It can be seen that 6 parameters are used to define the shape of this hip-roof primitive. Further more, another 6 parameters define how a primitive is placed in 3D space, 3 for position and 3 for orientation.
Figure 4. Hip-roof primitive
2.3.2 Recognize Primitives: In order to carry out the
primitive-based 3D building reconstruction, a building must be decomposed into several primitives. It is hard to perform this task all by computers. At current stage, the recognition of primitives is done in interactive mode. The decomposition is not unique, it depends on the operator. After analyzing both LiDAR point cloud (see Fig. 2) and optical image (see Fig. 3), this building can be decomposed into 5 hip-roof and 1 box primitives.
2.3.3 Measure Initial Parameters: When the way of
decomposition is determined, the parameters of each primitive should be measured. Height parameters can only be derived from LiDAR point cloud. Plane parameters, such as length, width and primary orientation of the building can be obtained from LiDAR point cloud or optical imagery. The parameters related with relative displacement and rotation to the adjacent primitive should also be determined.
As mentioned earlier, the measured parameters will be used as initial values and will be optimized in the following bundle adjustment procedure. It doesn’t need to measure these parameters accurately. So the process can be simplified and the efficiency will be high.
2.4 Extract Features
Corners are detected/selected on the optical imagery. All visible vertexes are measured; the pixel coordinates of x and y directions are recorded. Every vertex has a unique ID; the bigger numbers in Fig. 3 are these IDs. The pixel coordinates of these corners will be used as the observed values of Collinearity Equation and contribute to the cost function.
Planes are detected/selected in the LiDAR point cloud. In Fig. 3, these planes are labelled with smaller numbers. Every plane has a unique ID, and the plane equation is calculated using all 3D points that form this plane. These 3D plane equations will be used as constraints and contribute to the cost function.
2.5 Compute Features
2.6 Optimize Parameters (Bundle Adjustment)
On the basis of previous preparation works, all primitives’ parameters can be optimized by a bundle adjustment procedure. To achieve this goal, an important thing is to construct a simple and effective cost function.
Our idea is straightforward and simple. When a 3D building model has correct shape and is located in the correct place in 3D space, two conditions will be satisfied. Firstly, the back-projections of primitive’s vertexes (computed features) on the optical image should perfectly superpose on the measured corners (extracted features). Secondly, the primitive’s vertexes should be exactly on the planes which are formed by LiDAR point cloud.
Two mathematical models, i.e., Collinearity Equation and 3D Plane Equation are used to represent these two conditions respectively. And the cost function is established based on these two mathematical models. The inputs of this cost function are observed values, model values, and initial values above. The cost function can be optimized by bundle adjustment technique. When the bundle adjustment procedure is finished, the optimized/refined primitives’ parameters will be outputted.
So far, 3D building can be represented by these primitives with the optimized parameters. The experimental result will be shown and some discussions will be made in the next section.
3. EXPERIMENTAL RESULT AND DISCUSSION
3.1 Experimental Result
Fig. 5 shows the reconstructed 3D building model of the example data. The wireframes of the model are overlaid on the original LiDAR point cloud. It can be seen that they are fitted very well.
Figure 5. Reconstructed 3D building model
the real building’s edges. While, the optimized polygons fit the real building’s edges very well.
As shown in Fig. 3, there are totally 27 vertexes. The distances of the vertexes in the initial model and the optimized model compared to the imagery are computed. The result is shown in Tab. 1. It can be seen, the mean value and standard deviation are improved in both x and y directions after optimization procedure.
mean value/pixel
standard deviation/pixel
x -23.74 17.29
Initial model
y -10.00 15.12
x -0.04 1.65
Optimized model
y 0.17 1.90
Table 1. Statistics of distances of vertexes
Figure 7. Zoom view of circled region of Fig. 6
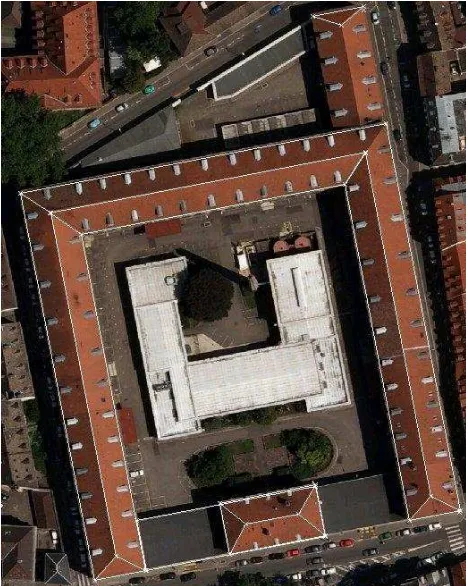
In this experiment, only one image (Fig. 6) is used. In order to reinforce the effectiveness of proposed method, the optimized model is also back projected to another image (Fig. 8), which covers this building but is not used during the reconstruction procedure. The optimized polygons fit the real building’s edges very well too.
Figure 8. Wireframes of optimized model on the image which doesn’t involve in optimization procedure
3.2 Discussion
From this preliminary experiment, it can be seen that the proposed method can utilize the complementarity of imagery and LiDAR point cloud, and a model is established as soon as the cost function is solved. This is only the first step, perhaps the reconstructed model is not very accurate, because:
1. The 3D parameters and 2D features were measured roughly by manual work.
2. The actual building doesn’t exactly coincide with the used simple model.
3. At present, only one image is used during optimization procedure.
Besides, there exist some deficient places.
1. The accuracy of the reconstructed model is only verified semi-quantificationally.
2. Only two simple primitives are used, i.e., box and hip-roof.
3. There are many manual works. For example, extraction of 2D corner features and 3D plane features, selection of primitives and measurement of the initial parameters of these primitives.
4. Not all images covering the studied building are used during the data processing procedure.
5. Only the data of one separated building was studied and processed.
To make the proposed method more automated and to apply this method to a wide urban area, there are some places needing improvement in subsequent research.
1. To represent more complex buildings, more primitives such as cylinder and sphere will be considered, and boolean operations of primitives will be used.
2. To improve the accuracy and the efficiency, instead of current manual work, either specific human-interactive software (Brenner, 1999) or some automatic algorithms will be developed, for example, extracting features from LiDAR point cloud and optical imagery (Tarsha-Kurdi et al., 2007a), recognizing types of primitives and obtaining the initial parameters of primitives.
3. To apply to a wide urban area where a lot of buildings in it, some in-depth topics will be studied, i.e., building detection, extraction and segmentation from LiDAR point cloud and optical imagery (Hu, 2003; Tarsha-Kurdi et al., 2006).
4. CONCLUSIONS AND FUTURE WORK
Airborne LiDAR data and optical imagery are two datasets used for 3D building reconstruction. In this paper, the complementarities of these two datasets are utilized to perform a primitive-based 3D building reconstruction. The preliminary experimental result demonstrates the feasibility of the proposed 3D building reconstruction method.
Beyond that, the proposed primitive-based method in this paper is simpler, because it only uses the most straightforward features, i.e. planes of LiDAR point cloud and points of optical imagery. Further more, it can tightly integrate LiDAR point cloud and optical imagery, that is to say, all primitives’ parameters are optimized with all constraints in one step.
The following researches will be carried out in the near future. 1. All images covering the reconstructed building will
be used to improve the accuracy and integrality of the reconstructed 3D model.
2. The corner features will be extracted more precisely from the optical imagery, so that they can be used to improve and validate the accuracy of reconstructed 3D model.
3. The result will be validated quantificationally or by in-situ data.
Acknowledgements
This work is supported by National Natural Science Foundation of China Grant No. 40801131 and the National High-Tech Research and Development Plan of China Grant No. 2010AA122202. This work is also supported by the Special Foundation for Free Exploration of State Key Laboratory of Remote Sensing Science of China. Thanks to two anonymous reviewers for their helpful comments and suggestions.
References
Ackermann, F., 1999. Airborne laser scanning—present status and future expectations. ISPRS Journal of Photogrammetry and Remote Sensing, 54: 64–67.
Arefi, H., 2009. From LIDAR Point Clouds to 3D Building Models. PhD thesis, Bundeswehr University Munich.
Brenner, C., 1999. Interactive Modelling Tools for 3D Building Reconstruction. In: Photogrammetric Week '99. Wichmann, Stuttgart, pp. 23-34.
Habib A., 2009. “Integration of Photogrammetric and LIDAR Data for Accurate Reconstruction and Visualization of Urban Environments”. Proceedings of FIG COM3 Workshop on Spatial Information for Sustainable Management of Urban Areas, Mainz, Germany.
Habib, A.F., Ghanma, M.S., Morgan, M.F., Mitishita, E.A., 2004. Integration of laser and photogrammetric data for calibration purposes. International Archives of XXth ISPRS Congress, commission I, Istanbul, Turkey, pp. 170-176.
Mayer H., Hinz, S., Stilla, U., 2008. Automated extraction of roads, buildings and vegetation. Chapter in Li, Z., Chen, J., & Baltsavias, E., (Eds), 2008. Advances in Photogrammetry, Remote Sensing and Spatial Information Sciences: 2008. ISPRS Congress Book, ISPRS Book Series, Volume 7 (527p.), © 2008 Taylor & Francis Group, London, ISBN 978-0-415-47805-2, p. 213-226.
Mikhail, E.M., Bethel, J.S., McGlone, J.C., 2001. Introduction to Modern Photogrammetry, John Wiley & Sons, Inc., New York, 479 p.
Rottensteiner, F., and Ch. Briese, 2002. A new method for building extraction in urban areas from high-resolution LiDAR data, International Archives of Photogrammetry and Remote Sensing, 34(3A): 295-301.
Schenk, T., and B. Csatho, 2002. Fusion of LIDAR data and aerial imagery for a more complete surface description. In: IAPRSIS 32(3A): 310.
Tarsha-Kurdi, F., Landes, T., Grussenmeyer, P., 2007a. Hough-Transform and Extended RANSAC Algorithms for Automatic Detection of 3D Building Roof Planes from Lidar Data. International Archives of Photogrammetry, Remote Sensing and Spatial Information Systems. Vol. XXXVI, Part 3 / W52, 2007, pp. 407-412.
Tarsha-Kurdi, F., Landes, T., Grussenmeyer, P., Koehl, M., 2007b. Model-driven and data-driven approaches using LIDAR data : analysis and comparison, International Archives of Photogrammetry, Remote Sensing and Spatial Information Systems Vol. XXXVI Part3 W49A / ISSN 1682-1750, pp. 87-92.
Tarsha-Kurdi, F., Landes, T., Grussenmeyer, P., Smigiel, E., 2006. New approach for automatic detection of buildings in airborne laser scanner data using first echo only, International Archives of Photogrammetry and Remote Sensing and Spatial Information Sciences, ISSN: 1682-1750, Vol. XXXVI, Part 3, pp. 25-30.
Wang, S., 2008. Floating model for building reconstruction from topographic maps and lidar data. XXI Congress of the International Society for Photogrammetry and Remote Sensing (ISPRS 2008). Vol. XXXVII. Part B3b:681-686.