IMPROVE THE ZY-3 HEIGHT ACCURACY USING ICESAT/GLAS LASER
ALTIMETER DATA
Guoyuan.Li a,b,c, Xinming.Tang a,b,c,*, Xiaoming.Gao a,b,c, Chongyang.Zhang c,d, Tao.Lib,c a
School of Resource and Environmental Sciences, Wuhan University, China - (ligy, txm, gaoxm)@sasmac.cn, b Satellite Surveying and Mapping Application Center, NASG, Beijing, China-, [email protected] c
Jiangsu Center for Collaborative Innovation in Geographical Information Resource Development and Application, Nanjing, China d
Beijing SatImage Information Technology Co., Ltd, , Beijing, China , [email protected]
Commission I, WG I/2
KEY WORDS: ZY-3, ICESat, GLAS, Satellite Laser Altimetry, Satellite LiDAR
ABSTRACT:
ZY-3 is the first civilian high resolution stereo mapping satellite, which has been launched on 9th, Jan, 2012. The aim of ZY-3 satellite is to obtain high resolution stereo images and support the 1:50000 scale national surveying and mapping. Although ZY-3 has very high accuracy for direct geo-locations without GCPs (Ground Control Points), use of some GCPs is still indispensible for high precise stereo mapping. The GLAS (Geo-science Laser Altimetry System) loaded on the ICESat (Ice Cloud and land Elevation Satellite), which is the first laser altimetry satellite for earth observation. GLAS has played an important role in the monitoring of polar ice sheets, the measuring of land topography and vegetation canopy heights after launched in 2003. Although GLAS has ended in 2009, the derived elevation dataset still can be used after selection by some criteria.
In this paper, the ICESat/GLAS laser altimeter data is used as height reference data to improve the ZY-3 height accuracy. A selection method is proposed to obtain high precision GLAS elevation data. Two strategies to improve the ZY-3 height accuracy are introduced. One is the conventional bundle adjustment based on RFM and bias-compensated model, in which the GLAS footprint data is viewed as height control. The second is to correct the DSM (Digital Surface Model) straightly by simple block adjustment, and the DSM is derived from the ZY-3 stereo imaging after freedom adjustment and dense image matching. The experimental result demonstrates that the height accuracy of ZY-3 without other GCPs can be improved to 3.0 meter after adding GLAS elevation data. What’s more, the comparison of the accuracy and efficiency between the two strategies is implemented for application.
* Corresponding author: [email protected]
1. INTRODUCTION
Using satellite images without GCPs (Ground Control Points) to realize global mapping is an attractive aim for photogrammetry researchers. As the first civilian high resolution stereo mapping satellite, ZY-3 has played an important role in the obtaining high accuracy stereo images to support the 1:50000 scale national surveying and mapping. Li (2012) and Tang et al. (2012) performed some geometric accuracy assessments during the ZY-3 on-orbit testing period and the preliminary results were attractive. Wang et al. (2014) has implemented systematic geo-location validation studies of ZY-3 data and the results validate that ZY-3 can obtain planimetric and vertical accuracy values of 10 m and 5m without GCPs (Ground Control Points), respectively. D'Angelo (2013) evaluated the ZY-3 performance for DSM and ortho-photo generation on two scenes east of Munich, and the overall RMSE between ZY-3 DSM and LIDAR reference is 2.0 m. Tang et al.(2015) evaluated the overall vertical RMSE of DSM without GCPs was 5.56m. Cao et al. (2015) examined the geometric calibration and validation of the ZY-3's CCD linear array sensors. Although ZY-3 has very high accuracy for direct geo-locations without GCPs (Ground Control Points), use of some GCPs is still indispensible for high precise stereo mapping, especially in order to improve the elevation accuracy. ICESat (Ice Cloud and land Elevation Satellite) is the first laser altimetry satellite for earth observation, on which
GLAS(Geo-science Laser Altimetry System) was loaded (Zwally et al., 2002). After launched, ICESat/GLAS has obtained many laser altimeter data, which has been widely used in polar ice sheets monitoring, vegetation heights measurement and canopy evaluation, and land elevation surveying (Schutz et al., 2005; Wang et al., 2011). Because of the full-waveform acquisition equipment, high-precision data-processing algorithms, and a precise satellite-attitude and orbit-determination device, ICESat-1/GLAS data have very high vertical accuracy. Some researchers have carefully compared the height accuracy of GLAS data with more accurate data such as that from airborne laser scanning (Martin et al., 2005; Kurtz et al., 2008) and global navigation satellite system (GNSS) measurements (Fricker et al., 2005; Wen et al., 2011). In some flat regions, the elevation accuracy of GLAS footprint points can reach to dm even cm level, which can be used as elevation control. Atwood et al. (2007) showed that ICESat-1/GLAS data can be selected as GCPs to support DEM generation from InSAR data. Gonzalez et al. (2010) presented some criteria for GLAS point selection as height references for TanDEM-X DEM generation. Arefi and Reinartz. (2011) used the ICESat laser altimetry to correct the systematic height errors of ASTER global digital elevation models and obtained significant improvement. Li et al. (2016) introduced the GLAS footprint as elevation control points for ZY-3 satellite images stereo adjustment to improve the elevation accuracy.
In this paper, ICESat/GLAS laser altimeter data is viewed as height reference to improve ZY-3 elevation accuracy without other ground control data. Two methods are presented, one is the conventional RFM (Rational Function Model) and bias-compensated model by block adjustment, and another is to correct the DSM derived from ZY-3 after freedom adjustment straight. What’s more, the comparison and analysis is implemented according to experimental result.
2. METHOD 2.1 Select GLAS data as elevation reference
There are 15 kinds of ICESat/GLAS data products in NSIDC (National Snow and Ice Data Centre) data distribution website, which are marked from GLA01 to GLA15. For instance, GLA01 data include the transmitted waveform sampled at 48 ns from the altimeter and the received waveform sampled at 544 ns over land area or 200 ns over the sea. GLA14 provides land surface elevation data. In this article, the ICESat/GLAS data was chosen by the parameters derived from GLAS14, such as the number of Gaussian function Np and the fitting standard deviation
m (Duong et al., 2008; Brenner et al., 2011). When there is only one narrow Gaussian peak, which means that the terrain of GLAS footprint is flat. The relationship between the return pulse width and the diverse angle of laser, the altitude of satellite and et al, is described on Eq.(1) (Gardner,1992).Thenm
can be constrained to smaller than threshold value to select GLAS point as vertical control point.2 2
If the slope of GLAS footprint surface is about 0.5m, Sis about 0.007rad according to the 70m diameter, and the
m is calculated as 6.8ns from Eq.(1).
m is 2.89ns from Eq.(2), which will be used as criterion for GLAS control point selection.2.2 Conventional bundle adjustment based RFM model The RFM is an empirical and fruitful model for high resolution satellite images (Tao and Hu, 2001). Grodecki and Dial (2003), Fraser and Hanley (2005), and Teo (2011) have implemented deep research on block adjustment based on the RFM and certain bias-compensated models such as the affine transformation model (Tong et al., 2010). An RFM with 80
rational polynomial coefficients (RPCs) represents the standard distribution product for ZY-3.
The RFM describes the relationship between the image point coordinates (c, r) and the ground point coordinates (X, Y, H), which can be expressed as follows:
space coordinates and corresponding normalised object-space coordinates, respectively, and p1ijk, p2ijk, p3ijk, p4ijkare the 80 polynomial coefficients.The normalised coordinates can be expressed as follows:
0 0 space coordinates, the affine transformation compensated model is as Eq.(6) The least squares form of the RFM-compensated Eq. (5) and (6) can be represented in matrix form, as shown in Eq. (7).
0
ij ij j ij i ij
v A t B x l Pij (8)
where vij is the residual vector for the RFM compensated equations, Aij, Bij are the observation matrices for the RFM compensated equations, tj and xj are the unknown vectors to be determined, and lij is the approximation vector; Pij is the weight matrix.
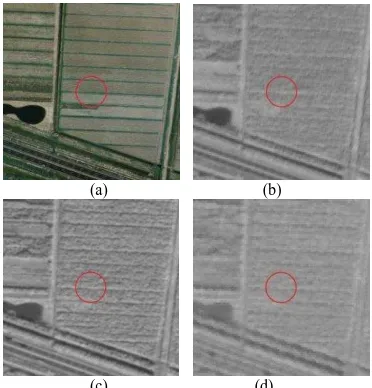
The GLAS points after selection will be used as conventional elevation control points for RFM adjustment model. According to the selection criteria, it is clear that the points located in the GLAS footprint with 70m diameter can be viewed as the same elevation with accuracy better than 1.0m. The registration between GLAS points and ZY-3 stereo images can be simplified to the images matching of ZY-3 stereo-images in the image space restrained to the 70m diameter circle by back-projection of the GLAS footprint, which is illustrated in Figure 1.
(a) (b)
(c) (d)
Figure 1. Registration between the GLAS footprint and ZY-3 stereo-images: (a) referenced DOM; (b) ZY-3 forward image; (c) ZY-3 nadir image; (d) ZY-3 backward image;. In (a) to (d) the circle represents the position of the GLAS footprint, and image matching is restricted to within the circle to obtain the vertical GCPs and the corresponding image points.
2.3 Correct the ZY-3 DSM using GLAS data
As high accuracy elevation control data, GLAS points also can be used to correct the DSM straight (Arefi and Reinartz, 2011), rather than the conventional block adjustment with control points, which is described in Part 2.2. The DSM is derived from stereo images by freedom adjustment and intensity matching (Abdalla et.al, 2010; Hobi and Ginzler,2012), and the workflow is showed in Figure 2.
ZY-3 three line arrays stereo images
Freedom Adjustment based on RFM
Generate compensated RPCs
Intensity stereo image matching
ZY-3 DSM Production
Figure 2. The workflow of ZY-3 DSM generation
According to the horizontal coordinate of ICESat/GLAS point, the corresponding elevation hDSMcan be interpolated from the DSM grids. The elevation difference can be calculated from Eq. (9), which can be described using linearity formula as Eq.(10).
h hGLAS
hDSM (9) h ahb (10) The coefficient of a and b can be fitted by the corresponding GLAS points and DSM elevation. Then, the new corrected DSM elevation can be calculated from Eq.(11).hnew
h h (11)3. EXPERIMENTAL AND ANALYSIS 3.1 Experimental data
In this article, two experimental dataset is implemented, and one is Taihang Moutain of China, another is Sainte-Maxime of France. First dataset contains block ZY-3 stereo images, and the second is only one scene stereo image with nadir, forward and backward. The GLAS data were downloaded from the National Snow and Ice Data Center in the United States (http://nsidc.org/data/ICESat/).
Taihang Moutain experimental region is located on the Hebei and Shanxi Province of China, the dataset area is covering 39.112°~42.073°N, 114.025°~116.085°E. There are more than 6000 GLAS points, which is illustrated on Figure 3, and the rectangle means the ZY-3 single scene covering area, red triangle represents the GLAS point.
GLAS Point Figure 3. The ZY-3 and GLAS points location in Taihang
Mountain experimental region
The experimental data in Sainte-Maxime of France is covering 43.031°~43.628°N,6.196°~ 6.968°E and the captured time is
27th,Aug 2014. There are some CPs (Check Points) with accuracy better than 0.5m, which are illustrated in Figure 4 .
Figure 4. Location of CP in the ZY-3 image of Sainte-Maxime of France
In order to evaluate and highlight the high elevation accuracy of selected GLAS points, some airborne LIDAR (Light Detection and Ranging) in Taiyuan viewed as referenced dataset is implemented. The absolute vertical accuracy of LIDAR points cloud was better than 0.15 m, which has been validated. The LIDAR cloud points located in the footprint of GLAS were collected, and deviation between GLAS and the average elevation was calculated.
3.2 GLAS data accuracy evaluation
The RMS of the deviation between the GLAS elevation and the average elevation of the LIDAR points cloud located in the GLAS footprint was determined to be 0.45m by statistical result from 786 GLAS points, and the minimum and maximum values of absolute elevation difference were 0.14m and 2.7m, respectively. The elevation deviation distribution is illustrated in Table 2. They prove that the footprint of GLAS after selection by some criterion has very high elevation accuracy,
which can be viewed as reference to evaluate the accuracy of ZY-3 DSM dataset.
Table 1. Statistical results for the deviation between GLAS and LIDAR average elevation.
Abs of dH (Unit: m) Number Percentage
<0.20 156 19.8%
<0.40 339 43.1%
<0.50 397 50.5%
<0.80 563 71.6%
<1.0 647 82.3%
3.3 ZY-3 elevation evaluation
The distribution of the horizontal and vertical GCPs, together with the check points, are illustrated in Figure.5. The planimetric and elevation accuracies without any GCPs (type H1) in Taihang Mountain were 18.062 m and 7.038 m, respectively; the mean elevation error was -3.697 m when using 38 check points. When 14 horizontal GCPs were added, but without the use of vertical GCPs (type H2), the planimetric accuracy improved to 5·058 m, while the elevation accuracy showed relatively little improvement. In type V1, by using 23 GLAS vertical control points spaced approximately 50 km apart along the three GLAS tracks, but without the use of any horizontal GCPs, the elevation accuracy improved to 2.308m and the mean error reached -0.402m, but the planimetry accuracy did not improve dramatically. During the type V2 adjustment, both the horizontal and vertical accuracy showed equivalent results to the combinations of types H2 and V1. All the result is showed in Table 2.
2.0 2.5 3.0 3.5 4.0 4.30
4.35 4.40 4.45 4.50
Vertical GCP Horizontal GCP
Check point
East (m)
5
10
North (m)
6
10
Figure5. The point distribution for block adjustment experiment in the Taihang Mountain region. The vertical GCP
is derived from GLAS points, horizontal GCP and CP are determined by GPS field surveying.
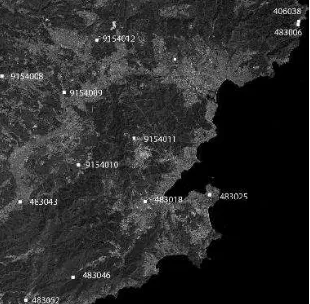
The dataset in Sainte-Maxime of France contains 12 CPs and 3 GLAS elevation control points during the block adjustment in Figure 6. There is part of sea water in the eastern south of the image, so it is blank without any GCPs or CPs.
Also, the second method to improve elevation accuracy of ZY-3 stereo images is implemented. Firstly, the DSM without GCPs but by freedom adjustment and intensity image matching is The International Archives of the Photogrammetry, Remote Sensing and Spatial Information Sciences, Volume XLI-B1, 2016
presented and the interval is about 15m with WGS84 ellipsoid datum.Then elevation correction is calculated by fitting the
linear elevation error formal coefficients a and b, which is illustrated on Figure 7.
Table 2. Statistical table of Taihang Mountain ZY-3 stereo block adjustments supported by GLAS data.
Region Adjustment
East North Planimetry Height
Taihang
Figure 6. The illustration of GCPs and CPs distribution in France-Sainte Maxime
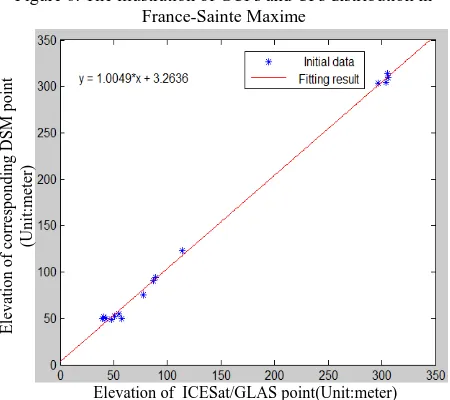
Figure 7. The elevation illustration of ICESat/GLAS points and corresponding DSM points; The red line is the fitting result according to Eq.(10), in which a = 1.0049, b = 3.2636.
In the Sainte-Maxime of France experimental region, the initial elevation accuracy is about 5.61m and maximum error is 12.52m, and the RMS of adjustment result using GLAS as elevation control points is 3.12m and maximum error is 6.51m, while the RMS of correcting DSM by GLAS linear fitting only reduced to 5.13m and maximum error is 7.92m.
4. CONCLUSION
As the first laser altimeter satellite, the elevation accuracy of ICESat/GLAS is attractive, which can used as control data after selection by some criteria. In this article, the GLAS points located on the flat terrain with single and narrow Gaussian waveform feature are selected as elevation control points for
ZY-3 stereo images. The statistical result of Taiyuan region shows that the RMS of selected GLAS points is better than 0.5m according to the high accuracy LIDAR reference data. Also, the two methods to improve the ZY-3 elevation accuracy have different result. Both of them can improve the elevation accuracy, while the conventional RFM and bias-compensated model is better than correcting DSM by GLAS straight. Without other ground control points, the elevation accuracy of ZY-3 reviews for their constructive comments and suggestions.
REFERENCES
Abdalla Alobeid, Karsten Jacobsen, Christian Heipke,2010.
Comparison of Matching Algorithms for DSM Generation in Urban Areas from Ikonos Imagery. Photogrammetric
Engineering & remote Sensing, 76(9):1041-1050.
Arefi H, Reinartz P, 2011. Accuracy Enhancement of ASTER Global Digital Elevation Models Using ICESat Data. Remote
Sensing, 3(7):1323-1343.
Atwood, D. K., Guritz, R. M., Muskett, R. R., Lingle, C. S., Sauber, J. M. and Freymueller, J. T., 2007. DEM control in Arctic Alaska with ICESat laser altimetry. IEEE Transactions
on Geoscience and Remote Sensing, 45(11): 3710–3720.
Brenner, A. C., Zwally, H. J., Bentley, C. R., Csathó, B. M., Harding, D. J., Hofton, M. A. and Minster, J.-B., 2011. Geoscience Laser Altimeter System: derivation of range and range distributions from laser pulse waveform analysis for surface elevations, roughness, slope, and vegetation heights. Algorithm Theoretical Basis Document, Version 5.0. University of Texas at Austin, USA. 125 pages.
Cao, J., Yuan, X. and Gong, J., 2015. In-orbit geometric calibration and validation of ZY-3 three-line cameras based on CCD-detector look angles. Photogrammetric Record, 30(150): 211-226.
D'Angelo, P, 2013. Evaluation of ZY-3 for DSM and Ortho Image Generation. ISPRS International Archives of the Photogrammetry, Remote Sensing and Spatial Information
Sciences, XL-1/W1:57-61.
Duong, V. H., Lindenbergh, R., Pfeifer, N. and Vosselman, G., 2008. Single and two epoch analysis of ICESat full waveform data over forested areas. International Journal of Remote
Sensing, 29(5): 1453–1473.
Fraser, C.S. and Hanley, H.B., 2005. Bias-compensated RPCs for sensor orientation of high-resolution satellite imagery.
Photogrammetric Engineering & Remote Sensing, 71(8): 909–
915.
Fricker, H. A., Borsa, A., Minster, B., Carabajal, C., Quinn, K. and Bills, B., 2005. Assessment of ICESat performance at the Salar de Uyuni, Bolivia. Geophysical Research Letters, 32: L21S06. doi:10.1029/2005GL023423.
Gardner C S, 1992. Ranging Performance Of Satellite Laser Altimeters. IEEE Transactions on Geoscience & Remote
Sensing, 30(5):1061-1072.
Gonzalez, J. H., Bachmann, M. and Scheiber, R., 2010. Definition of ICESat selection criteria for their use as height references for TanDEM-X. IEEE Transactions on Geoscience
& Remote Sensing, 48(6): 275-277.
Grodecki, J. and Dial, G., 2003. Block adjustment of high-resolution satellite images described by rational polynomials.
Photogrammetric Engineering & Remote Sensing, 69(1): 59–68.
Hobi, M. L., and C. Ginzler. 2012. Accuracy Assessment of Digital Surface Models Based on WorldView-2 and ADS80 Stereo Remote Sensing Data. Sensors, 12(5): 6347–6368. Kurtz, N. T., Markus, T., Cavalieri, D. J., Krabill, W., Sonntag, J. G. and Miller, J., 2008. Comparison of ICESat data with airborne laser altimeter measurements over Arctic sea ice. IEEE
Transactions on Geoscience and Remote Sensing, 46(7): 1913–
1924.
Li, D. 2012. China’s first civilian three-line-array stereo mapping satellite: ZY-3. Acta Geodaetica et Cartographica
Sinica, 41(3): 317–322.
Li,G.Y., Tang,X.M., Gao,X.M., Wang,H.B., 2016. ZY-3 Block Adjustment Supported by GLAS Laser Altimetry Data. The
Photogrammetric Record, 31(153): 88-107. DOI:
10.1111/phor.12138.
Martin, C. F., Thomas, R. H., Krabill, W. B. and Manizade, S. S., 2005. ICESat range and mounting bias estimation over precisely-surveyed terrain. Geophysical Research Letters,32: L21S07. doi:10.1029/2005GL023800.
Schutz,B.E, Zwally,H., Shuman,C.,Hancock,D.,Dimarzio,J. 2005.Overview of the ICESat Mission. Geophysical Research
Letters, 32(21):97-116.
Tang, X.M., Zhang, G., Zhu, X., Pan, H.., Jiang, Y., Zhou, P., Wang, X. and Guo, L., 2012. Triple linear-array imaging geometry model of ZiYuan-3 surveying satellite and its validation. Acta Geodaetica Cartographica Sinica, 41(2): 191– 198.
Tang, X.M., Zhou, P., Zhang, G., et al, 2015.Verification of ZY-3 Satellite Imagery Geometric Accuracy Without Ground Control Points. IEEE Geoscience & Remote Sensing Letters, 12(10): 2100-2105.
Tao, C.V. and Hu,Y., 2001. A comprehensive study of the rational function model for photogrammetric processing.
Photogrammetric Engineering & Remote Sensing, 67(12):
1347–1357.
Teo,T.A., 2011. Bias compensation in a rigorous sensor model and rational function model for high-resolution satellite images.
Photogrammetric Engineering & Remote Sensing, 77(12):
1211–1220.
Tong,X., Liu,S. and Weng,Q., 2010.Bias-corrected rational polynomial coefficients for high accuracy geo-positioning of QuickBird stereo imagery. ISPRS Journal of Photogrammetry
and Remote Sensing, 65(2): 218–226.
Wang, T., Zhang, G., Li, D. Tang, X., Jiang, Y., Pan, H., Zhu, X. and Fang, C., 2014. Geometric accuracy validation for ZY-3 satellite imagery. IEEE Geoscience and Remote Sensing Letters, 11(6): 1168–1171.
Wang,X., Cheng,X., Gong,P., Huang,H., Li, Z. and Li,X., 2011. Earth science applications of ICESat/GLAS: a review.
International Journal of Remote Sensing, 32(23): 8837-8864.
Wen, H., Liu, H. and Chang, X., 2011. Accuracy assessment of ICESat laser altimetry data using GPS measurements.
Geomatics and Information Science of Wuhan University, 36(3):
262–266.
Zwally, H. J., B. Schutz, W. Abdalati, J. Abshire, C. Bentley, A. Brenner, J. Bufton, et al. 2002. ICESat’s Laser Measurements of Polar Ice, Atmosphere, Ocean, and Land. Journal of
Geodynamics, 34: 405–445.