INFORMATION EXTRACTION OF HIGH-RESOLUTION REMOTELY SENSED IMAGE
BASED ON MULTIRESOLUTION SEGMENTATION
SHAO Peng a, YANG Guodong a, NIU Xuefeng a, *, ZHANG Xuqing a, ZHAN Fulei a, TANG Tianqi a
a
College of Geoexploration Science and Technology, Jilin University, Changchun City,
Jilin Province, 130026, [email protected],[email protected],[email protected],
zxq@ jlu.edu.cn,[email protected],[email protected]
KEY WORDS: Edge-detection, Object-oriented. Multiresolution segmentation, Spectral features, Geometrical features, Confusion matrix
ABSTRACT:
The principle of multiresolution segmentation was represented in detail in this study, and the canny algorithm was applied for edge-detection of remotely sensed image based on this principle. The target image was divided into regions based on object-oriented multiresolution segmentation and edge-detection. Further, object hierarchy was created, and a series of features (water bodies, vegetation, roads, residential areas, bare land and other information) were extracted by the spectral and geometrical features. The results indicates that edge-detection make a positive effect on multiresolution segmentation, and overall accuracy of information extraction reaches to 94.6% through confusion matrix.
* Corresponding author: NIU Xuefeng(1970-),male, associate professor, engaged in photogrammetry and remote sensing date processing ,E-mail:[email protected].
1. INTRODUCTION
In recent years, high-resolution satellite remote sensing technology has been developing rapidly, the high resolution satellite image has spectral, geometry, space, texture, and other information. Traditional pixel-based information extraction methods use only the spectral information, it is difficult to overcome the phenomenon widespread in the image that the same bodies have different spectrum, different bodies have the same spectrum. Therefore, the information extraction technology which is suitable for high-resolution remote sensing image based on multiresolution segmentation of object-oriented has become inevitable.
Since 2000, more and more scholars attend to multiresolution segmentation based object-oriented information extraction method. Winhauck used this method with the traditional method of visual interpretation of SPOT data for comparison identification results show that the classification accuracy is better than the former Winhauck,2000 . Hofmann combined spectrum of the object, texture, shape with the background information to improve the classification accuracy of the residential areas in IKONOS image (Hofmann, 2001). Benz thinks that object-oriented extraction method in high-resolution remote sensing images improve the efficiency of automatic extraction potential (Benz, 2004). W. Myint, used pixel-based extraction method and multiresolution segmentation method on object-oriented for extracting an QuickBird satellite image respectively, the results show that the former accuracy is only 63.33%, while the latter is up to 90.04% (Soe, 2011). Du Fenglan discussed the application of this method in the information extraction of IKONOS image (Du, 2004). Sun Xiaoxia used object-oriented methods to extract river and road from IKONOS images panchromatic (Sun, 2006). Zhou Chunyan taked the Object-oriented technique to extract
high-resolution remote sensing images for land use classification,which overcomes the traditional method of salt and pepper effect , increased the overall accuracy than the method of maximum likelihood (Zhou, 2008). Tao Chao takes grading extraction for the city buildings based on this method (Tao, 2010). Chen Jie studied the multiresolution segmentation of multispectral image and object-oriented extraction method which is based on rough sets and supports vector machine .In a word, the object-oriented extraction method based on the multiresolution segmentation breakthroughs the limitation of traditional method, and achieved good results; it has great development potential in information extraction of more and more abundant high resolution images, and is worth in-depth study.
In this study, Korea resources an area of ZY-3 satellite image data as an example to study the information extraction method based on multiresolution segmentation, the canny algorithm is used to detect the edge of the image first, and the results will be assisted in the original image multiresolution segmentation. The spectral characteristics and the geometry features will be used to extract ground object information.
2. PRINCIPLE AND METHODS
2.1 Multiresolution Segmentation
Image segmentation is the processes of dividing image area into non-overlapping and non-empty regions; within the region they have the same or similar features, which can be gray-scale, color, texture, and other features. Multiresolution segmentation using the region merging algorithm whose heterogeneity is smallest, firstly incorporates a single pixel smaller image objects, and then merges smaller image objects into a larger polygon object, the heterogeneity of the polygon object which
The International Archives of the Photogrammetry, Remote Sensing and Spatial Information Sciences, Volume XL-4/W3, 2013 ISPRS/IGU/ICA Joint Workshop on Borderlands Modelling and Understanding for Global Sustainability 2013,
is increasing In the process of the segmentation is smallest, makes the whole image objects’ average heterogeneity smallest in the case of a given dimension threshold segmentation. At the time of the partitioning, consider scale factor, spectral heterogeneity and shape of heterogeneity. Scale parameter is used to measure the maximum number of heterogeneous change as measuring mergers of two objects; the square of this value is a condition to stop the merger. When of the value of the heterogeneity is less than the square of the scale parameter it continues to merge, otherwise, stop the merger. The greater the scale, the greater the resulting object. vice versa. Characterization of shape heterogeneity has two parameters: smoothness hsm and compact degree hcm. The smoothness represents the smooth degree of combined object, the compact degree assurances the combined object more compact. The measurement principles of Spectral heterogeneity and shape heterogeneity are as follows:
Combination of the two measurement criteria is shown in formula (1):
1
where ω = spectral heterogeneity weights, Its value is 0 to 1 Spectral parameter heterogeneity is shown in formula (2):
2
where = number of bands =Layer weights
= standard value of the spectral bands
If the standard and the area of located between two adjacent regions are designated as , , , , split merge band weights is ,then the combined area and the variance
of the region are shown in formula (3):
(3)
the measure parameter of shape heterogeneity is shown in formula (4):
4
where l = perimeter area
b = the perimeter of the minimum bounding rectangle n = the area of minimum bounding rectangle
If l and b of the located between two adjacent regions are , , , respectively, combined shape parameters hsmooth,
hcompac are shown as follows:
5
6
Final shape heterogeneity available of hsmooth, hcompac are as follows:
7
Generally spectral information is most important, the factor weights of spectrum should be designated larger as soon as possible. Shape factor generates the boundary of the object to have good smoothness and compactness, and improves the integrity of the object. The stop condition of image segmentation is determined by the scale parameter, which is depended on the interest information.
2.2 Information Extraction
Extracting information based on multiresolution segmentation, obtaining the objects by multiresolution segmentation first, and then to comprehensively extract information by considering the spectrum , shape, size, texture, topology and context characteristics of the object. The smallest unit of Image processing is not a single pixel, but the object obtained by segmentation, and the subsequent extraction of the image is based on the object. The descriptions of the common characteristics are as follows.
(1)Spectral features
The common spectral features include the mean value, Brightness and Standard deviation. The mean value is obtained by calculating all values of pixels of image object layers. Brightness refers to the sum of the layers average value divided by the number of the image object layers. All pixels by constitute an image object layer value to calculate the standard deviation.
(2) Geometrical features
Geometric features are based on the spatial distribution statistics of pixels constituting the image object .Covariance matrix can be used as a core tool for statistical processing. The Geometric features of the object can also be provided appreciatively length , width , the area and the filling degree by the bounding box. The main geometrical features include length, width, area, length / width, density, shape index. The area of a single pixel is 1,the area of a object is its number of pixels. Length and width are the eigenvalues of covariance matrix, and can also be approximatively instead of the object's
The International Archives of the Photogrammetry, Remote Sensing and Spatial Information Sciences, Volume XL-4/W3, 2013 ISPRS/IGU/ICA Joint Workshop on Borderlands Modelling and Understanding for Global Sustainability 2013,
bounding box. Aspect ratio is the ratio of the covariance`s eigenvalues, and calculated approximatively by the bounding box, and whichever is the lowest value as the characteristic value. Density describes the compactness of the image object, the object the more it tends to square the greater the density. Shape index describes the smoothness of the boundary of the object, the more broken image object, the greater its value. It is described by boundary length (Sum of an image object and the other co-owner of the image boundary or edge of the entire image) of an object divided by the square root of its area four times.
3. INFORMATION EXRACTION
3.1 Study Area and Data Sources
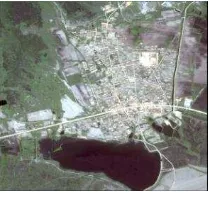
Experimental data is a regional resource Korea ZY-3 image (Figure 1). Satellite on January 9, 2012 launch, satellite face panchromatic resolution is 2.1 m images, Satellite multispectral (blue, green, red) is 5.8 m, the coordinate system is WGS_1984. The region is part zone, located in the border, and the main feature information are complete, including water bodies, vegetation, residential areas, roads, bare land, etc.
Figure 1. Original image 3.2 Multiresolution Segmentation
In this study for multiresolution segmentation is not like before when the researchers only do the original image segmentation, but Join the auxiliary segmentation edge information. In consideration of Canny Operator have large signal to noise ratio, as well as to detect the location and the edge of the image on the edge of the real position is relatively approximate and the advantages of single edge response. This test use canny operator to edge detection of image layer, layer 3. The result is shown in figure 2.It can be seen in the figure that edge is obvious. It is advantageous to the subsequent multiresolution segmentation, especially for road extraction .Use the edge of auxiliary segmentation, Parameter was set to a weight of each layer canny, R, G, and B were 5,1,1,1 respectively, scale parameter was 30, shape of the heterogeneous degree was 0.1(spectral heterogeneity degree was 0.9), compactness and smoothness both were 0.5. Features of the object was not broken in this scale, all kinds of features were integral. It is advantageous to the subsequent information extraction. When the segmentation results compared with the results of without using edge in segmentation, as shown in figure 3, it can be seen that under the same parameters auxiliary resulting object segmentation edge information more integral, more conducive to the subsequent information extraction.
Figure 2. canny edge detection (partial)
Figure 3. Same scale Multiresoulution segmentation results contrast Left with edge information and right without edge
information 3.3 Main Feature Extraction
3.3.1 Water body extraction: As the water in the image is on the performance of dark tones, band means, brightness, and other spectral feature can be used in extraction, the mean of layer 3 and the custom feature B were used.
(8)
3.3.2 Vegetation extraction: Since the experimental data is not near-infrared bands, NDVI cannot be used to extract vegetation information, thus the mean of Layer 3 and custom features green band ratio G were used.
(9)
3.3.3 Road extraction: Road spectrum characteristics and residents are similar, using the spectral feature is not easy to extract. Road on the image show the long strip, the object's shape index, compactness, density and aspect ratio were used to extract road.
3.3.4 Residential areas extraction:Because the reflectance of Residential areas is higher, and buildings are usually similar to rectangles, using the brightness, shape index and rectangular fit to extract residential areas.
The International Archives of the Photogrammetry, Remote Sensing and Spatial Information Sciences, Volume XL-4/W3, 2013 ISPRS/IGU/ICA Joint Workshop on Borderlands Modelling and Understanding for Global Sustainability 2013,
3.3.5 Bare land and other extraction:the reflectance of Bare land and other is higher, using the brightness and the custom feature B to extract residential areas.
The rules of information extraction are shown in table 1 and the results are shown in Figure 4- Figure 8.
Information Category
Extraction Rules
Water B is more than0.04
Layer is less than84 Vegetation G is more than0.34 Layer is less than80 Road Shape index is more than7
Compactness is more than6 density is less than1 Length/width is more than6 Building Brigthness is more than140 Shape index is more than5 Rectangular fit is more than0.5 Bare Land Brigthness more is than120
B is more than-0.03
Table 1. Information extraction rule table
Figure 4.Water Figure 5.Vegetation
Figure 6.Road Figure 7.Building
Figure 8.Bare Land
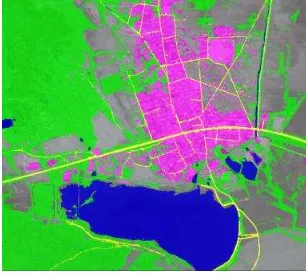
Finally, the features were misclassified were corrected through the human-computer interaction function. The vector data was Exported, and added together with the original image to make comparative analysis. The results are shown in figure 9 - figure 11.
Figure 9. Results of information extraction
Figure 10. Vector
Figure 11. Vector with the original image overlay
The International Archives of the Photogrammetry, Remote Sensing and Spatial Information Sciences, Volume XL-4/W3, 2013 ISPRS/IGU/ICA Joint Workshop on Borderlands Modelling and Understanding for Global Sustainability 2013,
Use
class Water Vegetation Road Bare
Confusion matrix was used to make accuracy evaluation for the result of the information extraction. When the confusion matrix is m rows m columns of the matrix, for the diagonal elements, the greater the extraction precision is higher, for the element not on the diagonal; the greater the extraction accuracy is lower. This experiment has selected sample areas on the original image to calculate confusion matrix, the results are shown in table 2, and the overall accuracy reaches to 0.946.
4. CONCLUSION
This study used the image of North Korea from Resources Satellite ZY-3, the canny algorithm was taken in image edge-detection to improve the effect of multiresolution segmentation. taking advantage of the result of using edge-detection in multiresolution segmentation is better on extracting information. The combine of noise areas and adjacent pixel in multiresolution segmentation eliminate the noise, moreover, solve local singularity problem and pepper-salt phenomenon of image. Feature over and over again, obtaining the main object extracting parameter setting: water: B is more than 0.04,layer is less than 84; vegetation: G is more than 0.34, layer 3 is less than 80;road : compactness is more than 6, density is less than 1, length/width is more than 6; residential area: brightness is more than 140, shape index is more than 5, rectangular fit is more than 0.5;bare land Brightness is more 120, B is more than -0.03.The overall accuracy reaches to 94.6%.In brief, information extraction based on multiresolution segmentation method simulate the human brain's cognitive process, and the spectrum geometry and texture information of images are taken into account, the extraction results on the high resolution remotely sensed image are significant.
Acknowledgement
This study was supported by the National Science and Technology Support Program "Digital Peripheral Geopolitical Environment Construction and key Technology Research" project. In addition, we wish to express our gratitude to Prof
Chen Jun, the National Basic Geographic Information Center, and other colleagues in the subject group.
References
Benz U C, Hofmann P, Willhauek G, et al. Mufti-resolution, object-oriented fuzzy analysis of remote sensing data for GIS-ready information[J]. ISPRS Journal of Photogrammetry and
Remote Sensing, 2004, 58(3-4):239-258.
Du Fenglan, Tian Qingjiu, Xia Xueji, etc. Object-oriented feature classification analysis and evaluation [J]. Journal of
remote sensing technology and application
[J],2004,19(1):20-24.
Hofmann P. Detecting informal settlements from IKONOS data using methods of object oriented image analysis-an example from Cape Town(South Africa). In: Jurgens C.(Editor):Remote
Sensing of Urban Areas /Femerkundung in
urbanen,Raumen.Regensburg. 2001.
Soe W. Myint, Patricia Gober, Anthony Brazel, Susanne Grossman-Clarke, Qihao Weng. Per-pixel vs. object-based classification of urban land cover extraction using high spatial resolution imagery. Remote Sensing of Environment xxx (2011) xxx–xxx
Sun Xiaoxia,Zhang Jixian,Liu Zhengjun. Using the object-oriented classification method from IKONOS panchromatic images to extract the rivers and roads [J]. Science of Surveying
and Mapping, 2006,31(1):62-63.
Tao Chao, Tan Yihua, Cai Huajie, etc. Object-oriented high-resolution remote sensing image of city building hierarchical extraction method [J]. Journal of Surveying and Mapping, 2010,39 (1):39-45.
Willhauek G. Comparison of object oriented classification techniques and standard image analysis for the use of change detection between SPOT multispectral satellite images and aerial Photos. International Arehives of Photogrammetry and
Remote Sensing, XXXlll, PartB3, Amsterdam, 2000.
Zhou Chunyan, Wang ping, Zhang Zhenyong, etc. Based on object oriented city coin land use classification information extraction technology [J]. Remote Sensing Technology and
Application,2008,23(1):31-35.
The International Archives of the Photogrammetry, Remote Sensing and Spatial Information Sciences, Volume XL-4/W3, 2013 ISPRS/IGU/ICA Joint Workshop on Borderlands Modelling and Understanding for Global Sustainability 2013,