FUZZY LOGIC-SUPPORTED DETECTION OF COMPLEX GEOSPATIAL FEATURES
IN A WEB SERVICE ENVIRONMENT
Lianlian He a, b, Liping Di a, Peng Yue c,*, Mingda Zhang c
a Center for Spatial Information Science and Systems (CSISS), George Mason University, Fairfax, VA, USA
b School of Mathematics and Statistics, Wuhan University, China
c State Key Laboratory of Information Engineering in Surveying, Mapping and Remote Sensing, Wuhan University,
China- [email protected]
KEY WORDS: Fuzzy Logic, Geoprocessing Workflow, Remote Sensing Imagery, Complex Geospatial Feature, Geospatial Service
ABSTRACT:
Spatial relations among simple features can be used to characterize complex geospatial features. These spatial relations are often represented using linguistic terms such as near, which have inherent vagueness and imprecision. Fuzzy logic can be used to modeling fuzziness of the terms. Once simple features are extracted from remote sensing imagery, degree of satisfaction of spatial relations among these simple features can be derived to detect complex features. The derivation process can be performed in a distributed service environment, which benefits Earth science society in the last decade. Workflow-based service can provide on-demand uncertainty-aware discovery of complex features in a distributed environment. A use case on the complex facility detection illustrates the applicability of the fuzzy logic-supported service-oriented approach.
1. INTRODUCTION
More than 150 Earth observation satellites are currently on orbits measuring the state of the Earth (Tatem, 2008). Remote sensing data has gained tremendous importance in various application domains such as geospatial feature update and WMD (Weapon of Mass Destruction) proliferation site detection in safeguard applications. The overwhelming volume of routine image acquisition has greatly outpaced the increase in the capacity of manual image interpretation by intelligence analysts. Automated methods or intelligent systems are needed to reduce the workload of human intelligence analysts and increase the possibility of prompt detection of interested geospatial features.
Complex geospatial features are spatially composed of elementary (simple) ground features. For example, a nuclear facility consists of a group of ground features, e.g., buildings for hosting fuel concentration machines, cooling towers, transportation roads, and fences. Such spatial semantics, or named spatial patterns (Yang et al., 2010, 2011) can be used to discover complex geospatial features from imagery. There are substantial studies on extraction of simple features, such as buildings and roads, from remotely-sensed data (Gruen et al., 1995; Baltsavias, 2004; Awrangjeb et al., 2010). The research on automatic discovery of complex geospatial features is still
rather understudied. Our previous work suggests a “two steps of feature detection” approach, with step 1 being to identify the
location and type of elementary ground features (such as buildings and roads) from high-resolution imagery, which has well-developed technologies, and step 2 being to extract high-level semantic information (such as nuclear fuel concentration sites and manufacturing factory facilities) by discovering compound (complex) ground features from spatial relationships among the elementary features (Yue et al., 2012). We have investigated how complex feature semantics, in particular
spatial relations among simple features, can be exploited to guide workflow modeling in a service computing environment.
However, imprecision and uncertainty associated with spatial relations are not addressed in the workflow-based approach. For example, when the spatial pattern specifies that containment
buildings are near cooling towers, the linguistic term “near” can
be denoted as “fuzzy” relationships due to its inherent vagueness and imprecision associated with natural language expressions (Bloch, 2005; Hudelot et al., 2008). The degrees to which these statements hold can be determined by fuzzy services that refer to specific fuzzy membership functions. This provides flexibility of using different membership functions by on-demand integration of services. The degree of satisfaction of each spatial relation is recorded for each simple feature. Finally, the degree of a feature to satisfy those constraints is determined using a conjunctive manner (i.e. a t-norm) (Zimmermann, 2001) of degrees for those relations, which is also implemented as a service. These services are chained as workflows. They are reusable and can provide on-demand uncertainty-aware discovery of complex features in a distributed environment. A complex features can be identified by one type of its elementary features (e.g., building) following the specific spatial
International Archives of the Photogrammetry, Remote Sensing and Spatial Information Sciences, Volume XL-4/W2, 2013 ISPRS WebMGS 2013 & DMGIS 2013, 11 – 12 November 2013, Xuzhou, Jiangsu, China
relationships with other types of elementary features. Given the assumption that all elementary features (e.g., building, roads, and ponds) can be extracted from images, discovering complex features on images can be decomposed into a series of steps computing spatial relations among elementary ground features in a specific area. The computational steps are formalized using workflows, where each step is implemented by a spatial relation computation service.
Figure 1. Example of a complex feature
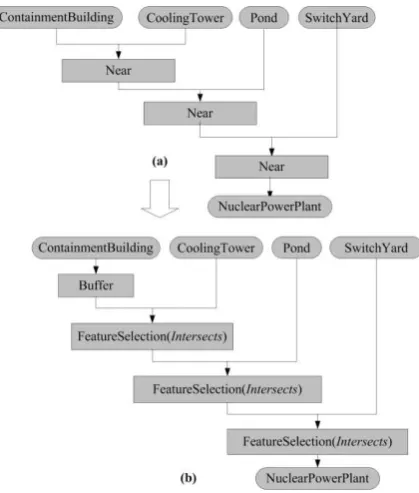
Taking a nuclear power plant (NPP) as an example, it includes the following parts: containment building, cooling tower, pond, and switch yard (Figure 1). They follow the near relation. In the workflow approach, the conjunctions of a set of spatial relations in characterizing the spatial pattern of a complex feature can be formalized through workflow descriptions, as shown in Figure 2a. If we define services for implementing each binary spatial relation, then a service chain to discover possible NPPs, called a workflow, can be represented as follows: representation of the workflow implies that when elementary features are generated from remote sensing images, the spatial analysis services with specific spatial operators need only be defined appropriately to compute spatial relations in order to find the sites of the complex features. However, relations such as near are vague. In a crisp approach, “fuzzy” relations could be further refined using unambiguous primitive operators. Primitive relations such as those stated in the OGC simple feature specification are well defined. It follows the nine-intersection topological relationship models (Egenhofer & Herring, 1990), and includes the following primitive relationships (operators): equals, disjoint, intersects, touches, crosses, within, contains, and overlaps (Herring, 2011). Figure 2b shows the final workflow generated following a crisp approach. Each analysis step in the workflow is implemented as
a service in a Web environment. Such a service-oriented Web environment allows dynamic discovery of geoprocessing services as well as feature inputs to service chains in supporting the on-demand detection of complex features.
Figure 2. Workflow formulation – a crisp approach
3. MODELLING FUZZINESS OF SPATIAL RELATIONS
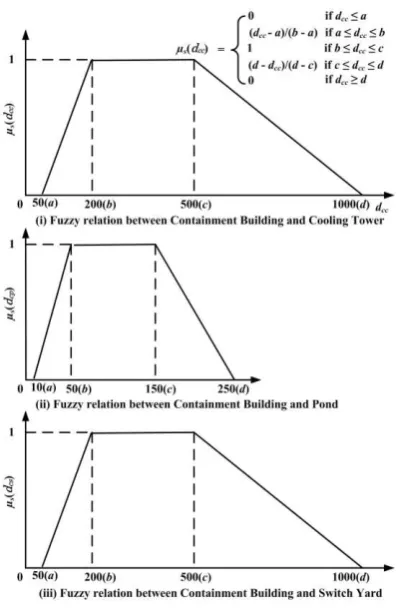
Rather than a crisp approach that uses a sharp distance to determine the near relation, we can support fuzzy representations by representing the imprecision associated with definitions of spatial relations. Fuzzy logic, in particular, the theory of fuzzy sets, allows to model spatial relations using a partial degree of membership, i.e. the membership is a matter of degree. There are various ways on fuzzy representation of but not more than 1000 meters. The elementary features will not be considered when the distance (dcc) between containment building and cooling tower is below 100 meters or beyond 2000 meters. The membership function for the near relation between containment building and cooling tower can be defined as
Similary, we could define different intervals for modeling fuzzy relations between building and pond (Figure 3ii), as well as building and switch yard (Figure 3iii). They are linked to
International Archives of the Photogrammetry, Remote Sensing and Spatial Information Sciences, Volume XL-4/W2, 2013 ISPRS WebMGS 2013 & DMGIS 2013, 11 – 12 November 2013, Xuzhou, Jiangsu, China
trapezoidal fuzzy sets shown in Figure 3. Once variables such as a, b, c, and d, are defined for intervals, a generalized form of the trapezoidal membership function for µs(dcc) is shown in Figure 3.
Assuming the universe of discourse of dcc is denoted as DCC, a fuzzy set S in DCC could then be defined as a set of pairs.
S = { dcc, µs(dcc) | dcc DCC } (3)
When doing the fuzzy inference, the input is a crisp value calculated using the distance computing operator from GIS. The output is a fuzzy degree of the membership in the fuzzy set. The degree is usually a real number between 0 and 1.
Figure 3. Trapezoidal fuzzy sets
4. SUPPORTING FUZZY LOGIC IN A GEOSPATIAL SERVICE ENVIRONMENT
A geospatial service environment follows the component-based software engineering principle. Individual geospatial services are reusable and loosely-coupled. They can be plugged in flexibly at each step of geoprocessing workflows to support on-demand feature discovery. This provides possibilities to use different services and workflows for feature discovery. The degree of satisfaction of each spatial relation could be determined by combining geospatial distance computing services and specialized services that can map distances to degrees according to special membership functions.
The degree of satisfaction of multiple spatial relations is a conjunctive combination of those degrees using a norm. A t-norm (triangular t-norm) is an intersection or conjunction of two fuzzy sets (Zimmermann, 2001). It could be implemented using different operators such as minimum or product t-norms. Thus the uncertainty of complex features can be determined by a t-norm computation service that calculates a conjunctive degree
of one type of its elementary features (e.g., building) satisfying the specific spatial relationships with other types of elementary features. Figure 4 shows a service chain to support uncertainty-aware discovery of complex features. It connects distance analysis, membership function, and t-norm services together to generate a list of features, each of which has its uncertainty value recorded.
Figure 4. An uncertainty-aware service chain for discovering complex features
Although the paper assumes that elementary features are already generated from images, it is also possible to add degree of membership to a type of elementary features. For example, if the percentage of buildings detected from images by a specific algorithm is 80 percent, the degree of a feature to be a building could be 0.8. The degree can also join the t-norm operation for a more comprehensive uncertainty evaluation.
5. WALK THROUGH EXAMPLE
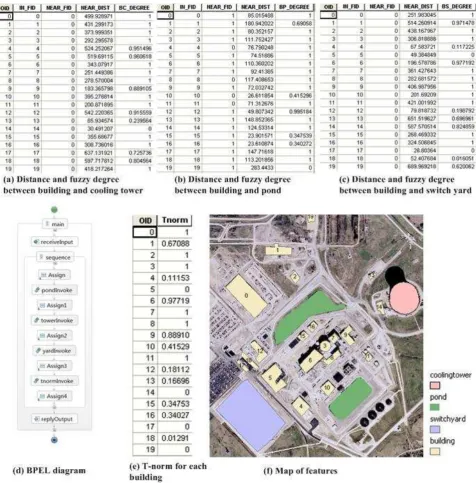
We use a NPP facility as an example to help demonstrate the approach. Assuming elementary features are already extracted from the image, there are four types of elementary features (i.e., building, cooling tower, pond, and switch yard) in Figure 5. They feed as inputs to the workflow in Section IV. Figure 5a shows the distance (the field NEAR_DIST) from each building to its nearest cooling tower. The field IN_FID is the feature ID of the building. The field NEAR_FID is the feature ID of the cooling tower. The field BC_DEGREE is the fuzzy degree using fuzzy sets defined in Section III. Similarly, Figure 5b and 5c show the analysis results between building and pond, as well as building and switch yard. The whole process could be automated using the BPEL workflow in Figure 5d.
Once all fuzzy degrees are available, Figure 5e shows the analysis result using the product t-norm, i.e. the multiplicative conjunction. Figure 5f labels all the buildings using the feature ID. The feature IDs for buildings with t-norm values 1 or near 1 are 0, 2, 3, 6, 7, 8, 9, and 11. They could be containment buildings. Buildings with ID 15, 16, and 10 have low t-norm values, since they are too close to ponds. Buildings with ID 4, 5, 12, 13, 14, 17, and 18 are either too close to the cooling tower or switch yard. The feature with ID 19 is too far away from ponds. So these buildings are less possible to be containment buildings.
International Archives of the Photogrammetry, Remote Sensing and Spatial Information Sciences, Volume XL-4/W2, 2013 ISPRS WebMGS 2013 & DMGIS 2013, 11 – 12 November 2013, Xuzhou, Jiangsu, China
Figure 5. The workflow for the NPP case
The analysis results could be refined by providing more constraints on input features. For example, not all buildings are necessary to be analyzed. A containment building is cylindrical and has a dome-shaped roof. Such characteristics could be used as constraints to limit input buildings to be analyzed. If such constraints are added, the detection results from the fuzzy analysis could be improved in precision.
6. CONCLUSION
This paper presents a fuzzy logic-supported approach for detection of complex geospatial features in a geospatial service environment. Both fuzzy membership functions and t-norm operators can be provided as services and incorporated into workflows on demand to automate the detection process. The fuzzy degree conveyed with features help address uncertainty in
the feature detection from remote sensing imagery. Future work will investigate how fuzzy logic could be combined with geospatial ontologies to automate the workflow generation and service chaining.
ACKNOWLEDGMENT
Part of the work was supported by U.S. Department of Energy (grant #DE-NA0001123, PI: Prof. Liping Di), National Basic Research Program of China (2011CB707105), and Project 41271397 supported by NSFC.
REFERENCES
Awrangjeb, M., Ravanbakhsh, M., Fraser, C. S., 2010. Automatic detection of residential buildings using LIDAR data
International Archives of the Photogrammetry, Remote Sensing and Spatial Information Sciences, Volume XL-4/W2, 2013 ISPRS WebMGS 2013 & DMGIS 2013, 11 – 12 November 2013, Xuzhou, Jiangsu, China
and multispectral imagery. ISPRS Journal of Photogrammetry and Remote Sensing, 65(5), pp. 457–467.
Baltsavias, E. P., 2004. Object extraction and revision by image analysis using existing geodata and knowledge: current status and steps towards operational systems. ISPRS Journal of Photogrammetry and Remote Sensing, 58(3-4), pp. 129–151. Bloch, I., 2005. Fuzzy spatial relationships for image processing and interpretation: a review. Image and Vision Computing, 23(2), pp. 89–110.
Egenhofer, M. J., Herring, J., 1990. A mathematical framework for the definition of topological relationships. In: Proceedings of the Fourth International Symposium on Spatial Data Handling, Columbus, OH, pp. 803-813.
Gruen, A., Kuebler, O., Agouris, P., 1995. Automatic Extraction of Man-Made Objects from Aerial and Space Images, Birkhaeuser Verlag Basel, Monte Verita, pp. 340.
Herring, J. R., 2011. OpenGIS Implementation Standard for Geographic information - Simple feature access - Part 1: Common architecture, OGC 06-103r4, pp. 93.
Hudelot, C., Atif, J., Bloch, I, 2008. Fuzzy spatial relation ontology for image interpretation. Fuzzy Sets and Systems, 159(15), pp. 1929–1951.
Tatem, A. J., Goetz, S. J., Hay, S. I., 2008. Fifty years of earth observation satellites. American Scientist, 96(5), pp. 390-398. Yang, B., Luan, X., Li, Q., 2010. An Adaptive Method for Identifying the Spatial Patterns in Road Networks. Computers, Environment and Urban Systems, 34:40-48.
Yang, B., Luan, X., Li, Q., 2011. Generating Hierarchical Strokes from Urban Street Networks Based on Spatial Pattern Recognition. International Journal of Geographical Information Science, 25(12), pp. 2025-2050.
Yue, P., Di, L., Han, W., Zhao, P., Yang, W., He, L., 2012. Service-oriented Approach for Geospatial Feature Discovery. Earth Science Informatics, 5(3-4), pp. 153-165.
Zimmermann, H. J., 2001. Fuzzy sets theory and its application, Kluwer Academic Publishers, 4th ed.
International Archives of the Photogrammetry, Remote Sensing and Spatial Information Sciences, Volume XL-4/W2, 2013 ISPRS WebMGS 2013 & DMGIS 2013, 11 – 12 November 2013, Xuzhou, Jiangsu, China