PHOTOGRAMMETRIC MONITORING OF GLACIER MARGIN LAKES
C. Mulsow, R. Koschitzki, H.-G. Maas
Institute of Photogrammetry and Remote Sensing, Technische Universität Dresden, D-01062 Dresden, [email protected]
Commission V, WG V/5
KEY WORDS: Photogrammetric network, image sequence processing, disaster monitoring
ABSTRACT:
The growing number of glacial margin lakes that have developed due to glacier retreat, have caused an increase of dangerous Glacial Lake Outburst Floods (GLOFs) in several regions over the last decade. A GLOF can occur when the water from the lake finds a path underneath the bottom of the glacier and the lake is draining rapidly. This causes normally a flood wave downstream the glacier. Typically such an event takes about 24 hours. GLOF scenarios may be a significant hazard to life, property, nature and infrastructure in the affected areas.
Together with our partner institute CECS (Valdivia, Chile), a project was initiated on a pilot study for an early warning system for GLOF events in the Northern Patagonian Icefield. A GLOF is normally characterized by a progressive water level drop. By observing the water level of the lake, an imminent GLOF-event can be identified. Common gauging systems are not suitable for the measurement task, as they may be affected by ice fall or landslides in the lake basin. Therefore, in our pilot study the water level is observed by processing images of a terrestrial camera system.
The paper presents the basic principle of a single-camera based GLOF early warning system. Challenges and approaches to solve them are discussed. First results from processed image sequences are presented to show the feasibility of the concept. Water level changes can be determined at decimetre precision.
In the first stage of the project, the waterline was measured manually in the images. A promising approach for reliable automation of this task is the use of a camera, which is sensitive for near infrared. The difference in the reflection of water, ice, and rock in this wavelength is more better than in RGB. This will be discussed in the outlook in deep.
1. INTRODUCTION
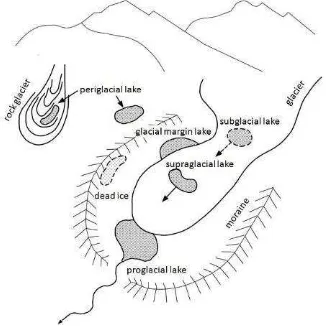
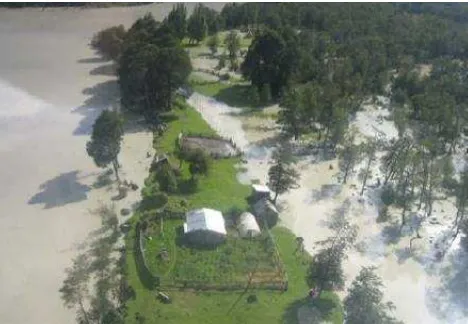
Glacial margin lakes are water bodies next to a glacier (figure 1). The glacier functions as a dam, restraining the water of the lake (Raymond et al., 2003). Normally the lake is filled with meltwater. If the barrier fails, glacial margin lakes may drain within minutes to days. These phenomena are called GLOF’s (Glacier Lake Outburst Flood). The accumulation and draining of a glacial margin lake can be repetitive if the dam is establishing again and an ongoing inflow of meltwater is present. The peak flow depends on water volume inside the lake and the draining speed. Peak flows up to several thousand cubic meters per second are not unusual. For example, the outburst flood of Lago Chachet II in the Chilean Andes from April 2008 showed a peak flow of 2500m³/s (Dussaillant e al., 2009). GLOF’s often cause disastrous flood waves downstream the glacier, accompanied by death and destruction of nature, economy and infrastructure (see figure 2).
Over the past years, the probability of GLOF’s has significantly grown in many parts of the world (Rosenzweig et al., 2007; Rignot et al.,2003; Casassa et al., 2007). The main reason for this is the decrease of stability of retreating glaciers, for instance due to reduced thickness or cracks. Additionally, climate changes often cause more meltwater filling the lakes faster. The typical GLOF mechanism is described by the ‘Glen mechanism’ (Glen, 1954): The increasing hydrostatic pressure of a glacier margin lake together with the decreasing detention from a thinning glacier enforces the development of a tunnel at the glacier bottom, through which the lake drains. During the process, this tunnel is widened by melting and erosion, causing a progressive lake drainage process. Some time after the complete drainage of the lake, the tunnel will collapse, triggered by glacier motion, and the lake will fill again, until it has
reached a critical water level. This way, a GLOF cycle is initiated, which may last for weeks, months or years.
As a consequence, there is a need for early warning systems to prevent damages and loss of life. A GLOF is normally characterized by a progressive water level drop (see section 4). Typically, a complete drain takes about 24 hours. By observing the water level of the lake, an imminent GLOF-event can be identified and a warning can be given to the citizens of the area.
Figure 1. Water bodies next to a glacier (after Raymond et al., 2003)
Figure 2. Flooded areas at Rio Baker after the GLOF-event at Lago Cachet II, Patagonia Chile, in April 2008 (Wendt et al., 2011)
2. CONCEPT OF A WARNING SYSTEM
Common gauging systems are for example gauge boards gauging stations, supersonic water gauges, radar level sensors or GPS buoys (figure 3). Unfortunately these are not well suited for GLOF monitoring, as they may be affected by ice fall or landslides in the lake basin. Also the lakes can be very deep (up to 100 meters), so a large measurement range is necessary. A method which fulfils the demands is the observation of the water level by a camera (figure 4). An image based monitoring system should be able to acquire images automatically, should be stable against movements, should work a solar panel and should be able to store the image data. The expansion of the monitoring system to an early warning system requires the inclusion of a data telemetry system transferring raw images or image analysis results. In the simplest configuration the image capture could be transferred to a human operator, who decides if a warning should be given. The bottleneck here may be in the data volume, if data transfer is only possible via satellite telephone in remote areas. So, a better method of operation could be the processing of the image data right on place by a small computer next to the camera. The software should be able to detect the waterline in the images automatically. In a next step, the position of the line in the image must be transformed into a water level height. Then, only the level must be submitted to a control center. A further decrease of transfer costs could be reached if only critical heights are submitted.
In the following, we will describe the concept and validation of a camera-based GLOF early warning system, addressing only the image analysis and geometry part, but not the data telemetry.
Figure 3: Common gauging systems: gauging station (USGS), GPS buoy (AXYS technologies) and radar level sensor (USGS).
Figure 4. Concept on an image based warning system. The main component is a camera, which observes the water line. Assuming that the exterior and the interior orientation is known, an image ray can projected into the object space. By intersecting the oriented ray with a georeferenced 3D-model or profile of the lake basin, a height for the water line can be computed. The water level data can be submitted to a control center
3. CAMPAIGNS IN PATAGONIA
To prove the concept, a campaign in the Patagonian Icefield was initiated together with the CECS (Valdivia, Chile). The area was chosen after several strong GLOF events occurred in the past few years (Dussaillant e al., 2009).
An impressive example is the GLOF event at Lago Chachet II in April 2008. The figure below shows the glacial margin lake filled by meltwater from Glaciar Chachet and dammed by Glaciar Colonia (figure 5). Lago Chachet II has a dimension of 5 km length, 1 km width and up to 100 m depth. When completely filled, it holds a water reservoir of 200.000.000 m³. it has a natural drainage through a small valley on the east side of the glacier. The damming function of Glaciar Chachet is weakening over time, for instance the surface showed a decrease of 9.1 km² from 1979 to 2000 (Rivera et al., 2007). In the same time, the glacier front retreated by about 1 km (Masiokas et al., 2009). Casassa (2009) reports a thinning of the glacier tongue in the region of Lago Chachet II with a rate of 2 m per year.
camera image
water line
lake basin
Figure 5: Satellite image of Lago Chachet II glacier lake drainage paths (in black) at Glaciar Colonia (Cassasa et al., 2009).
In the evening of 8th April 2008, the lake began to drain. Through a tunnel of 8 km length, the water flooded the Colonia River Valley and flew further the Rio Baker. According to a report of the Dirección General de Aguas (2008), the water level of Rio Baker rose by 4.5m and the discharge increased from 1200 m³/s to 3600 m³/s. Shortly after the tunnel collapsed, the meltwater was filling up the Lago Chachet II again. This kind of cycle of draining and filling may last for weeks or months. In summer, the frequency of GLOFs is higher due to the bigger amount of meltwater and the decreased stability of the glacier.
In 2009 and 2010, three cameras were installed on the two glaciers Glaciar Nef and Glaciar Chachet. One camera observes Lago Chachet II, another one the Lago Nef Norte and the third one a lake close to the front of Glacier Colonia.
3.1 Georeferencing
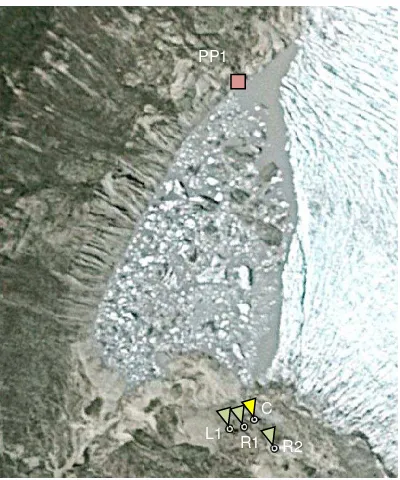
The transformation of the monoscopic image sequence measurements (see section 3.3) into water level heights requires the georeferencing of the camera and scale parameters on the object. During the campaign in 2010, a multi-image GPS-supported photogrammetric network was established on each time lapse camera position (Maas et al., 2013). The image acquisition was done with a 12 Mpix digital consumer camera (NIKON-D-100). Due to weight restrictions, only a single channel hand held GPS receiver could be used. Additionally, a GEO-tagger was attached to the NIKON-camera. The accuracy of the GPS-data in X- and Y-direction can be estimated with 9 m (absolute) and 4 m (relative) (Wanninger, 2011). A decrease of accuracy of factor 1.5 for the height component can be assumed. At first glance, the GPS-data are not precise enough, but as shown in section 4, the accuracy is suitable for this specific measurement task, as errors only become effective in a water level change scale factor. In the field, an ideal network configuration could not be achieved, because of the difficult conditions and the accessibility of the area. As shown in figure 6 (Lago Nef Norte) for example, the ratio between distance and base is far from a stable network design. Nevertheless, it was possible to process the data for the cameras on Lago Colonia and Lago Nef Norte (see Mulsow et al., 2011). In case of Lago Colonia, the standard deviation of a point at a distance of 1000 m was 20m in camera direction, 5 m in lateral direction and 1.2 m in height. Because of a control point on the opposite side of Lago Nef Norte it was possible to determine points in a distance of 700 m from the camera position with a much higher precision: 1.5 m in longitudinal, 0.3 m in lateral and 0.2 m in vertical direction. It can be assumed, that the relative accuracy is at least 2 times better. A simultaneous camera calibration was not possible because of the limited coverage of image format with tie points. The camera calibration was done afterwards and the parameters where introduced in the bundle adjustment as fixed. Additional constraints can be defined to support the bundle adjustment, like the coplanarity of points on a waterline.
Figure 6. Photogrammetric network design on Lago Nef Norte with time lapse camera (C - with field of view in dark red) and the images (with field of view in yellow) for georeferencing (L1, R1, R2). Point PP-1 is a control point on the opposite lake front (900m from camera C)
3.2 Image Sequence Acquisition
The installed cameras were Harbortronics time lapse camera systems (figure 7). Components are a 11 Mpix digital SLR consumer camera, a timer module, a buffer battery, a solar panel and a waterproof housing. The systems were fixed on stable permanent tripods (figure 8). To verify the stability of camera orientation, some fiducials were installed on the foreground. The systems are programmed to take images in defined time steps over the day.
Figure 7. Harbortronics time lapse package with solar panel (top), SLR camera, time lapse controller (box right in the housing) and buffer battery (bottom)
PP1
L1
R2 C
R1
Figure 8. Time lapse camera system installation at Lago Nef Norte (Maas et al., 2012)
3.3 Processing of image sequences
The workflow of processing the image sequences contains the following steps (Mulsow et al., 2011): First, the images are compensated for camera movements in order to get the same datum for the image measurements. In a second step, the water line has to be identified and measured in the images. Finally, the image measurements are transferred into water level heights by spatial intersection or by multiplication with a scale.
Compensation of camera movements induced by wind and temperature variations based on fiducials in front of the camera: First, the positions of the fiducials in the first image of the sequence are defined as reference (figure 9). Then the fiducials are measured in the following images by least squares matching. A 2D affine transformation is used to map the measured coordinates onto the reference coordinates and to correct all further image measurements for camera movement effects. For each transformation the significance is checked. In most cases a set of only two shift parameters will be suitable.
Figure 9. Image of sequence taken on Lago Nef Norte. In the foreground the fiducials are visible
Determination of the water line in the images: In the initial phase of the project, some tests were conducted to measure the water line automatically. Unfortunately, up to now no automatic procedure turned out to be reliable enough. The main reasons are changing light conditions, ice on the water, reflections on the water surface and sediments in the water (see figure 10). Therefore, the water line has so far been measured manually in
all sequences (see conclusions section for future work on this issue). The coordinates are corrected for camera movements as mentioned before. This step can be combined with a correction for camera calibration parameters, mainly radial lens distortion.
Figure 10. Two images of a sequence taken on Lago Nef Norte showing the same area under different conditions. Effects in the images (reflections, ice and snow on the water etc.) hamper the automatic water line measurement
Transferring image measurements into water level heights: This last step requires information about the exterior and interior orientation of the camera as well as the scale parameters on the water line (see section 3.1). Geometrically, this can be interpreted as a line-surface intersection problem, where the line is represented by the image ray and the surface by a digital lake basin model (see also figure 4).
For high precision absolute water level height determination, the necessary parameters have to be provided with sufficient accuracy and reliability. The demands for this are challenging in the field. For example, a strict interior and exterior orientation have to be made in situ. Furthermore, a proper digital surface model has to be provided. However, when taking to account that only (relative) variations of the water level height are relevant for an early warning system, the transformation process can be drastically simplified and the requirements on the parameters are dropping rapidly.
For example, the effect of a false determined distance between the camera and a point in the lake basin on a calculated water level height variation is rather small. An error of 20 m at a point in distance of 1000 m means a local scale error of 2%. For a water level change of 5 m, an error of 10 cm can be estimated, assuming a vertical lake basin wall (Maas et al. 2012). Also, the influence of possible small variations of parameters of interior orientation is negligible, so that a calibration of the camera before or after a campaign should be sufficient.
A further determining factor is the local terrain gradient. Assuming a water level change of 5m in a distance of 1000 m with a camera 100 m above the water level, an error of 10° on a slope of 45° would lead to an error in water level height change of ~20 cm. It becomes clear, that the influence of a false gradient is crucial. Maas et al. (2012) discussed several options for the acquisition of surface data:
Airborne laser scanning – for one lake a dataset exists taken when the lake was partly drained.
Photogrammetric DTM generation from terrestrial images – a dataset exists but processing failed due to poor image texture situation.
Photogrammetric height profile generation – measurements in the photogrammetric network for georeferencing.
Image sequence analysis by intersecting the waterline with the water surface (plane) with known height – future work.
The last method is quite promising, because the change of the lake basin can be determined from an image sequence. By defining a stable area inside the lake basin, the water level height can be determined. Then the image rays of the extracted water line can be intersected with the water surface, which can be assumed as a plane (figure 11).
Additionally, a DTM or a profile could be also determined by GPS, terrestrial laser scanning (Pirotti et al., 2013) or a total station. All these methods can only be applied when the lake basin is empty
Figure 11. Tracking changes of the lake basin. The water lines can be interpreted as contour lines (level curves)
4. RESULTS
Up to now, four sequences have been processed: Two from Lago Nef Norte (4.12.2009 – 8.2.2010, 30.3. – 7.11.2010) and two from Lago Cachet II (27.10.2009 – 10.2.2010, 13.2.2010 – 10.11.2010).
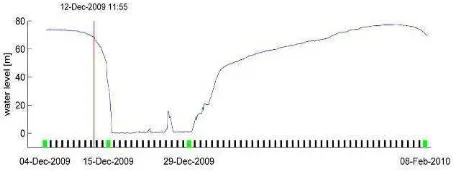
At Lago Nef Norte, the first sequence was taken with an interval of two hours, starting 6am and ending 6pm. The graph in figure 12 shows the water height level variations over this period. One GLOF event is evident in the data between 12th and 15th December. The falling graph at the end of the sequence could be an indicator for a coming GLOF event. Actually the lake drained completely at 20th February - two days after the end of the sequence due to a re-installation of the camera.
Figure 12. Water level variations at Lago Nef Norte between 4.12.2009 and 8.2.2010
Figure 13. Water level variations at Lago Nef Norte between 30.3. and 7.11.2010
The second sequence was taken with the same time interval. Because of the poor light conditions during austral winter, the first as well as the last image of each day were neglected. For some images processing was impossible, either due to humidity in the camera housing or snow in front of the camera. The data show one event during winter time (29.7. – 8.8.) with a significantly slower draining speed comparing to the event on 12.12.2009 - (see figure 12 and 13).
Figure 14. Water level variations at Lago Cachet II 27.11.2009 - 10.2.2010
Figure 15. Water level variations at Lago Cachet II 13.2. - 10.11.2010
The first sequence at Lago Chachet II was taken with an interval of only one image per day. Figure 14 shows two GLOF events - one starting on 4th January with a partial draining ending on 6th January and a second one between 20th and 24th January, ending with a complete drainage. For the second sequence, the interval was changed to five images per day – starting from 10am and ending 6pm. Over the acquired time period no GLOF events show up in the data (figure 15). Additionally, the rate of filling the lake is much lower in this time period. As this curve represents the austral winter, it matches with the theory of the dependence of the amount of meltwater from temperature and solar radiation. Also, it can be assumed that during winter the glacier tongue is more stable in this area.
All the data show the progressive character of the draining process during a GLOF. When the water flows under the glacier to the glacier front, the resulting tunnel is widened by melting and erosion, which results in an increasing drainage speed. Obviously, the rate of water level drop is not directly correlated with the outflow rate, as it depends also on the lake basin geometry. Assuming a constant drainage rate and a concave shape of lake basin, the rate of water level decline is rising with decreasing water volume inside.
Based on considerations made in section 3.3., the accuracy of the derived heights can be estimated with 1-2 meters (absolute). The relative precision, which is relevant for an early warning system, can be estimated in the range of a few decimetres.
5. CONCLUSION AND OUTLOOK
The pilot studies have proven the basic concept of a photogrammetric GLOF early warning system. From image sequences taken over a time period of approximately one year, the water level changes in two lakes could be derived at an estimated accuracy of a few decimetres.
The automatic measurement of the water line in the images is still unsolved. In order to overcome this problem, the use of a near infrared camera is planned. This should give better image contrast for automatic differentiation between shore and water. The usage of NIR-data for classification is well known from remote sensing. As seen in figure 16, water is nearly invisible in the NIR, snow is bright over all bands, and soil has a medium reflectance in all bands. However, in contrast to vertical imagery in remote sensing, the viewing direction of the camera causes disturbing effects in the image, due to the mirroring on the water surface. That means, in the acquired image the water shows the mirror image of the surrounding, when the water problems have to be further investigated in the future.
Figure 16. Spectral reflectance curves of snow, healthy and stressed vegetation, soil and water (Harris, 1987)
6. ACKNOWLEDGEMENTS
The GLOF monitoring research project is funded by DFG (German Research Foundation). The pilot studies were conducted in close cooperation between CECS (Valdivia, Chile) and TU Dresden (Germany). A special thanks goes to Anja Wendt and Gino Cassasa for their collaboration. The per-studies were also supported by Fondo Nacional de Desarrollo Científico y Tecnológico (FONDECYT) and the BMBF International Bureau. We would also like to express our thanks to Jonathan Leidich and Felipe Henríquez from Patagonia Adventure Expeditions for their support and the excellent organization of the 9-day expedition to the Northern Patagonian Icefield.
7. REFERENCES
Casassa, G., Rivera, A., Haeberli, W., Jones, G., Kaser, G., Ribstein, P., Schneider, C., 2007. Current status of Andean glaciers. Global and Planetary Change, Vol. 59, pp. 1-9
Cassasa , G., Wendt,J., Wendt, A., Lopez,P., Carrasco, J.,Rivera, A., Leidich, J., 2009. Monitoring of glacial lake outburst floods (GLOFS) in Chile, Planet Action Day, Toulouse June 9 2009, presentation
Dussaillant, A., Benito, G., Buytaert, W., Carling, P., Meie, C., Espinoza, F., 2010. Repeated glacial-lake outburst floods in Patagonia: an increasing hazard?. Nat Hazards, August 2010, Volume 54, Issue 2, pp 469-481
Harris, R.,:1987. Satellite Remote Sensing: an introduction. London, Routledge and Regan Paul.
Maas, H.-G., Casassa, G., Schneider, D., Schwalbe, E., Wendt, A., 2013. Photogrammetric Techniques for the Determination of Spatio-temporal Velocity Fields at Glaciar San Rafael, Chile. Photogrammetric Engineering and Remote Sensing, Vol. 79, No. 3
Maas, H.-G., Mulsow, C., Wendt, A., Casassa, G., 2012. Pilot Studies With A Photogrammetric Glacier Lake Outburst Flood Early Warning System. International Archives of Photogrammetry, Remote Sensing and Spatial Information Sciences, Vol. 39, Part B5
Masiokas, M., Rivera, A., Espizua, L., Villalba, R., Delgada, S., Aravena, J., 2009. Glacier fluctuations in extratropical South America during the past 1000 years. Palaeogeography, Palaeoclimatology, Palaeoecology, Vol. 281, pp. 242-268
Mulsow, C., Maas, H.-G., Wendt, A., Casassa, G., 2011. Photogrammetrische Überwachung von Gletscherrandseen. Beiträge zur DGPF-Jahrestagung. DGPF Tagungsband 20/2011
Pirotti, F, Guarnieri, A, Vettore, A., 2013a. State of the art of ground and aerial laser scanning technologies for high-resolution topography of the earth surface. European Journal of Remote Sensing, 46:66-78. doi: 10.5721/EuJRS20134605.
Raymond, M., Wegmann, M., Funk,M., 2003. Inventar gefährlicher Gletscher in der Schweiz, VAW Mitteilungen Nr. 182, ETH Zürich
Rignot, E., Rivera, A., Casassa, G., 2003. Contribution of the Patagonia icefields of South America to global sea level rise. Science, Vol. 302, pp. 434-437
Rosenzweig, C., Casassa, G., Karoly, D., Imeson, A., Liu, C., Menzel, A., Rawlins, S., Root, T., Seguin, B., Tryjanowski, P., 2007. Assessment of observed changes and responses in natural and managed systems. Climate Change 2007: Impacts, Adaptation and Vulnerability. Contribution of Working Group II to the Fourth Assessment Report of the Intergovernmental Panel on Climate Change (Eds. M. Parry et al.), Cambridge University Press, pp. 79-131
Rivera, A., Benham, T., Casassa, G., Bamber, J., Dowdeswell, J., 2007. Ice elevation and areal changes of glaciers from theNorthern Patagonia Icefield, Chile. Global and PlanetaryChange Vol. 59, pp. 126-137
Wanninger, L., 2011. Qualitätssicherung bei GNSS-Diensten, zfv - Zeitschrift für Geodäsie, Geoinformation und Landmanagement, Nr. 123, pp. 8-17
Wendt, A., Casassa, G., Wendt, J., Lopez, P., Schuler, T., Mass, H.-G., Mulsow, C., Leidich, J., Carrasco, J., Rivera, A., Briones, D., 2011. Glacial lake outburst floods in Patagonia: the case study of lake Cachet II. 22nd LAK 2011, Heidelberg The International Archives of the Photogrammetry, Remote Sensing and Spatial Information Sciences, Volume XL-5/W3, 2013