OPERATIONALIZING CROP MONITORING SYSTEM FOR INFORMED DECISION
MAKING RELATED TO FOOD SECURITY IN NEPAL
Faisal M. Qamer a, Shib Nandan Pd. Shah b, MSR. Murthy a, Tina Baidar a Krishna Dhonju a, Bishnu Ghimire Hari a International Centre for Integrated Mountain Development, Kathmandu, Nepal, Tel 5003222 Fax
+977-1-5003277 (fqamer, , mmurthy, tbaidar)@icimod.org,
b Ministry of Agricultural Development, Kathmandu, Nepal (snpshah, [email protected])
KEY WORDS: Gross Domestic Product (GDP), Agricultural, Village Developmental Committee and crop monitoring ABSTRACT:
In Nepal, two thirds of the total population depend on agriculture for their livelihoods and more than one third of Gross Domestic Product (GDP) comes from the agriculture sector. However, effective agriculture production across the country remains a serious challenge due to various factors, such as a high degree of spatial and temporal climate variability, irrigated and rain-fed agriculture systems, farmers’ fragile social and economic fabric, and unique mountain practices. ICIMOD through SERVIR-Himalaya initiative with collaboration of Ministry of Agricultural Development (MoAD) is working on developing a comprehensive crop monitoring system which aims to provide timely information on crop growth and drought development conditions. This system analyzes historical climate and crop conditions patterns and compares this data with the current growing season to provide timely assessment of crop growth. Using remote sensing data for vegetation indices, temperature and rainfall, the system generated anomaly maps are inferred to predict the increase or shortfall in production. Comparisons can be made both spatially and in graphs and figures at district and Village Developmental Committee (VDC) levels. Timely information on possible anomaly in crop production is later used by the institutions like Ministry of Agricultural Development, Nepal and World Food Programme, Nepal to trigger appropriate management response. Future potential includes integrating data on agricultural inputs, socioeconomics, demographics, and transportation to holistically assess food security in the region served by SERVIR-Himalaya.
1. INTRODUCTION
Agriculture is the most important livelihood activity in the HKH region, providing a substantial proportion of rural income and employment opportunities for its estimated 210 million inhabitants. Around 80 per cent of the population of the HKH is engaged in various land-based activities (Tang and Tulachan 2003). In Nepal, two third of total population depends on agriculture for their subsistence and more than one third of Gross Domestic Product (GDP) comes from Agriculture sector (MoAD 2010). Ensuring effective agriculture production across the country has been a serious challenge due to high degree of spatial and temporal climate variability, irrigated and rain fed agriculture systems coupled with farmer’s fragile social and economic fabric and unique mountain practices.
Generally, the more subsistence oriented the farming, the more the system is constrained by its biophysical and socioeconomic environment. Remote sensing data, in combination with other types of data, can reveal valuable information about environmental conditions that may affect farmers’ livelihoods. Geographic information system (GIS) and remote sensing technologies can help in identifying regions experiencing unfavourable crop growing conditions and food supply shortfalls, and determine food insecure areas and populations (Minamiguchi 2004). The vegetation indices produced are used to derive a measure that correlates with surface biophysical properties, which facilitates the analysis of large amounts of satellite data, providing valuable spatial and temporal analyses at large scale (Myneni et al. 1995). The fact that vegetation indices are directly related to plant vigour, density, and growth conditions means that they can be used to detect environmental conditions such as drought in semi-arid regions (Li et al. 2004). The integrated understanding of historical trends, reliable and timely capture of in season cropping patterns and mechanisms to forecast crop production at different time scales under different climate and management regimes is realised as one of the critical need. The fact that vegetation indices are directly
related to plant vigor, density, and growth conditions, means that they can be used to detect environmental conditions like droughts in semiarid regions. For large scale applications, time integrated series of NDVI offer a practical approach to measure crop production as they relate to the overall plant vigor, water stress, and photosynthetic activity during the growing season (Milesi et al. 2010). According to, Tucker and Sellers (1986), NDVI has proven to be a proxy for the status of the aboveground biomass at the landscape level due to the high correlation with green-leaf density, net primary production and CO2 fluxes (Martínez & Gilabert 2009). Currently, the development of effective methodologies for the analysis of hyper-temporal data is one of the most important and challenging issues for the remote sensing community (Bruzzone et al. 2003), due to the dynamic nature of the vegetation canopies.
The operational use of satellite based open source information to monitor climate and crop at daily time scales, application of Geographic Information Systems and models for integrated analysis of crop performance, and adoption of cost effective information and communication tools to reach last mile farmers are proven globally as promising approaches to bring significant shifts in agriculture management and improving agriculture livelihoods Major world food crop production has been monitored since the mid-1980s. A number of programmes use satellite observations for agricultural monitoring on a regional to global scale; examples include the crop forecasting system maintained by the United States Department of Agriculture (USDA) Foreign Agricultural Service (FAS), and food security monitoring systems such as the Food and Agriculture Organization of the United Nations (FAO) Food Security Global Information and Early Warning System (GIEWS), the United States Agency for International Development (USAID) Famine Early Warning System (FEWS), and the European Union Global Monitoring of Food Security (GMFS). However these global and regional monitoring systems does not effectively caters the need at national and sub-national level. The International Archives of the Photogrammetry, Remote Sensing and Spatial Information Sciences, Volume XL-8, 2014
In the context of meeting national level, the Ministry of Agricultural Development, Nepal and International Centre for Mountain Development, regional intergovernmental organisation, Nepal have launched a collaborative initiative to develop agriculture monitoring system through conjunctive use of geospatial data, science and ground based information. As a sequel, ICIMOD through its different regional program initiatives on NASA-USAID/SERVIR-Himalaya and AUSAID-Koshi Basin is focusing to strengthen the efforts of the agriculture ministry towards achieving reliable crop monitoring and drought early warning systems.
2. MATERIAL AND METHOD
2.1 Datasets
The Moderate Resolution Imaging Spectro-radiometers (MODIS) is one of the most extensively used satellite data for vegetation growth dynamics in the recent years. MODIS is a multi-spectral sensor. It has 36 bands with spatial resolution ranges from 250 to 1000 meters. In the current study we employed the the Normalized Difference Vegetation Index (NDVI) acquired by the moderate resolution sensor MODIS at 16-day time interval and 250 m spatial resolution, a standard product coded as MOD13Q1. A total of 253 NDVI 16-day composite images were employed in the analyses along with Quality Assessment (QA) product. These data are distributed by the Land Processes Distributed Active Archive Center (LP DAAC), located at the U.S. Geological Survey (USGS) Earth Resources Observation and Science (EROS) Center (lpdaac.usgs.gov).
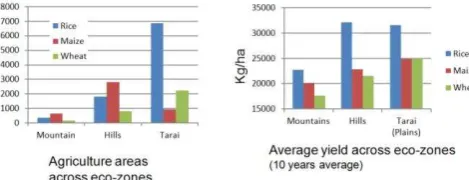
District level crop production data of three major crops including Rice, wheat and Maize was compiled from the Agriculture Census reports, published by the Statistics Division of Agriculture Ministry, of last 10 years. Summary agriculture statistics in Koshi basin of Nepal are shown in the Figure 1.
Figure 1: Crop distribution across the ecological zones of Nepal
2.2 Data processing
Theoretically, NDVI, calculated from a normalized transform of the near-infrared (NIR and red reflectance ratio, is an index of the absorptive and reflective characteristics of vegetation in the red and near- infrared portions of the electromagnetic spectrum. For this reason, changes in NDVI time-series indicate changes in vegetation conditions proportional to the absorption of photosynthetically active radiation (Sellers 1985). However, there are nearly always disturbances in these time- series, caused by cloud contamination, atmospheric variability, and bidirectional effects. These disturbances greatly affect the monitoring of land cover and terrestrial ecosystems and show up as undesirable noise (Cihlar et al., 1997; Gutman, 1991).(J. Chen et al. 2004). For this reason, a number of methods for reducing noise and constructing high-quality NDVI time-series data sets for further analysis have been formulated, applied, and evaluated in the last two decades. The Fourier-based fitting
approach has been employed to derive terrestrial biophysical parameters (e.g. Sellers et al. 1994) and to evaluate NPP dynamics (e.g. Malmstrom et al. 1997). Asymmetric function fitting methods have been mainly used to extract seasonality information for phenological studies (Jonsson & Eklundh, 2002).(J. Chen et al. 2004). Fourier analysis was applied on a per-pixel basis separately for whole year (each from January to December), to capture vegetation growth in all seasons throughout the year, usually two. The poor periodicity of NDVI is therefore irrelevant within this application (Wagenseil & Samimi 2006). Yearly stacks NDVI time-series was reconstructed separately, as it was relatively in appropriate smoothing, when we use whole series of 253 images for the time duration 2001 to 2011. So smoothing process was carried out on yearly stacks, 23 images in each stack.
2.3 Crop area and growth monitoring
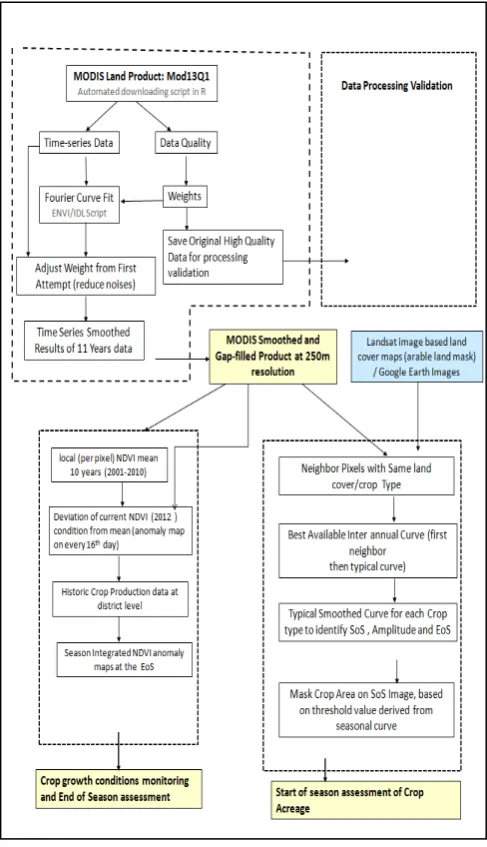
Crop area estimation is based on the assumption that the signature of the concerned crop during the period of observation is unique and statistically separable from other/ competing crops or land covers. The estimation is done few months before the harvest and the basis for estimation is historical trend, economic analysis and survey of farmer’s. According to (Gallego 2008; as cited in Michael Craig and Dale Atkinson, 2013), the timing of crop area estimation is dependent to a number of elements including number of days after sowing, spatial variability in sowing practices of the region, crop calendars of competing crops, revisiting time of remote sensors, date of the season in which the crop can be reliably recognized in field, time required by ground survey and ground data processing. We employed hierarchical classification from multi-date data on the long term datasets. In this approach, crop calendar is used to estimate the variation of different crops in different seasons (Figure 2). Vegetation indices are then computed at different stage of crop cycle such as start of the season (SOS), peak of season (POS) and end of the season (EOS) and threshold values are established to classify the crop area. To understand the growth patterns, the temporal signatures are further analyzed in comparison to previous year and average values to identify anomalies in greenness over the years. Overall framework of data processing and analysis is given in the Figure 3.
Figure 2: Average crop phenology in terai-region of Nepal based on 10 years NDVI data
2.4 Software used
R Scripts along with GDAL translator ere used for automated download and basic processing of the satellite data. The analysis was performed using remote sensing software ENVI/ IDL. IDL programming scripts for batch processing and advance functions of ENVI were used to stack, re-arrange the layers, and curve fitting, and cloudy pixel and noise removal The International Archives of the Photogrammetry, Remote Sensing and Spatial Information Sciences, Volume XL-8, 2014
algorithm using Fast Fourier Transformation (FFT), and finally region properties tools of ENVI for the final analysis.
Figure 3: Data processing and analysis framework for agriculture monitoring using moderate resolution hyper-temporal satellite data in Nepal
3. RESULTS
3.1 In season area and growth monitoring of rice crop in 2014
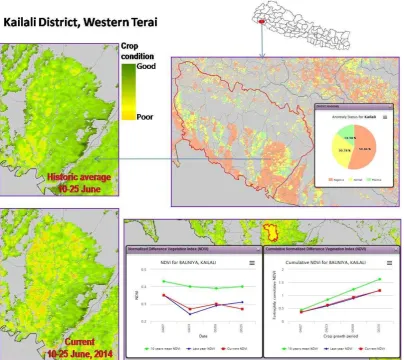
By compiling the error free historic data and basic analysis of crop phenology in Nepal we are in position regularly monitor the vegetation condition in the agriculture areas of Nepal in comparison to average condition. Figure 4 shows the example of such comparison at district level.
Figure 4.: Comparing current crop growth condition in comparison to average conditions
During March 2014, National Oceanic and Atmospheric Administration (NOAA), Australian and Japanese Meteorological Agencies have issued El-Nino watch for the Pacific Ocean while the American scientists are 80% sure that it would turn out to be an El-Nino year which may results in below-average to average monsoon rains in South Asia. The seasonal showers are the main source of irrigation for the Nepalese farmers because about 80 percent of crop land is rain dependent. Fluctuation in rice production is very common because of changes in rainfall. In Nepal the changing weather patterns are already creating new complex emergencies where areas are simultaneously hit by drought and floods, often accompanied by outbreaks of infectious diseases. The delayed monsoon coupled with the poor rains in the month of June - July and severe floods in the month of August is expected to reduce the acreage under paddy cultivation.
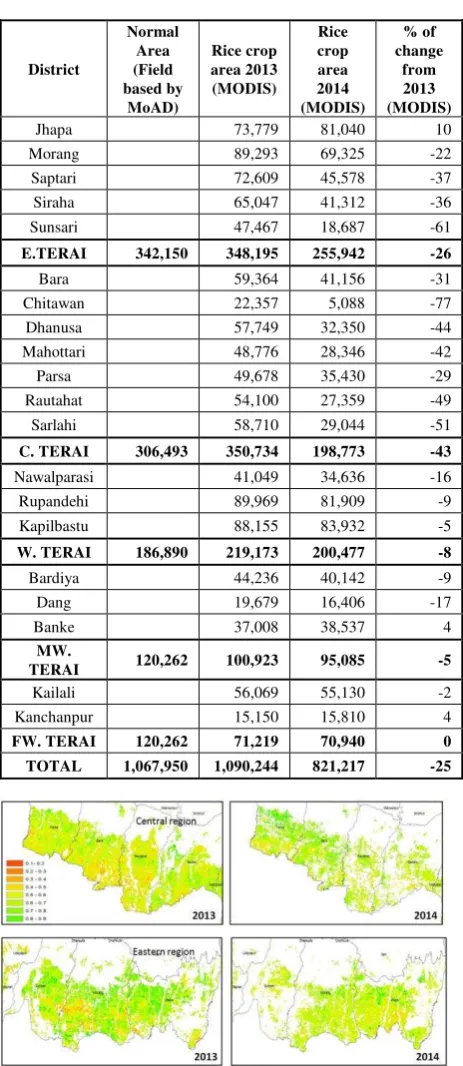
In fiscal year 2012/2013, the rice crop in Nepal was grown on 1.421 million hectares (which is an increase of 4 percent over last year's area), with a production of 4.505 million metric tons and yield of 3.171 tons/hectare (MoAD, 2012/2013). Adequate and timely rainfall coupled with better availability of fertilizers is considered the key reason for increased production in 2013. Average rainfall during July-September 2013 was the largest in the last five years and was recorded at 115 percent of the normal level. Paddy crop conditions on 12 August 2014 were assessed and compared with same time conditions during last year (2013) to see the possible implication on potential production estimate for 2014. In total, about 25% of paddy has not been transplanted this year as compared to the last year while the central region of Terai has faced more loss in rice crop area than the other regions (Figure 5, Table 1). Moreover, those areas with rice crop also have lower range of NDVI values as The International Archives of the Photogrammetry, Remote Sensing and Spatial Information Sciences, Volume XL-8, 2014
compared to that of 2013 which shows poor vegetation health this year. When compared with rainfall patterns during June and July with region wise crop area both in 2013 and 2014 it appears that adequate rainfall in the month of June is more critical than in July.
Table 1 Rice Crop Area (Hectares) identified on MODIS satellite images as on 12 August 2014 in Terai Districts in 2013 and 2014 and their comparison with normal crop area provided by MoAD
Figure 5: Insets from Eastern and Central region for comparison of rice crop area and vegetation conditions during 2013 and 15% less the normal area and remote sensing identifies 821,217 ha which is 23% less than the normal area provided by the MoAD. In addition to reduction in the crop sown area, the vegetation conditions are also appearing poor mainly because of late sowing of crop which may result in poor yield of the crop. This remote sensing based monitoring will be undertaken for the next two months to support the production estimation of rice crop 2014.
3.2 Inter annual vegetation conditions and crop production relationship
Phenological variation of croplands have been analysed through visual observations as well as temporal signature compilation for the Wheat Crop Season (December - April) Rice Crop Season (July to November) Figure 6 . Generally, visual analysis performed for the broad view of seasonal variations whereas, for specific analysis, temporal signatures of NDVI variations were analysed for targeted pixels. Both the visual and signature analysis were performed for inter annual and intra annual variations. Before starting the phenological analysis, ground truth information, particularly, for croplands were collected from Google Earth. These points were used for further analysis of temporal signatures. Later the temporally smoothed time series NDVI data and historical yield data to evaluate the season maximum NDVI values for each district with production statistics at both the district and national level. The results for Tarai Region showed good correlatthe national level (R2 = 0.85) and the district level (R2 = 0.66) (Figure 7).
3.3 Process automation and web-based application for agriculture conditions monitoring
The basic analysis was carried was being carried out through ENVI - IDL programming language and to fully automate the process, the IDL scripts has been translated into python scripts and GDAL translator and all this process has been fully The International Archives of the Photogrammetry, Remote Sensing and Spatial Information Sciences, Volume XL-8, 2014
automated. Similarly, web-application has been developed and NDVI statistics are available at VDC (sub-district) level and use can also define its own plot (polygon ) to compare the crop conditions between different areas and during different times (Figure 8).
4. ACKNOWLEDGEMENT
This work was carried out under the SERVIR Himalaya Programme supported by USAID and NASA. We also acknowledge the valuable contribution of the professional from Ministry of Agricultural Development Nepal for their support and contribution in this work. The views expressed are those of the authors and do not necessarily reflect those of ICIMOD or the organizations mentioned in the acknowledgements.
.
5. REFERENCES
Aase, TH; Chaudhary, RP; Vetaas, OR (2010) ‘Farming flexibility and food security under climatic uncertainty: Manang, Nepal Himalaya.’ AREA 42(2): 228–238
Bradley, B; Jacob, R; Hermance, J; Mustard, JF (2007) ‘A curve-fi tting technique to derive inter-annual phenologies from time series of noisy NDVI satellite data.’ Remote Sensing of Environment 106: 137−145
Chen, J., Jönsson, P., Tamura, M., Gu, Z., Matsushita, B., & Eklundh, L. (2004). A simple method for reconstructing a high-quality NDVI time-series data set based on the Savitzky–Golay filter. Remote Sensing of Environment, 91(3-4), 332-344. doi:10.1016/j.rse.2004.03.014
Cihlar, J., I. Tcherednichenko, R. Latifovic, Z. Li, and J. Chen (2002), Impact of variable atmospheric water vapor content on AVHRR data corrections over land, Geoscience and Remote Sensing, IEEE Transactions on, 39(1), 173-180.
Jönsson, P., & Eklundh, L. (2004). TIMESAT—a program for analyzing time-series of satellite sensor data. Computers & Geosciences, 30(8), 833-845. doi:10.1016/j.cageo.2004.05.006 Milesi, C., Samanta, A., Hashimoto, H., Kumar, K. K., Ganguly, S., Thenkabail, P. S., Srivastava, A. N., et al. (2010). Decadal Variations in NDVI and Food Production in India.
Remote Sensing, 2(3), 758-776. doi:10.3390/rs2030758 Minamiguchi, N (2004) Drought and food insecurity monitoring with the use of geospatial information by the UN FAO. Regional Workshop on Agricultural Drought Monitoring and Assessment Using Space Technology, Hyderabad, India, 3– 7 May 2004.
Moody, A., & Johnson, D. M. (2001). Land-surface phenologies from AVHRR using the discrete Fourier transform. Remote Sensing of Environment, 75, 305−323.
Myneni, R. B., C. Keeling, C. Tucker, G. Asrar, and R. Nemani (1997), Increased plant growth in the northern high latitudes from 1981 to 1991, Nature, 386(6626), 698-702.
Li, J; Lewis, J; Rowland, J; Tappan, G; Tieszen, LL (2004) ‘Evaluation of land performance in Senegal using multitemporal NDVI and rainfall series.’ Journal of Arid Environments
59: 463–480
Roerink, G. J., Menenti, M., & Verhoef, W. (2000). Reconstructing cloud- free NDVI composites using Fourier
analysis of time series. Interna- tional Journal of Remote Sensing, 21(9), 1911–1917.
Sellers, P. J., Tucker, C. J., Collatz, G. J., Los, S. O., Justice, C. O., Dazlich, D. A., & Randall, D. A. (1994). A global 1_1 NDVI data set for climate studies: Part II. The generation of global fields of terrestrial biophysical parameters from the NDVI. International Journal of Remote Sensing, 15(17), 3519– 3545.
Tang, Y; Tulachan, PM (2003) Mountain agriculture in the Hindu Kush-Himalayan region: Proceedings of an International Symposium. Kathmandu, Nepal, 21 to 24 May 2001. Kathmandu:
Viovy, N., Arino, O., & Belward, A. (1992). The Best Index Slope Extrac- tion (BISE): A method for reducing noise in NDVI time-series. Inter- national Journal of Remote Sensing, 13(8), 1585–1590.
Wang, J., Rich, P. M., & Price, K. P. (2003). Temporal responses of NDVI to precipitation and temperature in the central Great Plains, USA. International Journal of Remote Sensing, 24(11), 2345-2364. doi:10.1080/01431160210154812 Wang ZX, Liu C, Huete A (2003). The progress of study on plants index: from AVHRR-NDVI to MODIS-EVI. J. Acta Ecol. Sin., 23(5):979-987
Zhang, X; Friedl, MA; Schaaf, CB; Strahler, AH; Hodges, JCF; Gao, F; Reed, BC; Huete, A (2003) ‘Monitoring vegetation phenology using MODIS.’ Remote Sensing of Environment 84: 471−475
Figure 7: Inter-annual changes in wheat crop production and its spatial pattern based on the observations in Sarlahi District Nepal. (Grey color showing non-agriculture areas). (map projection: sinusoidal)
Figure 8: Screen shot of the tools available in the web-application for agriculture monitoring