PHASE CORRELATION BASED LOCAL ILLUMINATION-INVARIANT METHOD FOR MULTI-TEMPRO REMOTE SENSING IMAGE MATCHING
Xue Wan*, Jianguo Liu, Hongshi Yan
Department of Earth Science and Engineering, Imperial College London, SW7 2AZ - (x.wan12, j.g.liu, h.yan)@imperial.ac.uk
Commission III
KEY WORDS: Phase Correlation, Terrain Image Matching, Illumination Angle Change
ABSTRACT:
This paper aims at image matching under significantly different illumination conditions, especially illumination angle changes, without prior knowledge of lighting conditions. We investigated the illumination impact on Phase Correlation (PC) matrix by mathematical derivation and from which, we decomposed PC matrix as the multiplication product of the illumination impact matrix and the translation matrix. Thus the robustness to illumination variation of the widely used Absolute Dirichlet Curve-fitting (AD-CF) algorithm for pixel-wise disparity estimation is proved. Further, an improved PC matching algorithm is proposed: Absolute Dirichlet SVD (AD-SVD), to achieve illumination invariant image alignment. Experiments of matching DEM simulated terrain shading images under very different illumination angles demonstrated that AD-SVD achieved 1/20 pixels accuracy for image alignment and it is nearly entirely invariant to daily and seasonal solar position variation. The AD-CF algorithm was tested for generating disparity map from multi-illumination angle stereo pairs and the results demonstrated high fidelity to the original DEM and the Normalised Correlation Coefficient (NCC) between the two is 0.96.
1. INTRODUCTION
The matching of multi-temporal remote sensing imagery is of wide interest owing to the fact that the earth surface is monitored locally, regionally and globally from past to present. Illumination is one of the major challenges for multi-temporal remote sensing image matching. The lighting source for passive remote sensing, the Sun, varies in two aspects: solar intensity and solar direction (azimuth and zenith). The variation of solar intensity results in change of global brightness between two images, which can be corrected by radiometric adjustment, such as histogram matching. The solar direction varies with the daily times and seasons; which results in change of local grey level distribution (shading patterns). Matching images taken at different daily times or seasons under different solar directions is required for many applications. For instance, the vision-based UAV (Unmanned Aerial Vehicle) autonomous navigation may have to use high-medium resolution satellite images (mostly taken at the local time of 9-10am) as reference in matching the real time on-board images which could be taken in the afternoon. Another application is illumination robust DEM (Digital Elevation Model) generation in the cases that images forming stereo pairs are acquired separately in different illumination conditions. Application also includes change detection based on pixel-wise image matching in multi-temporal remote sensing for which, illumination insensitive image matching algorithms can pin point the real changes on the ground despite of shadow change interference.
In this paper, we present our investigation of illumination impact on the Phase Correlation (PC) algorithm via mathematical analysis and experiments. Our study makes the following contributions:
The translation and illumination variations in phase correlation matrix can be separated and thus, 2D image shifts can be correctly resolved if we can isolate and suppress the illumination impact on the PC matrix.
Consequently, the robustness to illumination variation of the PC image matching algorithm: Absolute Dirichlet Curve-fitting (AD-CF) has been proved and tested for pixel-wise disparity map generation from stereo images taken under different illumination angles.
Further, an improved PC algorithm, named Absolute Dirichlet SVD (AD-SVD), is proposed to achieve robust illumination-insensitive image alignment (large window image matching) at sub-pixel precision.
There is no need of prior knowledge of illumination conditions (e.g. azimuth and zenith angles) in these algorithms.
2. RELATED RESEARCH
Illumination invariant matching algorithms have been studied for years in computer vision. There are two approaches to achieve illumination-insensitive matching, one is feature-based approach, which is to extract the unchangeable pattern under different lighting conditions, and the other is normalization or compensation based approach, which is to eliminate the illumination-sensitive patterns.
local patterns may alter greatly by direction and shape changes of shades and shadows.
The normalisation-based approach is to generate a standard image that appears stable under different lighting conditions. This standard image can be generated in spatial domain or frequency domain. Spatial domain normalisation approaches include Histogram Equalization (HE) and Adaptive Histogram Equalization (AHE) (Pizer et al., 1987). The frequency-based approach is based on the enhancement of high frequency information, which assumed to be less sensitive to illumination variation. Wavelet analysis and DCT were used for the purpose (Discrete Cosine Transform) (Chen, Er, & Wu, 2006). Problems of normalization method are similar to that of feature-based approach. They are not truly invariant to illumination angle changes that alter the local texture depending of terrain slopes. Moreover, by eliminating illumination variations, the quality of image inevitably declines. This quality declination is acceptable for image matching using large windows, but can results in lost-correspondence when using small window matched for pixel-wise disparity estimation.
The goal of our research is not only precise alignment between the images under different illumination conditions, but also disparity map generation between them, without prior knowledge of lighting conditions. This requires the matching algorithm to be robust enough to illumination variation for large matching windows as well as for small matching windows. None of above approaches provides effective solutions. In the following sections, we are going to derive and test novel and effective Phase Correlation based algorithms towards illumination insensitive image matching.
3. IMPACT OF ILLUMINATION VARIATIONS ON PHASE CORRELATION MATRIX
3.1 Illumination Impact Phase Correlation Matrix
Phase Correlation is a frequency-based image matching algorithm (Kuglin, 1975). Suppose that a translational shift was made between two identical images and ; this spatial shift of the two images results in a phase shift in the frequency domain of their Fourier Transforms and and expressed as cross power spectrum :
| | (1)
The Phase Correlation defined above is a 2π wrapped complex matrix and the density and orientation of PC fringes are and p/q. The translational shift (p, q) can then be resolved at integer level via IFT (Inverse Fourier Transform) to convert to a Dirac delta function(Kuglin, 1975): ( )
; it can also be resolved directly in frequency domain at sub-pixel accuracy (Foroosh, Zerubia, & Berthod, 2002; Hoge, 2003; J. G. Liu & Yan, 2008; Morgan, Liu, & Yan, 2010).
Here, the two images are supposed to be identical however, the two images are not identical if they are taken under different lighting conditions. Consider two images and are of different lighting
conditions and with a translational shift , and their Fourier spectrums are and respectively. The cross power spectrum for and is
(2)
Eq. (2) indicates that the PC matrix of two images with a translational shift and under different illumination conditions can be decomposed into two phase correlation matrices: the illumination impact matrix corresponding to texture difference caused by illumination variation and the translation matrix
resulted from the 2D shift. and are unknown and only PC matrix can be calculated directly from the image matching. For illumination-insensitive image matching, the aim is to extract the translation matrix ( ) from the PC matrix , and this can be achieved by eliminating the impact of from . It is therefore essential to investigate how is affected by illumination conditions.
3.2 Local Illumination Change Caused by Variation of Azimuth Angle
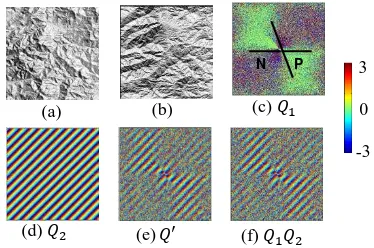
In this section, we focus on the impact of azimuth angle variation on Phase Correlation matrix. Azimuth angles are the compass directions of the sunlight. An example of azimuth angle variation is demonstrated in Figure 1. Two terrain shading images (a) and (b) were generated from a DEM with the same zenith 45° but different azimuth 60° and 180°. Then, Figure 1(b) was shifted 10 pixels to the right and downwards. Figure 1(c)-(e) present the PC fringes of , and . Here corresponds to the impact of azimuth angle change without shifts; is the PC matrix generated from two identical images under the same illumination condition and with a shift. In this case, the translation matrix , where u=10 and v=10. is the PC matrix generated from Figure (a) and (b). Figure 1(f) shows the pixel-wise multiplication product of , which is nearly identical to in Figure 1(e) as the proof of Eq. (2).
Figure 1. Impact of azimuth angle variation on Phase Correlation.
To demonstrate the impact of azimuth angle variance on terrain shading images, we introduce a 3D space coordinates system called SAI defined by slope, aspect and intensity (Xue Wan, 2014). A terrain shading image is a 3D surface in SAI space, and the shape of the 3D surface is only related to illumination conditions, and is independent of terrain elevation and image translation. The azimuth angle change leads to SAI surface shift, but
(f) (e)
(c) (b)
(a)
(d)
N P 3
will not alter the surface shape. In SAI space, the cross power spectrum of the two images can be expressed as
| | (3)
where are unit vectors in frequency domain transfer from SAI space by FT. and are the Fourier spectrums of images and in SAI space.
The relationship derivation of surface shift in SAI and PC matrix can be found in (Xue Wan, 2014). The analysis indicates that the change of azimuth angles may cause a combination of positive and negative patterns, shown in Figure 1(c). Thus, can be expressed as
{
(4)
where is the polar angle in the PC power spectrum, and and are the two azimuth angles. Eq. (4) indicates that partial fringe patterns are inversed in certain angular sectors, and the angles are determined by two azimuth angles.
From Eq. (3) and Eq. (4), the PC matrix of two images with a translational shift and under different illumination azimuth become
{
(5)
Eq. (5) shows that although reversed fringes are introduced by azimuth angle variation, the fringe density and fringe orientation p/q remain unchanged. This is evidenced by comparing Figure 1(d) and (e): the fringe orientation and density of are the same as .
3.3 Local Illumination Change Caused by Variation of Zenith Angle
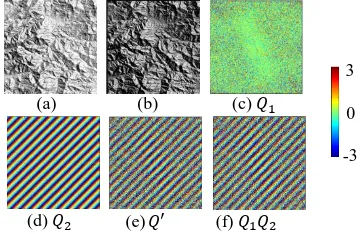
Zenith angle is the angular height of the sun in the sky measured from the vertical. Obviously, the change of zenith angle does not cause reverse of image texture as it is irrelevant to the direction of sunlight. However, the brightness of texture pattern can be altered. As shown in Figure 2(a) and (b) two DEM terrain shading images under the same illumination azimuth but different zenith angles, 45° and 25° respectively; although the impact resembles the global brightness and contrast change of the image, it is not an affine illumination transformation.
The phase angle of is
( ( ( ) )), where ( ) and ( ) are imagery and real part of
. With the increase of zenith angle difference, the imagery part, ( ), increases as well and because ( ) ( ) , also increases depending on local slopes. The detailed derivation of impact of zenith change on phase correlation matrix can be found in (Xue Wan, 2014), which is similar to adding random noise to the PC fringes
and the larger difference the zenith angles are, the more noisy the matrix will be.
Figure 2. Impact of zenith angle variation on Phase Correlation
The impact of zenith angle variation is not as severe as that of azimuth angle variation. It degrades the fringe quality in general but does not cause partial fringe patterns inverse in certain angular sectors. In Figure 2, image (b) is shifted by 10 pixels to the right and downwards. As shown in Figure 2(e), the fringes are blurred compared to the fringes of translation matrix (Figure 2(d)). However, the orientation and density of the fringes, which determine the shift between the two images, remains the same as . It can therefore be concluded that PC is robust to zenith angle variation for image matching.
The analysis from §3.2 and §3.3 has demonstrated that the azimuth angle and zenith angle variations have different impacts on , as well as . Azimuth angle variation may introduce negative correlation to the illumination impact matrix , thus results in a combination of positive and negative fringe patterns in the PC matrix . The portion of positive and negative fringes is determined by the difference between the two azimuth angles. On the other hand, zenith angle variation adds noise to the illumination impact matrix and leads to blurring fringes in the PC matrix . No matter either azimuth or zenith changes, the orientation and density of remain the same as the translation matrix . This indicates that the shift information in remain unchanged though jumbled with the impact of illumination variation. Thus illumination-insensitive image matching based on phase correction is possible.
4. ILLUMINATION-INSENSITIVE SUB-PIXEL PC MATCHING
4.1 Sub-pixel PC Matching
As indicated in §3.1, the integer translation shift between two images can be estimated by the peak location of Dirac delta function that is the IFT of the PC matrix. Several approaches have been proposed to achieve sub-pixel PC matching, and they fall into two categories: IFT spatial domain based PC and frequency domain based PC.
In the first category, sub-pixel location is determined by peak fitting of the absolute Dirichlet function, a down-sampled Dirac function, in spatial domain by IFT (Argyriou & Vlachos, 2006). This AD-CF (Absolute Dirichlet function Curve Fitting) method is robust to
(b) (a)
(f) (e)
(d)
(c)
3
illumination variation as discussed later. However, this method cannot reach very high sub-pixel accuracy, and the average matching accuracy is about 1/10 pixel.
In the second category, sub-pixel shifts are directly resolved in frequency domain by PC fringe analysis. , the translation matrix of PC is a rank one matrix, and can be decomposed as the product of two dominant singular vectors and (Hoge, 2003).
(6)
The sub-pixel image displacement is calculated by unwarping the two vectors. The sub-pixel displacement can then be estimated directly in frequency domain using either SVD (singular value decomposition) (Hoge, 2003) or 2D fitting technique using Quick Maximum Density Power Estimator (QMDPE) (J. G. Liu & Yan, 2008; J. Liu & Yan, 2006). Compared to spatial domain-based methods, frequency-based methods achieve higher sub-pixel accuracy (1/20-1/50 sub-pixels), since the sub-sub-pixel displacement is directly solved by fringe analysis. However, these methods is less robust to illumination variation, thus we proposed an improved PC-SVD algorithm for image alignment in the following.
4.2 Absolute Dirichlet Function SVD (AD-SVD) Algorithm for Illumination-Insensitive Image Matching
We consider that the images for matching are acquired in the same imaging geometry but under different lighting conditions (e.g. morning and afternoon), and there is only a 2D translation between the two images. This is the general case for alignment of multi-temporal satellite images and aerial photos.
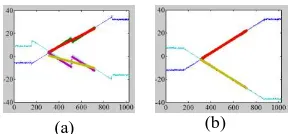
The performance of the frequency domain SVD-PC algorithm to illumination variation is affected mainly by the impact of azimuth angle change. According to Eq. (5), there are two fringe patterns in cross power spectrum PC matrix generated by images under different azimuth angle, and . The SVD of will result in two different vectors and . This means that there are four dominant singular vectors , , and for LSF (Least Square Fitting). After phase unwarping, there are two separated lines in one image direction, and the LSF may fail to achieve a proper fit to the true slopes as illustrated in Figure 3(a) where, the green and purple lines represent the singular vectors in x and y direction after unwrapping, and the red and yellow lines the LSF results for x and y direction respectively.
To solve the problem, we proposed an algorithm called Absolute Dirichlet function SVD (AD-SVD). According to §3.2, azimuth angle variation yields a combination of positive and negative correlation in the PC matrix , and in the corresponding Dirichlet function after IFT, a positive peak and a negative peak appear (Figure 4(b)). As the azimuth angle variation does not alter the orientation and density of the fringes, we can correct the negative fringes by taking the absolute value of the Dirichlet function (Figure 4(c)).
| | (7)
Transform the back to frequency domain by FT,
(8)
A new cross power spectrum is then generated as shown in Figure 4(d) in which, negative fringes are in accordance to positive fringes. SVD can then be applied to to calculate the sub-pixel image shift. As shown in Figure 3(b), after correcting negative fringes via the absolute value of Dirichlet function, there is only one line each in phase component of the dominant singular vectors and . LSF fitting is then correct.
Figure 3. Comparison of SVD and AD-SVD unwrapping and LSF fitting results. (a) SVD results of the PC matrix for Fig. 1(a)-(b). (b) AD-SVD results of Fig. 1(a)-(b).
Figure 4. AD-SVD algorithm for azimuth angle variation. (a) PC fringes between images of different azimuth angles. (b) Dirichlet function derived from IFT of (a). (c) The absolute value of the Dirichlet function in
(b). (d) The power spectrum fringes of the FT of (c).
As indicated in section 3.3, the impact of zenith angle variation to Phase Correlation matrix is similar to adding random noise to the image, which does not alter the local texture distribution, so that both original Dirichlet function and the AD-SVD algorithm perform equally well to zenith angle variation. Multi-temporal imaging in different daily time (e.g. from morning to afternoon) encounters the sun illumination changes in both azimuth and zenith angles and thus the AD-SVD algorithm is overall more robust.
As a SVD based algorithm, AD-SVD performs robustly and accurately in large window matching but become unstable for matching window size smaller than 128×128 pixels, will be further discussed in §5.1, because of too few data available for SVD operations. It is therefore best for image alignment in relatively large windows.
4.3 Illumination-Insensitive Pixel-Wise Disparity Map Generation Using Absolute Dirichlet Function Curve Fitting (AD-CF)
Although Phase correlation has been widely applied for pixel-wise dense disparity maps from stereo images of identical or very similar illumination angles (Fleet, 1994; Morgan et al., 2010), the capability of Phase correlation pixel-wise disparity estimation from images taken under different sunlight angles at different times and seasons
(b) (a)
(b)
has not yet been fully investigated. This capability can considerably increase the data availability for DEM generation as well as enhance other 3D data related applications.
As indicated in §4.2, by using absolute value of Dirichlet function, the negative correlation can be corrected. The AD-CF algorithm is therefore illumination insensitive. The AD-CF is similar to the AD-SVD; the only difference is that instead of transforming the absolute value of Dirichlet function back to frequency domain, a curve fitting is directly applied to the absolute Dirichlet function in spatial domain. This approach may not achieve as high sub-pixel accuracy as the AD-SVD for large window image alignment but it is stable and fast in small window image matching scan for disparity map generation at pixel level accuracy.
For small window (e.g. 32×32 pixels) image matching, the frequency domain PC algorithms, such as SVD-PC and AD-SVD, are simply not functional when negative correlation is significant in the PC matrix, in the case of very different azimuth angles between the pair of multi-temporal images. However, AD-CF algorithm can tolerate considerable azimuth angle difference, up to 60°, as well as much greater zenith angle change than SVD-PC algorithm. Figure 5 shows an example of disparity estimation from images under different zenith angles. The size of matching window is 32×32 pixels. With 30° zenith angle difference, images in Figure 5 (a) and (b) are significantly different in textures however, the AD-CF still presents a distinctive peak in Dirichlet function, shown in Figure 5(c), while SVD-PC failed to achieve a reliable and accurate estimation of disparity as illustrated in Figure 5 (d). The robustness of LSF in SVD algorithm declines significantly when the number of fitting points becomes too small; the algorithm is vulnerable to noise and unstable in the case of a small matching window. This example demonstrates the robustness of the AD-CF towards illumination variation.
Figure 5. Disparity estimation from a pair of images with different zenith angles using PC-Delta-function and
SVD-PC in a small matching window.
For most sun-synchronised earth observation satellites, the imaging local time is fixed (e.g. 10:00 am) but considerable variation of solar position can occur between images taken in different seasons, such as summer and winter. The seasonal solar position variation is mainly zenith angle change while the azimuth angle change is limited within 30°. Thus AD-CF is robust to seasonal variation of solar illumination for pixel-wise disparity estimation in derivation of DEM from a stereo pair of multi-seasonal images.
5. EXPERIMENT
5.1 Sub-pixel Image Alignment under Different Illumination Conditions
Image alignment experiments were carried out under very different illumination conditions, especially large azimuth angle variation. We used DEM simulated terrain shading images to test the robustness of our algorithm. Terrain shading images were generated using ER Mapper from a DEM dataset of a mountainous region selected from the ASTER GDEM (Global Digital Elevation Model) with 30 m spatial resolution and 7-14 m elevation accuracy.
5.1.1 Azimuth variation
In this experiment, six terrain shading images with the same zenith angle (45°) but different azimuth angles in the range of 60° - 360° were generated, as shown in Figure 6. Figure 6(a) was shifted 4.5 pixels rightward and downward by image up-sampling.
Figure 6. Terrain shading images of different azimuth angles (as annotated) and the same zenith angle 45°.
Matching accuracy is assessed by the average value of shifts in x and y directions:
| | | | (9)
where , , is the measured frame shift, and is the actual frame shift. In this experiment, .
Three PC-based matching algorithms were then compared: SVD, Absolute Dirichlet Curve-fitting (AD-CF) and Absolute Dirichlet SVD (AD-SVD). Table 1 presents the matching accuracy for image matching windows of 512×512, 256×256, and 128×128 pixels. The data in Table 1 shows that the overall PC matching accuracy declines with the decrease of matching window size. SVD based PC is not robust to azimuth angle variation, as it failed in most cases. The reason is that there are both positive and negative fringes in the PC matrix and thus LSF failed to fit a line properly. For CF, it succeeded in most cases, which indicates that AD-CF can be regarded as effective in image alignment and sub-pixel accuracy is generally attainable, especially for the azimuth angle difference within 60°. Compared to AD-CF, AD-SVD achieved higher matching accuracy than SVD-PC and AD-CF for all the three window sizes, averaging 0.05 pixels accuracy. An interesting observation of AD-SVD is that the matching accuracy is (d) SVD fitting
(a) zenith=55°(b) zenith=25° (c) Dirichlet function
(a) 60° (b)120° (c)180°
quite consistent for all illumination variation cases for instance, the accuracy of 60°-120° is almost the same as that of 60°-240°. For matching window of 256×256 pixels and 128×128 pixels, AD-SVD is the most stable and robust among the three algorithms to the three tested window sizes. The matching accuracy of AD-SVD is consistent to all the azimuth angles and mostly less than 0.1 pixels. However, when further reduction of the matching window size to 64×64 and 32×32 pixels, all the three algorithms became malfunction to large azimuth angle differences producing significant errors much greater than 1 pixel.
Table 1. Sub-pixel matching performance of three algorithms for different azimuth angles using window sizes: 512×512 pixels, 256×256 pixels, 128×128 pixels
Azimuth 60°-120°
60°-180°
60°-240°
60°-300°
60°-360°
Aver age
5
1
2
SVD 3.624 7.351 3.291 0.648 0.062 2.995
AD-CF 0.017 0.150 0.330 0.204 0.096 0.155
AD-SVD 0.033 0.050 0.036 0.070 0.039 0.046
2
5
6
SVD 3.600 1.365 0.902 0.317 0.030 1.243
AD-CF 0.061 0.394 0.478 0.442 0.761 0.427
AD-SVD 0.047 0.028 0.016 0.057 0.046 0.039
1
2
8
SVD 0.611 1.592 1.809 1.532 0.061 1.121
AD-CF 0.120 0.392 0.438 4.427 0.163 1.108
AD-SVD 0.050 0.097 0.045 0.135 0.092 0.084
5.1.2 Daily change of solar illumination
In this experiment, terrain shading images (Figure 7) were generated under different azimuth and zenith angles corresponding to the daily azimuth and zenith variation of the sun in two hours interval from 8:00 to 16:00 hours.
Figure 7. DEM simulated terrain shading images under illumination conditions of different time on a day.
The largest azimuth angles difference appears between the time of 08:00 and 16:00, approximately 177°, and in this case, the textures in two related images are almost reversed. The largest zenith difference appears between the time of 08:00 and 12:00, about 36°, resulting in significant global brightness and contrast changes. Again, we shifted the first image (08:00) 4.5pixels in x and y direction, and image matching was then carried out using
SVD, AD-CF and AD-SVD. The matching results are shown in Table 2.
Table 2. Sub-pixel matching performance of three algorithms for daily solar illumination variation (Pixel)
Time SVD AD-CF AD-SVD
08:00-10:00 1.8789 0.1084 0.0165 08:00-12:00 3.7592 0.3796 0.0748 08:00-14:00 0.3184 0.4591 0.1049 08:00-16:00 0.0162 0.1403 0.0384
Table 2 indicates that SVD-PC is not robust to daily sunlight angle variation; it failed in 08:00-10:00 and 08:00-12:00, and only reached sub-pixel accuracy in 08:00-16:00. As for AD-CF, although it succeeded in all time periods, the sub-pixel accuracy was reached for only two cases: 08:00-10:00 and 08:00-16:00. AD-SVD achieved sub-pixel accuracy for all the time intervals at less than 0.1 pixels and its performance is obviously better than the other two algorithms.
5.2 DEM Generation from Multi-seasonal Images
5.2.1 DEM Generation from terrain shading images by different zenith angles
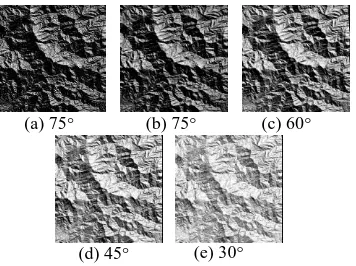
In this experiment, simulated multi-zenith angle terrain shading stereo images were generated from pre-mentioned DEM data. ER Mapper image processing software was used for the imagery data generation. Firstly, the DEM was displayed in a 3D perspective view under a given illumination direction and a terrain shading image was generated in position 1, shown in Figure 8 (a). Then, slightly tilt this DEM 3D perspective display to another view position, the position 2, where another terrain shading image was generated, shown in Figure 8(b). With slightly different view angles, the images captured in these two positions formulate a stereo pair with the baseline of about 80 pixels in x direction and no shift in y direction. Finally, three more terrain shading images were generated under different zenith angles in the view of position 2, as shown in Figure 8 (c)-(e). The image size of these terrain shading images is 990×890 pixels.
Figure 8. Terrain shading images of different zenith angles and the same azimuth angle (60°).
The AD-CF algorithm described in §4.3 was then applied to process these four pairs of stereo images via 32×32 matching window scanning. Four disparity maps are shown in Figure 9, together with the original DEM for comparison. The image resolution of disparity maps is lower than the original DEM, because the terrain shading
(a)8:00 (b)10:00 (c)12:00
(d)14:00 (e)16:00
(a) 75° (b) 75° (c) 60°
images are generated from the DEM dataset by down-sampled 3D visualization. We applied NCC (normalized cross correlation) for disparity quality assessment, because NCC is not sensitive to image sampling. Table 3 presents the NCC coefficients between each generated disparity maps and the original DEM.
Figure 9. Sub-pixel disparity maps compared with original DEM.
Table 3. NCC coefficients between disparity maps and original DEM
Zenith 75°-75° 75°-60° 75°-45° 75°-30°
NCC 0.9825 0.9821 0.9670 0.9484
Although NCC coefficients declined with the increase of zenith angle difference, the overall high correlation values confirm that the disparity maps have been re-constructed from these multi-zenith angles stereo image pairs with high fidelity. This experiment has demonstrated that AD-CF algorithm is able to generate DEMs from stereo images of very different zenith angles.
5.2.2 DEM Generation from terrain shading images under multi-seasonal sun illumination
In this experiment, a stereo pair of DEM terrain shading images was generated according to real sunlight angles in winter and summer. The sunlight angles of London (51°N, 0°) at 10:00 am on 1st January and 1st June were calculated. Figure 10(a) shows simulated winter terrain shading image with azimuth 151° and zenith 79°, and (b) shows summer terrain shading image with azimuth 130° and zenith 37°. The difference of azimuth angle is 21° and the zenith difference is 42°. Judging from the image histograms Figure 10(c) and (d), the grey value distribution of the two shading images is incomparable as the result of different illumination. The stereo pair was then generated in the same way as that in §5.2.1, and the image size is 890×990 pixels.
The disparity map produced by the AD-CF phase correlation scan using a 32×32 pixels matching window is shown in Figure 11(a). Compared with the original DEM in Figure 11(b), the disparity map in Figure 11(a) fully recovers the topography in the reference DEM without visually observable errors though the spatial details are slightly degraded which is inevitable for data re-generation. The correlation between the two data is very high, NCC=0.9616. To illustrate the accuracy, DEM profiles are plotted along the horizontal and vertical lines going through the image centre shown in Figure 11; the
shapes of the re-generated DEM (disparity map) and the original match nearly exactly with slight missing of details as expected. This experiment demonstrates that the AD-CF PC algorithm is robust and invariant to the seasonal solar illumination variation for DEM generation. The processing speed is fast: total 8.75 second, 2.28 seconds for image alignment and 6.47 seconds for pixel-wise disparity estimation.
Figure 10. Disparity map generation from winter and summer terrain shading images.
Figure 11. Comparison between the generated disparity map and original DEM.
5.3.3 DEM Generation from multi-sensors remote sensing imagery
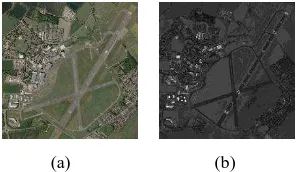
A DEM generation experiment was carried out using an aerial image from Bluesky and a Geoeye satellite image of Cranfied, UK, under different solar illumination conditions. The stereo images are generated by manually clipping the common area in aerial and satellite images as shown in Figure 12. Illumination difference widely exists between the aerial image and the satellite image. The image size is 3602×3698 pixels. Judging from shadow directions in the two images, the sunlight is from SW in the aerial image, while it is from SE in the satellite image. Apart from illumination difference, the stereo images shown in Figure 12 also have global radiation discrepancy and geometric distortion. This adds difficulty for disparity map generation. Dense matching for pixel-wise disparity estimation was carried out using the AD-CF algorithm via 32×32 window matching scanning.
Figure 13 is a 3D perspective view of draping the aerial image on the generated disparity map, which shows that the AD-CF is quite robust to reconstruct the overall 3D terrain surface correctly from this multi-sensor/season non-conventional stereo image pair though there are considerable errors in area of trees that change greatly in different seasons. This preliminary result shows the potential of AD-CF to generate DEM from multi-sensor (a) DEM (b) 75°-75° (c) 75°-60°
(d) 75°-45° (e) 75°-30°
(a) Winter (b) Summer (c) Histogram of (a)
(d) Histogram of (b)
(d) Horizontal profile (c) Vertical profile
(b) DEM (a) Disparity
remote sensing images and thus to enlarge opportunity for 3D mapping where remote sensing images are limited.
(a) (b)
Figure 12. Multi-source remote sensing images for matching. (a) Aerial image (Copyright Blue Sky International Ltd). (b) Geoeye satellite image (Copyright
Digital Globe).
Figure 13. DEM generation by aerial image and satellite image under different illumination.
6. CONCLUSION
In this paper, we investigated the impact of local illumination variation on PC matrix of overlapped images. Through mathematic derivation, we proved that the PC matrix is a result of pixel-wise multiplication of a illumination impact matrix and a translation matrix. Consequently, we found that azimuth angle variation results in inversed fringes and the impact of zenith angle variation is equivalent to increase noise in the PC matrix while the orientation and density of the PC fringes are not altered by illumination change. This is the key factor for PC based image matching algorithms being robust to illumination angle variation, such as the Absolute Dirichlet Curve Fitting (AD-CF) algorithm. Further, we proposed an absolute Dirichlet-based SVD (AD-SVD) algorithm for illumination-insensitive image alignment matching at sub-pixel precision. Via image alignment experiments using simulated terrain shading images with significant illumination angle variation, AD-SVD can reach 0.05 pixel matching accuracy between images no smaller than 128×128 pixels. Then, the well-established AD-CF algorithm was tested for pixel-wise disparity estimation from simulated terrain shading images and aerial-satellite stereo pairs under different illumination conditions.
The research is further progressing and new experiment results of image alignment and DEM generation using more remote sensing images taken under very different sun illumination angles will be presented in due course.
7. REFERENCES
Arandjelovic, Ognjen. (2012). Gradient Edge Map Features for Frontal Face Recognition under Extreme Illumination Changes. Paper presented at the BMVC.
Argyriou, Vasileios, & Vlachos, Theodore. (2006). A Study of Sub-pixel Motion Estimation using Phase Correlation. Paper presented at the BMVC.
Chen, Weilong, Er, Meng Joo, & Wu, Shiqian. (2006). Illumination compensation and normalization for robust face recognition using discrete cosine transform in logarithm domain. Systems, Man, and Cybernetics, Part B: Cybernetics, IEEE Transactions on, 36(2), 458-466.
Fleet, David J. (1994). Disparity from local weighted phase-correlation. Paper presented at the IEEE INTERNATIONAL CONFERENCE ON SYSTEMS MAN AND CYBERNETICS.
Foroosh, Hassan, Zerubia, Josiane, & Berthod, Marc. (2002). Extension of phase correlation to subpixel registration. IEEE transactions on image processing : a publication of the IEEE Signal Processing Society, 11(3), 188-200. doi: 10.1109/83.988953
Hoge, William. (2003). A subspace identification extension to the phase correlation method. IEEE transactions on medical imaging, 22(2), 277-280. doi: 10.1109/TMI.2002.808359
Kuglin, CD. (1975). The Phase Correlation Image Alignment Methed. Paper presented at the Proc. Int. Conference Cybernetics Society.
Liu, J. G., & Yan, H. (2008). Phase correlation pixel‐to‐ pixel image co‐registration based on optical flow and median shift propagation. International Journal of Remote Sensing, 29. doi: 10.1080/01431160802144195
Liu, J., & Yan, H. (2006). Robust phase correlation methods for sub-pixel feature matching. Proc. 1st Annual
Conference of Systems Engineering ….
Morgan, Gareth Llewellyn Keith, Liu, Jian Guo, & Yan, Hongshi. (2010). Precise subpixel disparity measurement from very narrow baseline stereo. Geoscience and Remote Sensing, IEEE Transactions on, 48(9), 3424-3433.
Pizer, Stephen M, Amburn, E Philip, Austin, John D, Cromartie, Robert, Geselowitz, Ari, Greer, Trey, . . . Zuiderveld, Karel. (1987). Adaptive histogram equalization and its variations. Computer vision, graphics, and image processing, 39(3), 355-368.