ACCURACY AND BLOCK DEFORMATION ANALYSIS IN AUTOMATIC UAV AND
TERRESTRIAL PHOTOGRAMMETRY - LESSON LEARNT -
Erica Nocerinoa,b, Fabio Mennaa, Fabio Remondinoa, Renato Saleric
a
3D Optical Metrology (3DOM) unit, Bruno Kessler Foundation (FBK), Trento, Italy Email: (nocerino, fmenna, remondino)@fbk.eu, Web: http://3dom.fbk.eu b Parthenope University of Naples, Dept. of Applied Science, 80143 Naples, Italy
c MAP-Aria, UMR CNRS-MCC, Lyon, France, Email: [email protected]
KEY WORDS: UAV, accuracy, photogrammetry, block deformation, camera network
ABS TRACT:
The paper reports the results of an integrated Unmanned Aerial Vehicle (UAV) and terrestrial photogrammetric survey realized in the archaeological site of the Roman theatre in Ventimiglia, Italy. The main deliverables were 2D drawings at scale 1:20, which required a Ground Sample Distance (GSD) less than 4 mm and, consequently, accuracy better than 4 mm. The UAV was employed to acquire both vertical and oblique images, while the terrestrial imaging acquisition was realized with the aim of generating separate dense point clouds of some vertical structures, corresponding to the sections required. The variability of results with automatic photogrammetric procedures against different image network configurations, with and without ground control, are analysed and presented.
1. INTRODUCTION
The use of automated photogrammetry for 3D digital recording and documentation has been becoming very popular over the last few years thanks to the evolution of new computer vision algorithms and computation techniques that have strongly speeded up the processing time, known to be a weak point of photogrammetry. In the first years of 2000’s laser scanning seemed to be the only feasible solution to 3D dense digitization in different fields of application ranging from small artefacts up to large archaeological sites. The use of close-range photogrammetry seemed to be limited only to simple 3D modelling purposes or texturing of 3D models. In 2004, very optimistic researchers even predicted that traditional surveying methods like tacheometry or close-range photogrammetry might have completely replaced by 3D scanning in the near future (Boehler & M arbs, 2004). Up to some years ago laser scanning was still the preferred 3D digitization technique, especially for large and complex areas for which photogrammetry was considered to be time consuming and difficult to use for non-experts (Rizzi et al, 2011). Nowadays, new efficient algorithms, mainly coming from the compute vision community and known as Structure From M otion (SfM ) algorithms, have significantly increased automation and hence strongly speed up the image-based processing workflow. Different packages are nowadays available for performing image orientation task and generating 3D point clouds fully automatically, either at commercial level or in the open-source domain. These tools have become very popular and an increasing number of publications have underlined (again) the potentialities of the image-based technique as a cost effective solution for 3D digitization. Several scientific publications have been published over the last three-five years focusing on the comparison and integration between laser scanning and automated photogrammetry/SfM proving the equivalence of these techniques in specific real case studies in terms of reconstructed geometric details and achievable accuracy (Remondino et al., 2008; Skarlatos & Kiparissi, 2012). The complexity of the topic itself and the diversity of software implementation makes difficult to produce an extensive and deep analysis that takes into account obtained precision, accuracy and reliability against planned and expected values. When it comes to automated image triangulation, researchers investigated the performances and reliability of existing commercial and open-source packages using large
blocks of images (Barazzetti et al., 2011; Del Pizzo & Troisi, 2011; Gherardi et al., 2011; Roncella et al, 2011; Deseilligny & Clery, 2011; Remondino et al., 2012) Nevertheless most of the results were exposed in the image space as bundle adjustment statistics. In the last years, Unmanned Aerial Vehicles (UAVs) have been used in an increasingly broad range of applications, including cultural heritage and archaeology (Eisenbeiss & Sauerbier, 2011), landscape classification (Gini el al., 2012), etc. As for terrestrial applications, the scientific interest was highly focused on the top ic of automated aerial triangulation procedure, starting from the autonomous flight control (Bäumker & Przybilla, 2012), up to the image orientation, dense matching, DSM and orthoimage generation (Haala & Rothermel, 2012). Accuracy analyses were usually performed using pre-signalized control points measured with GNSS technique (Kung et al., 2011). As a consequence of the growing number of UAV applications for civil issues, the Civil Aviation Authorities of several European countries have started to prepare and agreed upon major and comprehensive requirements and rules for the flying operations of unmanned vehicles. But so far no clear rules are available and every state has its own rules.
Up to now, to the knowledge of the authors, there are no scientific publications that present the variability of results with automatic photogrammetric procedures against different image network configurations. Typical SfM procedures developed in the computer vision community do not take into account camera network design (Fraser, 1996) or block deformations (Kraus, 1997) as they focus more on the speed of the implemented procedures and the success in image orientation even if the orientation parameters can be no reliable at all in some cases (Remondino et al., 2012). The repeatability of automatic
procedures is another interesting research issue. In the author’s
experience, different and not consistent results can be obtained using the same image dataset but importing images in a different sequence order. Since photogrammetry was born, network design has been a key topic when accurate and reliable measurements have to be performed.
a) b)
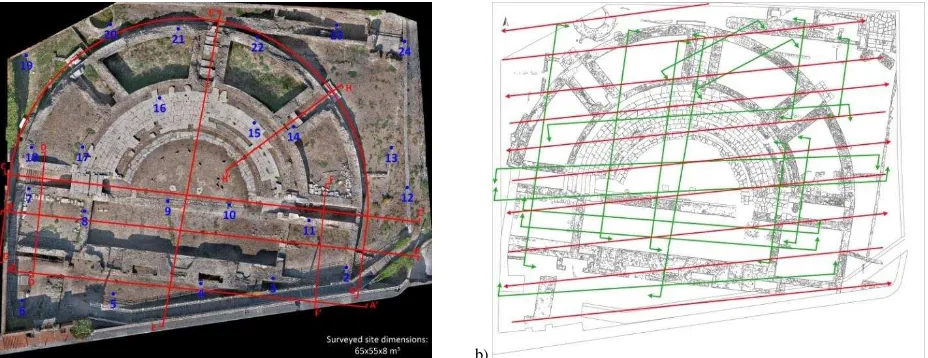
Figure 1. a) Orthoimage of the Roman theatre in Ventimiglia, Italy. The red lines represent the required cross sections and orthographic views. The blue dots are the points measured with the total station and afterwards used as GCPs and CPs for the photogrammetric surveys. b) Plant of the theatre with the aerial vertical (in red) and oblique (in green) strip s realized with the UAV platforms.
Camera network with high redundancy and intersection angles close to 90 degrees are more reliable if compared to image sequences as usually seen in SfM procedures (Alsadik et al., 2013).
In this paper some qualitative and quantitative analyses using different UAV and terrestrial camera network configurations are reported in the case of the digital documentation of a complex archaeological structure – the roman theatre in Ventimiglia, Italy. A full photogrammetric 3D modelling workflow is applied in order to derive 2D maps, parallel views of cross sections and orthoimages at scale 1:20. An UAV was used to acquire both vertical and oblique images along different image strips which were then combined with traditional terrestrial acquisitions.
2. THE VENTIMIGLIA PROJECT
Ventimiglia is an Italian city in Liguria region. It is located on the Gulf of Genoa, very close to the Italian-French border. Its Latin name was Albium Intemelium, later Albintimilium, from an ancient tribe, the Intemelii, that lived in that region before the advent of the Romans. Albintimilium experienced a prosperous period during the II century AD under the Roman Empire, when important public buildings, such as the theatre and thermal baths, were realized. First archaeological excavations that brought to light the thermal baths and part of the theatre were carried out at the end of the XIX century and continued until the mid-1900s. Nowadays, the ruins of the ancient Albintimilium are one of the most relevant archaeological sites in Liguria. The complex has been included by local and state administrations in a program for preservation and restoration of archaeological areas. In particular, the project, founded by the Italian M inistry for Cultural Heritage, aims to make the site in Ventimiglia accessible to tourists and open to public cultural events (i.e., live performances). The restoration project required the execution of preliminary survey with the aim of ascertaining and documenting the current situation. For the Ventimiglia project, the 3D recording and modelling of the archaeological site was not specifically required by the customers, whereas the desired records were 2D drawings, focused to the successive archaeological and architectural analyses like stratigraphy , redevelopment of the ancient buildings, etc. In particular, the main required deliverables were: (i) plants of the theatre at scale 1:100 and 1:20; (ii) six sections at scale 1:20 with respect to planes named BB’, CC’, DD’, EE’,
FF’, HH’ in Figure 1a; (iii) two orthographic drawings in 1:20
scale of the external surfaces of the theatre with respect to plane
AA’ and cylindrical development GG’ in Figure 1a. The realization of a 3D control surveying network, comprising the whole archaeological area, was also needed. The required 1:20 drawing scale was the leading parameter for planning the survey, in terms of both plotted finest detail (or minimum ground distance) and measurement accuracy. Assuming a plotting accuracy of 0.2 mm, the ground sample distance (GSD) to be assured was less than 4 mm and, consequently, accuracy better than 4 mm had to be guaranteed.
To meet the project requirements, the following integrated surveying methodology was selected: (i) classical topographic survey with total station to realize the control network of the archaeological area; (ii) static positioning GNSS survey with two geodetic GNSS receivers to perform the datum transformation; (iii) aerial and terrestrial photogrammetric surveys to produce the 2D drawings. For redundancy and completeness, also a laser scanning survey of the theatre was realized.
3. DATA ACQUIS ITION
3.1 S urvey key points signalization
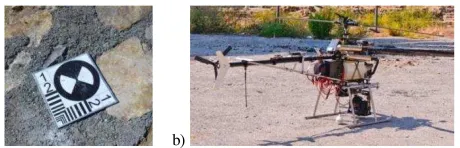
Before starting the surveying, several well-distinguishable control points were evenly distributed within the area of interest. Two different types of points were signalized and fixed on the ground or theatre structures: (i) points for the topographic network using proper survey nails and (ii) points for the aerial and photogrammetric surveys – later used as GCPs (Ground Control Points) and CPs (Check Points) (Figure 1a). The ad-hoc realized photogrammetric coded markers are shown in Figure 2a: consecutive black and white line pairs (lp) corresponding to three different spatial resolutions (1 lp/4 mm, 1 lp/8 mm, 1 lp/12 mm) are printed on both vertical and horizontal sides of the targets. The line pairs were used to verify on site that the geometric resolving power of the images met the project requirement i.e. the geometric resolving power was such as to distinguish on the ground details smaller than the GSD of 3 mm.
3.2 3D surveying network and GNS S survey
Two GNSS double-frequency receivers Topcon HiperPro with geodetic antennas were used in static relative positioning (four hour long acquisition in average), reoccupying eight points of the surveying network, four of which coincided with four stations.
a) b)
Figure 2. Photogrammetric marker with black and white line pairs corresponding to three different spatial resolution (a). The employed UAV for the photogrammetric aerial survey (b).
3.3 UAV and terrestrial photogrammetry
The photogrammetric survey was realized in two separate steps - aerial and terrestrial. The image acquisition was planned bearing in mind the project requirements - a GSD of about 3 mm - and, at the same time, with the aim of guaranteeing a high level of automation in the successive phase of data elaboration.
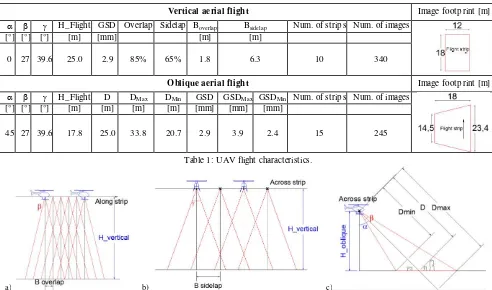
The employed UAV, the “Copter 4” developed by Survey Copter (http://www.survey -copter.com/english/accueil.html), is shown in Figure 2c. The model-helicopter has a 1h30’ flight duration capability and a 35kg of M aximum Take Off Weight (M TOW). 10 kg of maximum payload are allowed and this gives the possibility to carry on-board, together with standard equipment for navigation and control, also professional-grade full frame cameras. The model-helicopter can flight both in assisted or autonomous way, following a flight path defined by georeferenced way points. For the Ventimiglia project, the model-helicopter was equipped with a 24 M egapixel Nikon D3X full frame camera (pixel size of 5.95 m) mounting a 50 mm lens (the focus was locked). Both vertical and oblique images (with a mean angle from the vertical of about 45°) were acquired over the theatre. Ten vertical/nadir and fifteen oblique aerial strips were realized (Figure 1b). The flight characteristics are summarised in Table 1 and shown in Figure 3a-b-c. For the vertical strips, a forward overlap of 85% (corresponding to an average distance of 1.8 m along each strip) and a sidelap of 65% between two adjacent strips (corresponding to an average distance of 6.3 m across strip) were assured. The flight height for the oblique images was reduced, compared with the vertical strips, in order to take into account the image scale variation deriving from the non-vertical camera set up . The definition of the datum (scale and coordinate reference system) was realized using the reference points measured with the total station. A camera calibration was carried out after the flight.
On the other hand, the terrestrial photogrammetric survey was realized using the same camera coupled with different lenses depending on the distance from the surveyed structures. The images were specifically acquired with the aim of generating separate dense point clouds of the vertical structures, corresponding to the sections required by the project. The theatre was divided in several parts and for each part separate close-range photogrammetric networks were designed. M ultiple convergent images were included in the imaging geometry to maximize the block accuracy. Some 2 m long scale bars were positioned in different positions as check. For the datum transformation (definition of scale and coordinate system) of each single block, it was planned to use both the reference points measured with the total station and points measured in the centring of the prism pole over the key points, mainly caused by reflector and circular bubble centring errors. Indeed, for the employed prism pole, a theoretical accuracy of the circular bubble of 10’ is reported, that corresponds to a planimetric error of about 4 mm for a pole height of 1.5 m.
The GNSS data processing provided a sub-centimetre accuracy. The coordinates of the stations, obtained in WGS84, were used to compute the datum transformation to provide the products in the UTM /WGS84 reference system.
4.2 UAV photogrammetry
The fully automatic aerial triangulation procedure was divided into two sequential steps according to the leading principles of reducing the processing time but, concurrently, assuring quality and accuracy assessment of the results. Firstly, using state-of-art automated image orientation tools (SfM ), the UAV block was triangulated. Then the extracted tie points were filtered in order to reduce the image observations to a number manageable by classical photogrammetric bundle adjustments. The filtering and anti-clustering step was performed with the aim to regularize the distribution of the tie points in the object space. A regular volumetric grid was generated and the side length of each cell or cube was set equal to a fixed percentage of the image footprint. The 3D tie points that were inside each cube were collected in a subset. A score was assigned to each point on the basis of the following properties listed in ascending order of importance: (i)
point’s visibility on images belonging to different blocks (i.e., vertical or oblique flights) or different strips, (ii) point’s visibility on more than two images, (iii) point’s proximity to the barycentre of the considered volumetric cell. The 3D tie points with the highest score in each cell were kept. In this way, the filtered 3D tie points were reduced in average to 1/10 of the original number, preserving connectivity and reliability requirements. The selected tie points and the exterior orientation parameters derived from SfM were used as image observations and initial approximation values, respectively, in a photogrammetric bundle adjustment tool in order to check the solution through statistical parameters (image residuals, standard deviations and correlations of the parameters) not provided by SfM tools.
Different analyses were then performed considering the following bundle block versions (Table 2):
(A) use of only the vertical block in a free network solution; (B) use of only the vertical block including 5 GCPs;
(C) both vertical and oblique imagery in a free network solution; (D) both vertical and oblique imagery including 5 GCPs. The 5 GCPs used in the bundle adjustment were points 2, 6, 9, 20, 24 in Figure 1a. The other points were used as CPs. The accuracy of the different versions was evaluated in object space by comparing the coordinates of CPs derived from photogrammetric triangulation with respect to the same coordinates measured within the surveying network (Root M ean Square Error - RM SE). The datum transformation in the case of free network solution was performed computing a similarity transformation with scale factor. The RM SEs on the CPs are summarised in Table 2.
Vertical aerial flight Image footprint [m]
H_Flight GSD Overlap Sidelap Boverlap Bsidelap Num. of strips Num. of images
[°] [°] [°] [m] [mm] [m] [m]
0 27 39.6 25.0 2.9 85% 65% 1.8 6.3 10 340
Oblique aerial flight Image footprint [m]
H_Flight D DMax DMin GSD GSDMax GSDMin Num. of strips Num. of images
[°] [°] [°] [m] [m] [m] [m] [mm] [mm] [mm]
45 27 39.6 17.8 25.0 33.8 20.7 2.9 3.9 2.4 15 245
Table 1: UAV flight characteristics.
a) b) c)
Figure 3. a-b) Acquisition geometry of the photogrammetric aerial vertical flight. c) Acquisition geometry of the oblique flight.
VERSION RM SExy [pixel] RM SEX [mm] RM SEY [mm] RM SEZ [mm]
A VERTICAL FREE NET 0.15 5.9 5.8 12.9
B VERTICAL 5 GCPs 0.13 5.0 5.4 4.5
C VERTICAL + OBLIQUE FREE NET 0.16 5.5 6.1 2.8
D VERTICAL + OBLIQUE 5 GCPs 0.12 5.0 5.8 3.0
Table 2: Checkpoint RM SEs estimated with different bundle adjustment computations and network configurations (GSD = 3 mm).
a) b) c)
D-C A-C B-C
Fig. 4: Euclidean distances [mm] between meshes triangulated over 3D coordinates of tie points obtained with different bundle adjustment computations and network configurations (named version A, B, C and D).
The results of scenarios C and D show no statistically significant differences, suggesting that the block configuration is strengthen by oblique images. Further comparisons were made between mesh models generated interpolating the extracted 3D tie points (Figure 4). Euclidean distances were computed between the meshes, using the results achieved in version C as reference. This analysis clearly shows the typical polynomial deformations (M ikhail et al., 2001) of the pure vertical block configuration. It is worth to notice that the deformation of version A can lead to errors up to 50 mm when measuring height differences between
4.3 Terrestrial photogrammetry
Each close-range photogrammetric block was processed separately , both in free network and including GCPs in the bundle adjustment. In the first case, the datum was defined using both the reference points measured with the total stations and natural points well distinguishable on the oblique aerial photos. The scale bars visible in the images were used to check the accuracy of the results.
Figure 5. Comparison [mm] between two point clouds of the
wall GG’ (Figure 1a), generated respectively with bundle
adjustment solutions in free network and with 3 GCPs. Strong deformations are clearly visible at the end of the image block for the free network solution.
Figure 6. The 2.5D DEM derived from the UAV imagery.
In the case of imaging block for long wall (e.g., the cylindrical
development GG’ in Figure 1a), it was evident that systematic errors accumulated through the elongated strip, and caused a twist of the model. In the case of the cylindrical wall in Figure 5, the photogrammetric network included also inclined photos that did not preserve the model from being deformed. Indeed, the cylindrical shape of the object did not allow having a strong coverage of the entire object. After the image orientation, the block resulted deformed, a behaviour very similar to the results of aerial bundle with only vertical images. The block deformation was corrected including GCPs in the bundle solution. Figure 5
shows the comparison between two point clouds of wall GG’,
generated respectively with bundle adjustment solutions in free network and with 3 GCPs evenly distributed over the wall. The comparison shows strong differences within the range ±300 mm that underline deformability of camera network.
4.4 Products
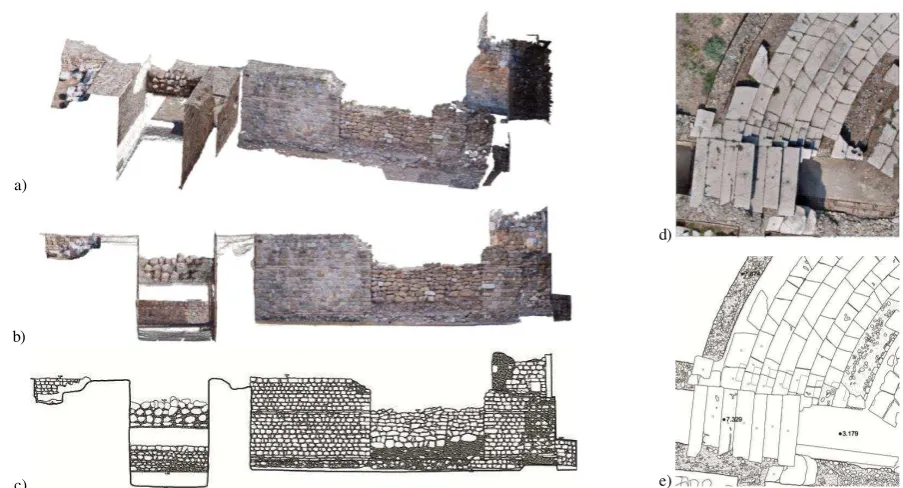
After the image triangulation, the imagery were processed with dense automatic matching algorithms. A 2.5D DEM (Digital Elevation M ode, Figure 6) at 5 mm resolution was produced to provide archaeologists a useful tool to derive height values over the theatre. The dense oint clouds were used to derive orthoimages of the theatre from different points of view (Figure 7a). The orthoimage from the aerial images (Figure 1b, Figure 7d) was used as basis to draw the plans using standard CAD tools (Figure 7e), as required by the project. Analogously, the orthoimages (Figure 7b) from the terrestrial images were digitalized to deliver 2D sections (Figure 7c).
5. CONCLUS IONS
The paper reported some experiences collected during the survey and 3D modelling of a complex archaeological structure. The high resolution and accuracy of the products required by the project demanded a careful planning of acquisition and processing stages. The reliability of the entire workflow was guaranteed by ground control measurements evenly distributed over the theatre’s area. M ore than 1000 UAV and terrestrial images were acquired and processed with highly automated photogrammetric procedures that showed great potentialities in terms of spatial resolution and processing time. At the same time it came clear the need of a minimum number of ground controls for verifying the reliability of the results and the absence of deformation in object space. Due to the project requirements, deformations at cm level were not neglectable. Indeed, in standard vertical acquisition from UAV or terrestrial single strip images, a poor camera network configuration can lead to not accurate results even if statistical parameters from the bundle adjustment result satisfactory. The inclusion of oblique image strips considerably strengthen the camera network geometry leading to results that do not significantly differ from controlled solution. The vertical and oblique image blocks together were used for the generation of accurate GCPs needed as control for the terrestrial image strips. Although block deformation is not alway s considered, it is an important factor which affects the quality of the delivered results – in particular when dealing with 1:20 maps and 3 mm GSD.
The achieved accuracy (RM SEs) are still not as good as in aerial photogrammetry with classical digital cameras. But when we deal with UAV acquisitions and restitutions, there are many parameters affecting the final uncertainty of the results which should be all taken into consideration and correctly modelled.
ACKNOWLEDGMENTS
a)
d)
b)
e) c)
Figure 7. Digitalization of section FF’ shown in Figure 1a: Point cloud from terrestrial photogrammetry (a), ortho image (b) and CAD section (c). A particular of the orthoimage from aerial imagery (d) and the produced CAD drawing (e).
REFERENCES
Alsadik, B., Remondino, F., Menna, F., Gerke, M., Vosselman, G., 2013. Robust extraction of image correspondences exploiting the image scene geometry and approximate camera orientation. Int. Arch. of Photogrammetry, Remote Sensing and Spatial Inform ation S ciences,
Vol. 40(5/W1), pp. 1-7.
Barazzetti, L., Forlani, G., Remondino, F., Roncella, R., Scaioni, M., 2011. Experiences and achievements in automated image sequence orientation for close-range photogrammetric projects. Proc. of
Videom etrics, Range Im aging and Applications XI, SPIE Optical Metrology, Vol. 80850F-1-13.
Bäumker, M., Przybilla, H.-J., 2011. Investigations on the accuracy of the navigation data of Unmanned Aerial Vehicles using the example of the system mikrokopter. Int. Arch. of Photogrammetry, Remote Sensing and Spatial Inform ation Sciences, Volume 38(1/C22).
Boehler, W., Marbs, A., 2004. 3D scanning and photogrammetry for heritage recording: a comparison. In Proc. 12th Int. Conference on Geoinform atics, pp. 291-298.
Del Pizzo, S., T roisi, S., 2011. Automatic orientation of image sequences in Cultural Heritage. Int. Arch. of Photogram m etry, Rem ote Sensing and Spatial Inform ation Sciences, Vol. 38(5/W16).
Deseilligny, M. P., Clery, I., 2011. Apero, an open source bundle adjusment software for automatic calibration and orientation of set of images. Int. Arch. of Photogram m etry, Rem ote Sensing and Spatial Inform ation Sciences, Vol. 38(5/W16).
Eisenbeiss, H., Sauerbier, M., 2011. Investigation of UAV systems and flight modes for photogrammetric applications. The Photogram m etric Record, Vol. 26(136), pp. 400-421.
Fassi, F., Fregonese, L., Ackermann, S., De T roia, V., 2013. Comparison between laser scanning and automated 3D modelling techniques to reconstruct complex and extensive cultural heritage areas.
Int. Arch. of Photogrammetry, Remote Sensing and Spatial Information Sciences, Vol. 40(5/W1), pp. 73-80.
Fraser, C.S., 1996. Network design. In Close-range Photogram m etry and Machine Vision. Whittles Publishing UK pp. 256-282.
Gini, R., Passoni, D., Pinto, L., Sona, G., 2012. Aerial images from an UAV system: 3D modeling and tree species classification in a park area.
Int. Arch. of Photogrammetry, Remote Sensing and Spatial Information Sciences, Vol. 34(B1), pp. 361-366.
Haala, N., Rothermel, M., 2012. Dense multiple stereo matching of highly overlapping UAV imagery. Int. Arch. of Photogram m etry, Rem ote Sensing and Spatial Inform ation Sciences, Vol. 39(B1)
Kraus, K., 1997. Photogrammetry. Volume 2: Advanced Methods and Applications. Ferd-Dümmlers Verlag.
Küng, O., Strecha, C., Beyeler, A., Zufferey, J. C., Floreano, D., Fua, P., Gervaix, F., 2011. The Accuracy of Automatic Photogrammetric T echniques on Ultra-Light UAV Imagery. Int. Archives of Photogrammetry, Remote Sensing and Spatial Inform ation Sciences, Vol. 38(1/C22), pp. 14-16.
Mikhail, E. M., Bethel, J. S., McGlone, J. C., 2001. Introduction to Modern Photogram m etry. John Wiley&Sons. Inc., New York.
Remondino, F., El-Hakim, S., Gruen, A., Zhang, L., 2008. T urning images into 3D models - Development and performance analysis of image matching for detailed surface reconstruction of heritage objects.
IEEE Signal Processing Magazine, Vol. 25(4), pp. 55-65.
Remondino, F., Del Pizzo, S., Kersten, T. P., Troisi, S., 2012. Low-Cost and Open-Source Solutions for Automated Image Orientation–A Critical Overview. Proc. Eurom ed 2012, LNCS Vol. 7616, Springer Berlin Heidelberg, pp. 40-54.
Rizzi, A., Baratti, G., Jimenez Fernandez-Palacios, B., Girardi, S., Remondino, F., 2011. 3D Recording for 2D delivering - T he employment of 3D models for studies and analyses. Int. Arch. of Photogrammetry, Remote Sensing and Spatial Inform ation Sciences, Vol. 38(5/W16).
Roncella, R., Re, C., Forlani, G., 2011. Performance evaluation of a structure and motion strategy in architecture and cultural heritage. Int. Arch. of Photogramm etry, Rem ote Sensing and Spatial Inform ation Sciences, Vol. 38(5/W16).
![Figure 5. Comparison [mm] between two point clouds of the wall GG’ (Figure 1a), generated respectively with bundle adjustment solutions in free network and with 3 GCPs](https://thumb-ap.123doks.com/thumbv2/123dok/3195113.1391937/5.595.66.285.374.551/figure-comparison-figure-generated-respectively-adjustment-solutions-network.webp)