CAPTURING REALITY AT CENTRE BLOCK
C. Boulangera, C. Ouimeta, N. Yeomansaa Heritage Conservation Services, Public Services and Procurement Canada, 30 Victoria St, Gatineau, Quebec
KEY WORDS: Structure from Motion (SFM) Photogrammetry, Photographic Lighting, Close-Range Photogrammetry, Terrestrial Laser Scanning, Heritage Documentation, Building Information Model
ABSTRACT:
The Centre Block of Canada’s Parliament buildings, National Historic Site of Canada is set to undergo a major rehabilitation project that will take approximately 10 years to complete. In preparation for this work, Heritage Conservation Services (HCS) of Public Services and Procurement Canada has been completing heritage documentation of the entire site which includes laser scanning of all interior rooms and accessible confined spaces such as attics and other similar areas. Other documentation completed includes detailed photogrammetric documentation of rooms and areas of high heritage value. Some of these high heritage value spaces present certain challenges such as accessibility due to the height and the size of the spaces. Another challenge is the poor lighting conditions, requiring the use of flash or strobe lighting to either compliment or completely eliminate the available ambient lighting. All the spaces captured at this higher level of detail were also captured with laser scanning. This allowed the team to validate the information and conduct a quality review of the photogrammetric data. As a result of this exercise, the team realized that in most, if not all cases, the photogrammetric data was more detailed and at a higher quality then the terrestrial laser scanning data. The purpose and motivation of this paper is to present these findings, as well provide the advantages and disadvantages of the two methods and data sets.
1. INTRODUCTION
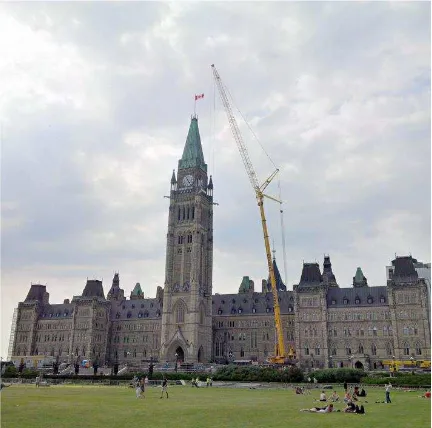
The Centre Block Canada’s Parliament buildings in Ottawa, Ontario, is a federally designated heritage site in Canada for its historic, ceremonial and iconographic values. It houses the House of Commons and Senate chambers and is the epicenter of federal politics in Canada. Centre Block was built from 1859-1876 but all of the building, with the exception of the Library of Parliament, was burned down in 1916. The building that we see today began construction in 1916 and was completed in 1920 (History of the Hill, 2017). The Centre Block is slated to be closed between 2018 and 2028 for a major rehabilitation project (Rehabilitating the Centre Block, 2017). In preparation for this rehabilitation, HCS was tasked with documenting the entire building to create a record of the condition of the Centre Block before the 2018-2028 rehabilitation gets underway. Another purpose of the documentation was to develop Building Information Model (BIM) in collaboration with the Carleton Immersive Media Studio (CIMS). The main method of documentation was laser scanning, as it was a quick method to capture accurate metric data. Photos were also taken as a visual record in support of the laser scanning. Every accessible interior space was captured in this way from 2015-2017, including attic spaces, mechanical rooms, offices, basement spaces, and tunnels totaling approximately 2500 scans. The exterior was also scanned by CIMS. Another method used for the documentation was Structure from Motion (SFM) photogrammetry. This method was used for select special spaces, as identified in the Conservation Guidelines for the Interior of the Centre Block, Parliament Hill. These spaces included, the House of Common Chamber and adjacent spaces, the Senate Chamber and adjacent spaces, the Hall of Honour and Confederation Hall (Rotunda), the former House of Commons Reading Room and the House of Commons’ Speaker’s dining room. The exterior of the Peace Tower was also documented using photogrammetry with the aid of a crane (Figure 1). The purpose of this paper is to compare the two methods of documentation by illustrating the pros and cons as it relates to the development of a BIM.
Figure 1: Photography of Peace Tower for SFM photogrammetry using a crane (HCS, 2015).
2. DOCUMENTATION METHODOLOGY
Two main methods of documentation were used to record the interior and exterior of the Centre Block: (1) Terrestrial Laser Scanning and (2) Structure from Motion Photogrammetry (SFM).
2.1 Terrestrial Laser Scanning
session, therefore all the data also needed to be tied to a common survey network. A series of benchmarks were established in 1998 that cover the hallways of every floor, as well as outside, across the Parliament Hill grounds, and on the exterior face of the buildings on the Hill. This geo-referenced survey network was added to as necessary and used for this documentation project. This ensured that all data captured by the laser scanner was in a single coordinate system. Depending on the size and the detail of the space that was being recorded, the resolution of the scans was set to 6-12mm/10m, but due to overlapping scans, the actual resolution achieved is higher. Where possible scans were taken with images to attribute red, green, and blue (RGB) values to the resulting point cloud.
.2 Structure from Motion Photogrammetry
As mentioned, photogrammetry was only used for select special spaces. These are spaces designated in the Conservation Guidelines as having special significance for the heritage value of the building. These are often highly decorative spaces with elaborately carved masonry or wood walls. The images for the SFM models were taken at a minimum resolution of 1 pixel per millimeter, using a full frame Digital Single-Lens Reflex (DSLR) camera, and a lighting kit. Although not recommended for SFM (Agisoft, 2017), due to the poor interior lighting, it was necessary to use flash photography. Several stand-alone synchronized flashes were positioned around the room, or subject, to override existing interior lighting and provide even lighting with minimal shadows. Flashes were kept in the same position as much as possible to ensure consistent lighting conditions throughout the dataset. The majority of spaces captured using this methodology were very tall and the use of a man lift, telescopic tripod or crane were necessary to have achieved consistent coverage the full height of the wall. Since flash photography was used, minimal adjustments were made to the images in the post processing stage to ensure uniformity in exposure and white balance. This was especially relevant if datasets were captured across several days.
The datasets were then run through SFM processing software such as Agisoft PhotoScan and Bentley Context Capture. Where possible a whole room was modelled together to achieve higher accuracy. However, when datasets were too large or spaces were highly symmetric, each elevation of a room was run separately. Ground control surveyed on site was added to scale and oriented the model in the same coordinate system as the laser scanning. Outputs extracted from these models were orthographic photo elevations used as visual assessment tools and posterity records, and point cloud data which was used in the development of the BIM.
3. PHOTOGRAMMETRY OR SCANNING?
3.1 Benefits of SFM Photogrammetry
One of the primary benefits of photogrammetry is the feasibility of achieving a high resolution textured model with minimal occlusions. Occlusions occur when there is an object between the surface being captured and the point of capture. These can be static objects, such as furniture, moving objects such as people, or even features on the surface itself, such as protruding moldings, alcoves or the corners of walls. Most of these occlusions can be resolved in laser scanning by taking scans from several positions in a room. However, the scanner is limited to capturing data from the ground level which increases the likelihood of occlusions near the ceiling. Since images used for
SFM are taken the full height of the wall, these types of occlusions are limited (Figure 2).
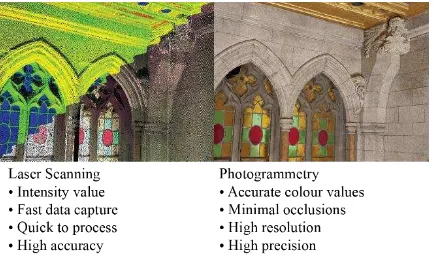
Figure 2: North-West corner of Senate Chamber illustrating benefits of laser scanning and photogrammetry. From right to left, intensity value point cloud from laser scanning, RGB point
cloud from laser scanning, and textured mesh from photogrammetry (HCS, 2017).
Another benefit of SFM photogrammetry is the accuracy of the visual representation. The quality of colour in laser scanning point clouds is much less. This is due to the limitations of the instruments being used to capture data as well as how the colour values are assigned to the model. A Faro Focus 3D x 120 scanner and a Faro Focus 3 x 130 scanner were used for this documentation. In these instruments, when colour is set to on, a built in low resolution camera automatically takes images. RGB values are then extrapolated from these images and attributed to individual points in the respective point cloud in the registration software. In photogrammetry, a DSLR camera is used to capture high resolution images, which are rectified for distortion in SFM software and projected onto a mesh surface produced in the same SFM software. External factors, such as lighting are also manipulated in photogrammetry, which improves the quality of the images and in turn the texture of the photogrammetric model. In both cases, the quality of the colour is limited by the quality of the images taken.
The feedback from the BIM consultant is that the photogrammetric model is more photorealistic and better defined than the point clouds outputted from the laser scanner, making it clearer and quicker to model from, resulting in a higher level of detail BIM.
3.2 Limitations of SFM Photogrammetry
visualizing dark spaces as it capture intensity values. Cluttered spaces, sometimes the reality of documenting occupied building, are also problematic for SFM photogrammetry. Due to these limitations, laser scanning is a good methodology to capture the majority of the spaces in Centre Block such as the attic, basement, corridors, offices, mechanical rooms and washrooms.
4. TIME-VALUE COMPARISON OF DATA CAPTURE AND POST PROCESSING
Another factor that needs to be considered when evaluating which methodology of documentation is preferable is the cumulative amount of time that it takes to achieve the desired outputs and the value it has for the development of the BIM and other applications. In general, laser scanning is a much quicker methodology than photogrammetry, involving less steps. However, photogrammetric models present a lot more value for the development for the BIM as well as in various other applications, such as line drawings, orthophotos, and virtual reality (Figure 3).
Figure 3: Time and value graph comparing SFM photogrammetry and terrestrial laser scanning (HCS, 2017).
4.1 Data Capture
For terrestrial laser scanning, at the desired resolution (6-12mm per 10 m) with images for colorizations, it takes from 8-12 minutes per scan. With setup and surveying, the average time is 30 minutes per office (28m2), for approximately one to three scans depending on the configuration of the room. For taller spaces with important ceiling details, it is necessary to increase
scan resolution and in turn the scan duration, (up to 30 minutes per scan) in order to capture sufficient detail at the ceiling level.
Photogrammetry takes significantly longer to capture. There is more setup time, as lights need to be positioned and tested. Then each wall surface is captured systematically in vertical strips. If a pole or a man lift is used, this increases the time needed as they are slow to operate. On average it takes one to three days to capture all the images needed for the photogrammetric model, keeping in mind that the spaces being captured are very big and sometimes very complex.
4.2 Post Processing with Automated Software
The lab time required is also longer for photogrammetry than for laser scanning. The software used to register scans is automated, and only requires time to verify the accuracy of scan placement. Occasionally, natural targets, such as planes or points, need to be added if there are not enough artificial targets captured in the scene.
The photogrammetry software is also automated but time is needed to organize and adjust images to increase the probability of the software correctly placing the images. To correctly scale and orient the model, as is necessary for many applications, reference points need to be picked on several images. In this case, for the development of the BIM it was important to tie the photogrammetric models to the same coordinate system as the laser scanning. The time needed to process a photogrammetric model was also more unpredictable as they involved large datasets and there were several parameters to consider in the alignment process.
On average it will take half a day to a day to process a group of scans, including computer-processing time. Photogrammetric models can take up to a week to process for an entire space, again, including computer-processing time.
4.3 BIM Application
Figure 4: High level of detail BIM overlaid with photogrammetric textured model of the Senate Chamber West
Elevation (CIMS, 2017).
4.4 Case Study
Two examples are shown below (Table 1) to illustrate the time it takes to capture and process the data in relation to the size and complexity of the space.
HOUSE OF COMMONS READING ROOM Dimension: 13.5m x 20.5m x 8m
Methodology Terrestrial laser scanning
SFM
Photogrammetry No. of Scans/
Images
6 886
Resolution* ¼ or 1
pt/6.136mm/10m
≥1 pixel/mm
Time per scan (Min)
11:22 N/A
Total Data Capture Time (site work)
1.5 hours 8 hours
Processing Time* (office work)
3 hours 40 hours
ROTUNDA (CONFEDERATION HALL) Dimension: 17m x 17m x 8.7m
Methodology Terrestrial laser scanning
SFM
photogrammetry No. of Scans/
Images
20 and 10 670
Resolution* ⅛ or
1pt/12.272mm/10m and ¼ or
1pt/6.136mm/10m
≥1 pixel/mm
Time per scan (Min)
6:00 and 11:22 N/A
Total Data Capture Time (site work)
6 hours 8hours
Processing Time* (office work)
3 hours 40 hours
Table 1: Comparison of each methodology for the House of Commons Reading Room (left) and the Rotunda (above).
*Note that resolution for terrestrial laser scanning is for a single scan, and overlap between scans may increase the actual
resolution that is achieved. Processing time indicated includes computer processing time.
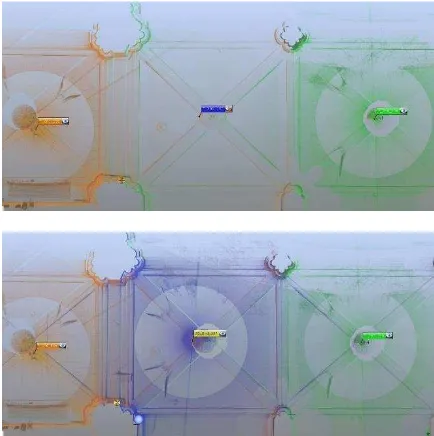
The former House of Commons Reading Room (Figure 5) is a large room measuring 13.5 meters by 20.5 meters by 8 meters, but has a fairly simple configuration with little elements to provide occlusions with the exception of a large ceiling alcove. The wood paneling, masonry walls, pilasters and decorative murals made it a good candidate for photogrammetry. The Rotunda (Figure 6), is approximately the same dimension but is a much more complex space, with a hexagonal footprint, highly decorative masonry walls, a large central column supporting a fan vaulted ceiling and a vaulted ambulatory around its perimeter (Figure 7).
Figure 6: Confederation Hall, also known as the Rotunda shown below with flash setup (HCS, 2017).
Figure 7: Screenshot of scanning data, in top view, with a scan in every second bay of the ambulatory (above) and a scan every bay (below) illustrating the need for increased scans to limit occlusions. This is particularly noticeable in the column detail
(HCS, 2017).
5. OTHER USES OF DATA
Besides the development of the BIM there are several other uses for SFM photogrammetric data and laser scanned point cloud data. Orthographic photos, animations and data dissemination are a few uses that were relevant for the Centre Block documentation project.
5.1 Orthographic Photos
Orthographic images can be extracted from both laser scanning point clouds and photogrammetric models, however the results are a much higher quality with the photogrammetric model. Orthographic images can be stand alone or overlaid with a line drawing. They are useful as a condition assessment tool for conservationists. In this application, they can be used for preliminary assessments or as a clear image to mark up on site. Orthographic images are also a good way to disseminate the information found in a photogrammetric model and are excellent visual and metric posterity records of a space.
5.2 Animations, Virtual Reality and Other Digital Storytelling Applications
Both point clouds and photogrammetric models can be used to create animations, virtual reality experiences and other digital storytelling applications. The photogrammetric models are particular useful in these as they are very realistic looking. Digital storytelling applications are powerful tools to showcase documented data to the general public which is important for a building of this importance. In the case of the Centre Block, several virtual reality experiences have already been created, which aid in explaining the work being done and allow the public to see areas that are not normally accessible. It will also provide the public continued access to the building, virtually, while it is closed for the rehabilitation 2018-2028.
5.3 Dissemination
Disseminating point cloud and photogrammetric data can be a challenge as they often require specialized software to view and manipulate. Some of the applications above, such as orthographic photos and digital storytelling, are useful methods of disseminating the data. Cloud hosted options also exist, but these can pose security concerns.
6. CONCLUSION
REFERENCES
Agisoft LLC, 2016. Agisoft PhotoScan User Manual: Professional Edition, Version 1.2. [accessed 2017 June 17]. http://www.agisoft.com/pdf/photoscan-pro_1_2_en.pdf
Heritage Conservation Program, 1998. Conservation Guidelines for the Interior of the Centre Block, Parliament Hill. Public Services and Procurement Canada.
Government of Canada. Rehabilitating the Centre Block. [modified 2017 May 18; accessed 2017 June 12].
https://www.tpsgc-pwgsc.gc.ca/citeparlementaire-parliamentaryprecinct/rehabilitation/centre-eng.html.
Governement of Canada. History of the Hill. [modified 2017 May 18; accessed 2017 June 26]. http://www.tpsgc-