IN-FLIGHT GEOMETRIC CALIBRATION OF THE
LUNAR RECONNAISSANCE ORBITER CAMERA
E. J. Speyerer a, R. V. Wagner a, M. S. Robinson a, D. C. Humm b, K. Becker c, J. Anderson c, P. Thomas d
a
School of Earth and Space Exploration, Arizona State University, 1100 S. Cady Mall, Tempe, AZ 85287, USA - espeyerer@ser.asu.edu
b
Space Instrument Calibration Consulting, Annapolis, MD, USA c
Astrogeology Research Program, United States Geologic Survey, Flagstaff, AZ, USA d
Center for Radiophysics and Space Research, Cornell University, Ithaca, NY, USA
Commission IV, WG IV/7
KEY WORDS: Calibration, Registration, Geometric, Sensor, Optical, Distortion, Accuracy, Temperature
ABSTRACT:
The Lunar Reconnaissance Orbiter Camera (LROC) consists of two imaging systems that provide synoptic and high resolution imaging of the lunar surface. The Wide Angle Camera (WAC) is a seven color push frame imager with a 90° field of view in monochrome mode and 60° field of view in color mode. From the nominal 50 km polar orbit, the WAC acquires images with a nadir pixel scale of 75 m for each visible band and 384 m for the two ultraviolet bands. The Narrow Angle Camera (NAC) consists of two identical cameras capable of acquiring images with a pixel scale of 0.5 to 1.0 m from a 50 km orbit. Each camera was geometrically calibrated prior to launch at Malin Space Science Systems in San Diego, California. Using thousands of images acquired since launch in June of 2009, improvements to the relative and absolute pointing of the twin NACs were made allowing images on the surface to be projected with an accuracy of 20 meters. Further registration of WAC and NAC images allowed the derivation of a new distortion model and pointing updates for the WAC, thus enabling sub-pixel accuracy in projected WAC images.
1. INTRODUCTION
1.1 LROC
The Lunar Reconnaissance Orbiter (LRO) is a remote sensing precursor designed to facilitate scientific and engineering-driven mapping of the lunar surface for future robotic and human missions [Vondrak et al., 2010]. The spacecraft is equipped with six science instruments and one technology demonstration instrument, each designed to answer key questions about the Moon’s past and present state. The Lunar Reconnaissance Orbiter Camera (LROC), was designed to assess meter and smaller-scale features to facilitate safety analysis for potential landing sites and acquire multi-temporal images of the polar regions to enable mapping of the illumination environment [Robinson et al., 2010; Speyerer and Robinson, 2012]. Additionally, the images from the LROC instrument provide meter-scale mapping of areas of high science and exploration interests, high resolution digital elevation models, and global multispectral views.
The LROC instrument is comprised of three cameras: a pair of Narrow Angle Cameras (NACs) and a Wide Angle Camera (WAC) (Figures 1 and 2). Since launch, over 520,000 NAC images and 235,000 WAC images have been acquired through 15 March 2012. During the early part of the mission, it was difficult to map project images accurately due to large unknowns in the absolute position of the spacecraft (sometimes > 100 m). However, recent precision orbit determination derived from radiometric data and altimetric crossovers improved the known position of the spacecraft to within 20 meters [Mazarico et al., 2011]. With this updated ephemeris, the LROC team is improving the pointing for both the Narrow and Wide Angle Cameras as well as deriving an improved distortion
model for the WAC. This work highlights the LROC team’s efforts and reports the latest results in the calibration process.
1.2 NAC
The two NACs, designated as Left (L) and NAC-Right (NAC-R), each consist of a 5064 pixel charge coupled device (CCD) line-array sensors connected to a telescope with a 700 mm focal length. Each NAC has a field-of-view (FOV) of 2.85° and is mounted off nadir 1.4° in opposite directions, providing a 5.7° combined FOV (~10,000 pixels across track) with ~135 pixels of overlap [Robinson et al., 2010]. The instantaneous FOV for each NAC pixel is 10 µradians, providing 50 cm pixels at an altitude of 50 km, which was common during the first two years of the mission (15 September 2009 to 11 December 2011).
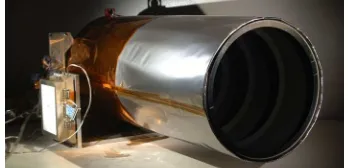
Figure 1. One of the two LROC NACs. The gold blanket covers the telescope and the silver portion is a baffle (27 cm in diam.)
designed to minimize scattered light entering the optics.
1.3 WAC
one of which is designed for the visible bands and the second for the ultraviolet (UV) wavelengths. At the base of the UV optics is a prism that redirects the light to a common CCD mounted under the visible optics. Seven narrow-band interference filters bonded over the detector array enable the acquisition of the color images.
The camera is designed to operate in two modes: monochrome and color. In the monochrome mode (nominally the 643nm band) the WAC acquires framelets that have 1024 samples and 14 lines. In color mode, the WAC acquires framelets for all seven bands, however due to limitations in the readout rate of the CCD array, only the center 704 samples are read out for each 14 line visible band. For the UV framelets, the center 512 samples are read out of the UV portion of the detector array. During the read out, the 512 samples and 16 lines are summed in 4 × 4 pixel boxes resulting in a 128 × 4 pixel framelet, which increases the signal to noise ratio for the UV bands.
Due to this configuration, in monochrome mode the WAC has a ~90° FOV and in color mode a ~60° FOV. The nadir pointing pixels have a pixel scale of 75 meters for the visible bands from an altitude of 50 km, while UV bands have a pixel scale of 384 meters from the same altitude due to the summing. All framelets imaged simultaneously are stored as one frame. The WAC repeatedly acquires frames at a rate such that each of the narrow framelets overlaps providing continuous coverage for each color band. Typical WAC observations contain 36 to 1,800 evenly spaced frames.
Figure 2. LROC WAC before spacecraft integration
2. PRE-LAUNCH CALIBRATION
Prior to launch, the geometric distortion of both camera systems were characterized post-assembly at Malin Space Science Systems (MSSS). Each camera was mounted on an Ultradex rotary stage that provided “azimuthal” control in one degree steps with an accuracy of one arc second. The two NACs imaged a bar pattern, while the WAC, with a second rotary stage to control the elevation, scanned a collimated spot of selectable size over a range of azimuth and elevations. By recording the angles of each observation and registering them to corresponding pixels in the array, a geometric model for each camera was constructed. Each model was defined by a focal length, boresight, and radial distortion coefficients. After calibration, the NAC was securely mounted through the center of the spacecraft’s optical bench using three bolts connected near the focal plane. The WAC was mounted on the front of the optical bench (+Z, Observation side) on a small pedestal to keep the wide FOV clear of all obstructions and to offset the radiator from the optical bench.
3. IN-FLIGHT CALIBRATION
Accurate placement of NAC and WAC images in a cartographic framework requires precise knowledge of the camera orientations relative to the spacecraft coordinates and distortion of the optics. Using a subset of the vast image dataset collected by LROC, improved pointing and distortion parameters were derived. This section describes the methodology and improvements to the geometric calibration.
3.1 NAC Pointing Correction
Due to the twin camera configuration of the LROC NAC, there are three components to the geometric calibration:
1. Absolute twist offset: A rotation about each camera's boresight, determined relative to the spacecraft frame. 2. Absolute offset: The offset of a given map-projected
pixel from its true coordinates. This is a rotation about the two axes perpendicular to the camera's boresight (cross-track and down-track).
3. Relative offset: The temperature-dependent component of the offset between the left (NAC-L) and right (NAC-R) cameras. Like the absolute offset, this is a rotation about the axes perpendicular to the camera's boresight.
The products of these components were combined to provide a precise (seamless NAC-L to NAC-R registration) and accurate (within ~20 m to surface coordinates) camera model for projecting the immense NAC dataset available to the science and engineering community.
3.1.1 Absolute Twist Correction: The two NAC cameras are nominally mounted such that the sensors are parallel to each other and perpendicular to the flight direction. Comparison of several images of Apollo sites revealed that NAC-L and NAC-R images, once projected, were rotated relative to each other 0.36° to 0.40° (Figure 3). As an independent check, twist values were derived relative to projected Descent Stage of the Apollo Lunar Module (LM) and retroreflector locations (in the same image) at the Apollo sites: the twist offset was 0.37°.
The absolute value of each camera rotation relative to the spacecraft reference frame was determined by creating a control network from over 3,800 polar NAC images [Lee et al., 2012]. The orientation of these images varied, making it possible to derive a twist adjustment. The average derived absolute rotational offsets were -0.24° for the NAC-L and +0.13° for the NAC-R, for a relative rotation of 0.37°.
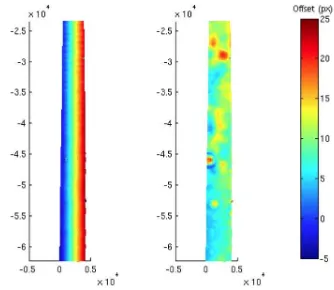
Figure 3. Down-track (left) and cross-track (right) offsets between a NAC-L and NAC-R with roughly the same footprint,
3.1.2 Absolute Pointing Correction: Unlike previous instruments on other planetary missions, the accuracy of the NAC pointing can be directly measured using the position of known locations on the target body. The absolute error of the NAC camera pointing was determined by deriving coordinates for the five retroreflectors on the Moon (three flown on Apollo missions, two flown on Soviet Lunokhod rovers), the true locations of which are known to sub-meter accuracy (Figure 4) [Murphy et al., 2010].
Figure 4. Distribution of the calculated retroreflectors locations before (red) and after (blue) the absolute point correction,
compared to the actual retroreflector location (yellow)
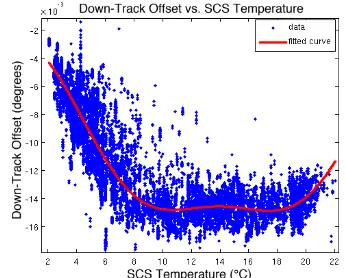
The five retroreflectors were located in 62 NAC frames, and the true instrument pointing was derived for each of those frames. These pointing values were then compared to numerous environmental factors. A strong correlation was found between spacecraft slew angle and absolute offset in the cross-track direction, with the caveat that the slew angle had a sign that indicates whether the camera was pointing to the east or west, regardless of spacecraft flight direction. Additionally, we found the absolute pointing error to correlate with the temperature of the LROC Sequence and Compressor System (SCS), which is mounted on the backside of the optical bench and not covered by the thermal blankets. The pointing error is smallest at higher SCS temperatures and more pronounced at lower SCS temperatures. We are currently investigating the thermal environment of key components of the spacecraft during the 62 observations.
3.1.3 Relative Offset Between NAC-L to NAC-R: The NAC-L and NAC-R were affixed to the spacecraft such that the cameras have a ~135 pixel overlap in the cross-track direction and an offset of ~185 pixels in the down-track direction [Robinson et al., 2010]. Early in the mission, it was recognized that the offset between the two cameras was not fixed (Figure 5). After analysing several thousand NAC pairs under all possible conditions it was determined that the amount of overlap varies in both directions (cross-track and down-track) with a strong correlation to the temperature of the spacecraft.
Figure 5. The boundary (yellow arrows) between the left and right frames of a mosaicked NAC pair before (left) and after
(right) the relative correction.
A plausible mechanism for the time-varying relative offset is differential expansion of the mounting brackets or the spacecraft structure, as the spacecraft thermal environment changes. Thermistors mounted on the camera system and spacecraft were checked, and all available temperatures were strongly correlated to the relative offset between the NAC-L and NAC-R. SCS temperature was chosen as the correction parameter since it is included in the PDS header of each NAC image and is common to both cameras.
In order for the NAC-L and NAC-R co-registration function (described in detail in Section 3.2.1) to work reliably, the input images were restricted to solar incidence angles <70° (avoiding large shadowed areas) (Figure 6 and 7). This restriction unfortunately results in very little data for SCS temperatures less than 2°C, and the data below 2° show no correlation between relative offset and temperature. In the current implementation, any image taken with an SCS temperature below 2°C was treated as though it had a temperature of 2°C, but it currently does not produce good results. Efforts are currently underway to make the correction better in this temperature range.
Figure 6. Best-fit curves for the down-track offset between the NAC-L to NAC-R. Blue dots are individual co-registration points within an image. Red line is the best-fit curve (2nd order
Figure 7. Best-fit curves for the cross-track offset between the NAC-L to NAC-R. Red line is a best-fit curve (2nd order Fourier
series). Y-axis units are 10-5 degrees.
The relative offset correction was applied using a second order Fourier series with the following general form:
f(x)=a0+a1cos(xw)+b1sin(xw)
+a2cos(2xw)+b2sin(2xw)
(1)
where a0, a1, a2, b1, b2, w = derived constants
3.2 WAC Distortion Model and Pointing Correction
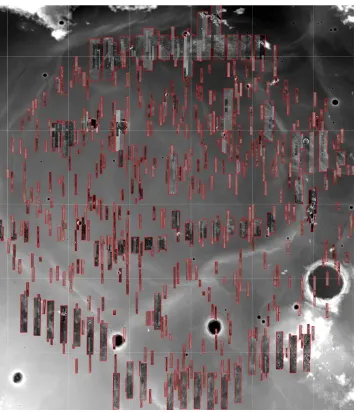
Unlike the NAC, which can be directly tied to human artefacts on the lunar surface, the WAC in-flight geometric calibration was based on registration with map projected NAC images that have been processed with the latest calibration updates (see section 3.1). To limit topographic variation images were selected over the relatively flat Mare Imbrium region (Figure 8). In all, 729 WAC images (96 monochrome, 633 color) were co-registered to 1,212 NAC observations, thus collecting over 6.5 million data points for deriving improved pointing and camera distortion models.
Figure 8. Distribution of NAC images used for “ground truth” in calibrating the WAC instrument. The NAC observations are overlaid on the WAC derived topographic model, GLD100
[Scholten et al., 2012].
3.2.1 Image Registration: To provide a “ground truth,” NAC observation acquired over the Mare Imbrium region were map projected at 25 meters per pixel. WAC images, acquired under similar lighting conditions that overlapped these NAC images were oversampled and projected at the same pixel scale. Both images were map projected using the highest resolution digital terrain model, GLD100 [Scholten et al., 2012], and the latest ephemeris derived from radiometric data and altimetric crossovers [Mazarico et al., 2011].
Using a pattern-matching algorithm found in Integrated Software for Imagers and Spectrometers (ISIS) package compiled by the Astrogeology Research Group of the United States Geologic Survey (USGS) [Anderson et al., 2002] WAC images were registered to the NAC images (“Truth”) covering the same geographical region. Specifically, a region or pattern chip (in this case a 20 sample by 20 line region) was extracted from the map projected WAC image. The pattern chip was used to identify a matching region in the search chip. The search chip was a larger area found in the NAC image (in this case a 80 sample by 80 line region). The pattern chip was scanned across and compared to sub regions of the search chip. A goodness of fit (GOF) was calculated for each point in the search chip by computing:
GOF= cov(pattern,subregion)
var(pattern)×var(subregion) (2)
where cov = covariance function var = variance function pattern = n x m pattern chip
subregion =n x m sub-region of the search region
Upon walking the pattern chip through the search chip and calculating the corresponding goodness value for each point, the pixel with the highest correlation value represents the position in the search chip that best matches the pattern chip. This result, however, was only good to one pixel accuracy. In most cases, the point may lie between a set of pixels. To match at the sub-pixel level, a surface model was generated over the matrix of GOF values. The maximum point of this surface estimates the true registration position of the pattern chip in the search chip. This process was repeated at multiple locations over each map-projected pair. Due to the large number of points (> 6.5 M), any mis-registration has very little impact on the distortion modelling as a whole.
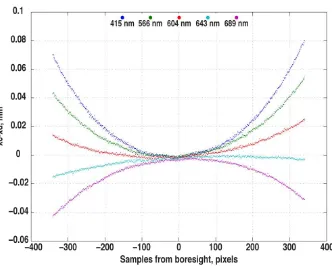
Figure 9. Difference between the corrected (xc) and distorted (xd) pixel location in the down track direction derived from
WAC to NAC co-registration. Notice that this method also identified a slight twist in the mounting of the WAC (~0.094°).
3.2.2 Derivation of an Improved Camera Model: The WAC camera model is composed of several interdependent elements that impact the accuracy of the map projection (Table 1). In order to successfully derive a new camera model, each parameter must be solved for simultaneously. A custom MATLAB function was composed that calculated a root mean squared (RMS) error of the difference between the corrected pixel location defined by the NAC image and the corrected pixel location calculated from the distorted pixel location in the WAC image for a camera model with a given set of parameters. An optimization function was then used to identify the set of camera model parameters that minimized the overall RMS.
Camera Element Parameters
Table 1. Camera model elements and corresponding parameters.
3.2.3 Distortion Modeling: To account for the pincushion distortion present in the WAC optics, a radial distortion model was empirically derived before launch. In this distortion model, the radial distance each pixel is away from the optical axis, r,
where xc, yc = coordinates of undistorted, or corrected, pixel xd, yd = coordinates of distorted pixel
k1, k2 = radial distortion coefficients
r = distance the distorted pixel is from the optical axis
After the launch of LRO, small band to band offsets (< 2 pixels) in map projected WAC color images were observed. In addition, the accuracy of the pre-flight distortion model near the edge of the CCD had residual displacements of 1 to 3 pixels in some bands, which was most likely due to the twist in
orientation between the CCD and the flight direction (Figure 9). This latter displacement was noticeable in monochrome images, which span the entire 1024 pixel CCD array. To correct for
p1, p2 = decentring distortion coefficients s1, s2 = tilting distortion coefficients
4. CURRENT RESULTS AND FUTURE WORK
4.1 NAC Calibration Results
Prior to implementing the camera pointing corrections outlined in section 3.1, absolute NAC pointing was good to within ±833 µradians cross-track and ±612 µradians down-track (42 m and 31 m, respectively, from a 50 km altitude), while the relative offset between NAC-L and NAC-R images acquired simultaneously has 70-280 µradians (7-28 pixels). After applying the pointing corrections, the absolute pointing error was ±639 µradians cross-track and ±635 µradians down-track (33 m and 32 m from a 50km altitude). The relative offset between the two cameras was reduced to ±5 µradians (0.5 pixels or 25 cm from the 50 km orbit) thus providing a seamless boundary between the two simultaneously acquired NACs.
Using the new camera pointing solution, the locations of surface hardware from the Apollo and Soviet landers were calculated (Table 2 and 3). In Table 3, the locations of the LM and the central station of the Apollo Lunar Surface Experiments Package (ALSEP) were identified. The Delta True column contains data for these three sites that have a Laser Ranging Retroreflector (LRRR). In these cases, the “true” LM and ALSEP positions were determined by calculating the exact camera pointing required to place the LRRR in the correct location. Using that vector, the coordinates of the other objects were derived. The variation of these “true” coordinates between images was ±1.5m.
Calculated Location Standard Deviation, m
Delta True, m Object Lat Lon Lat Lon Lat Lon A11 LM 0.67431 23.47318 12.8 15.6 4.8 1.4 A12 LM -3.01269 336.57805 11.8 17.0
A14 LM -3.64595 342.52822 11.5 14.4 -1.4 5.1 A15 LM 26.13236 3.63335 13.0 16.3 -0.4 1.5 A16 LM -8.97341 15.50106 12.6 9.3
A17 LM 20.19113 30.77221 15.3 14.0
A11 PSE 0.67333 23.47318 11.8 16.1 3.6 1.2 A12
ALSEP -3.00960 336.57514 9.9 11.5 A14
ALSEP -3.64426 342.52248 12.4 14.2 -1.9 4.9 A15
ALSEP 26.13407 3.63006 12.9 17.9 0.3 4.8 A16
ALSEP -8.97589 15.49850 12.4 11.2 A17
ALSEP 20.19234 30.76521 15.4 18.4
Table 3. Location of Apollo surface hardware derived from NAC images using the improved pointing correction
4.2 WAC Calibration Results
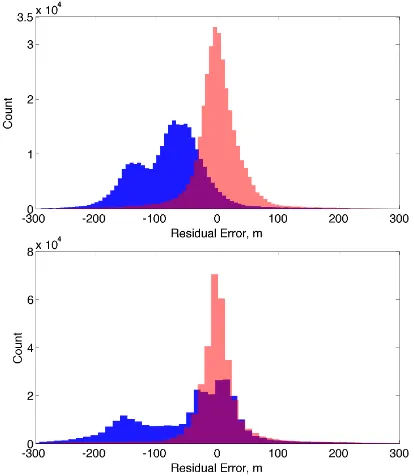
Using the data from the in-flight WAC calibration outlined in Section 3.2.1, a new pointing and distortion model was empirically derived. This new model removes the twist previously seen in the image data (Figure 9) and eliminates residual errors still present after the pre-flight calibration. The resulting model projects each pixel of the frame with sub-pixel accuracy (Figure 10).
Figure 10. Residual errors in the down track (top) and cross track (bottom) direction before (blue) and after (red) applying
the updated camera pointing and improved distortion model.
4.3 Release of In-Flight Calibration Results
The product of the calibration efforts highlighted here will be included in a set of updated SPICE kernels delivered to Navigation and Ancillary Information Facility (NAIF) and the USGS [Acton, 1996]. There will be updates to the pointing information found in the Frames Kernel (FK), new temperature dependent C-matrix Kernels (CK) for NAC pointing correction, and a new camera model and distortion model defined in the LROC Instrument Kernel (IK). These products will be released during the summer of 2012.
5. REFERENCES
Acton, C.H., 1996. Ancillary Data Services of NASA's Navigation and Ancillary Information Facility, Planetary and Space Science, 44(1), pp. 65-70.
Anderson, J.A., Sides, S.C., Soltesz, D.L., Sucharski, T.L, and Becker, K.J., 2004. Modernization of the Integrated Software for Imagers and Spectrometers. Lunar and Planetary Science Conference XXXV, #2039.
Brown, D.C., 1966. Decentering Distortion of Lenses, Photogrammetric Engineering, 32 (3), pp. 444-462.
Brown, D.C., 1971. Close-Range Camera Calibration. Photogrammetric Engineering, 37(8), pp. 855-866.
Lee, E.M. et al., 2012. Controlled Polar Mosaics of the Moon for LMMP by USGS. Lunar and Planetary Science Conference XLIII, #2507.
Mazarico, E., Rowlands, D.D., Neumann, G.A., Smith, D.E., Torrence, M.H., Lemoine, F.G., Zuber, M.T., 2012. Orbit Determination of the Lunar Reconnaissance Orbiter, Journal of Geodesy, 86(3), 193-207.
Murphy, T.W., et al., 2010. Laser Ranging to the Lost Lunokhod~1 Reflector, Icarus, 211(2), pp. 1103-1108.
Robinson, M.S. et al, 2010. Lunar Reconnaissance Orbiter Camera (LROC) Instrument Overview, Space Science Reviews, 150(1-4), pp. 81-124.
Scholten, F., et al., 2012, GLD100: The Near-Global Lunar 100 m Raster DTM from LROC WAC Stereo Image Data, Journal of Geophysical Research, in press.
Speyerer, E.J., Robinson, M.S., 2012. Persistently Illuminated Regions at the Lunar Poles: Ideal Sites for Future Exploration, Icarus, in revision.
Vondrak, R., Keller, J., Chin, G., Garvin, J., 2010. Lunar Reconnaissance Orbiter (LRO): Observations for Lunar Exploration and Science, Space Science Reviews, 150(1-4), pp. 7-22.
6. ACKNOWLEDGEMENTS