Email: [email protected]
J.Food Pharm.Sci. 3 (201 5) 23-26
Research Article
Development and validation of atomic absorption spectrometry for the
determination of zink and mercury analyzer for determination of Mercury
in cream cosmetics
Abdul Rohman
1,2,3*and Erni Wijayanti
1Integrated Research and Testing Laboratory, Gadjah Mada University, Yogyakarta, 55281, Indonesia 2Faculty of Pharmacy, Gadjah Mada University, Yogyakarta 55281, Indone sia
3
Research Center of Halal Product s, Gadjah Mada University, Yogyakarta 55281, Indonesia.
ARTICLE INFO ABSTRACT
Received 10/03/2015 Received in revised form 25/03/2015
Accepted 25/04/2015 Available online 01/5/2015
An atomic absor ption spectrometry for the quantification of zink (Zn) and mercury analyzer for the quantification of mercury (Hg) levels in cream cosmetic were developed and validated. The method was validated for linearity and range, precision, accuracy, limit of detection (LOD) and limit of quantification (LOQ). The standard curve s were linear over the concentration of 0.1-1.2 µg/mL (Zn) and 0.05-2.0 µg/L (Hg) with coefficient of correlation (r) > 0.99. The detection limits obtained were 2.8614 µg/g sample (Zn) and 0.4749 ng/g sam ple. The quantification limit obtaine d were 9.5281 µg/g sample (Zn) and 1.5827 ng/g sample . The relative standar de viation (RSD) values found to be 8.67 % for its intraday precision and 9.89 % for it s interday precision (Zn) and 12.69 % for it s intraday precision and 7.17 % for its interday precision (Hg). The se RSD value s are lower than those required by RSD Horwitz unction. The mean recovery percentage was 94.28 % (for Zn) and 78.65% ( for Hg). The se develope d methods were succe sfully used for determination of Zn and Hg in cream cosmetics products.
Key words: mercury, zink, at omic absorption spectroscopy, mercury
analyzer, cream cosmetic
1. Introduction
Cream is one of the cosmetic products. They are used throughout skin protection, skin therapy, and cosm aceutical (Epstein, 2009). Cream is de fined as thickly liquid or half solid emulsion, w hich is oil in water or water in oil emulsion type. Cream contains oil, water, and absorbtion phase. Other components of cream are emolient (5-25 %), trigliseride (0-5 %), mineral oil (5-70 %), silicon oil (0,1-15 %), humectan (0,5-15 %), and preservative. The most commonly cream formulated was oil in water type (Ansel, 1989) . Cream can contain heavy metals for specific purposes. Interaction of cream compone nts to heavy metal cause physical or chemical change of cream such as texture, smell, and cream stability (Budiman, 2008).
Heavy metals cause a long-term risk on environment al and hum an he alth. They can accumulate to toxic levels. The cosmetic application on skin cause heavy metals t o expose consumers to toxic levels of potentially hazardous chemicals (Blanc et al., 1999). Heavy metal such as zink (Zn) can penetrate to human body through inhalation and absor btion on the skin (Plum et al., 2010). Zn usually formulated as physical sunscreen on cream cosmetic. Zn toxicity may be manifested by a variety of syndr omes and effects are including vomitting, convultion, and diarhea (Manahan, 1994 ; Darm ono, 1995). Zink in cosmetics can penetrate through the skin space. The absorbtion of Zn is influence d by skin pH,
zink consentration, and the the of comsumen’s skin. In
Abdul Rohman and Erni Wijayanti/ J.Food Pharm.Sci (2015), 23-26 24 Mercury (Hg) is one of the most reported heavy metals
found in cream cosmetics and can be found as organic compund such as methyl mercury or anorganic compund such mercury chloryde (HgCl2) (Darm ono, 1992). Hg in cream cosmetic is usually use d to brighten the skin colour by melanin syntesis inhibition (Giunta et al., 1983). Hg can be bound to the side active of tyrosinase on melanin synthe sis so the production of this human pigmen will be inhibited (Junquiera et al., 2002). Hg will accumulate and cause dege nerative disease in human helath. Beside s, Hg will be acumulated on tubular kidney (Barr et al., 1973; Berlin, 1979; Bourgeois et al., 1986; Marzulli and Brown, 1972). Hg in cosmetics could penetrate through the skin space. Atomic absorption spectrophotometry (AAS) using flame and nonflame atomization is the method of choice for determination he avy metals contained in cosmetics products (Vogel, 2001). Some specific instruments are designe d for specific purposes. Recently, mercury analyzer technique is the method of choice for mercury determination contained in cosmetics. Its determination pinciple that is free state atom of mercury can be found at room temperature (Beaty and Kerber, 1993). Method validation is an important aspect in quantitative analysis. According to ISO/IEC 17025 (2005) , method validation intends to guarantee that the method meets the acceptable criteria. The purpose of this paper is to validate AAS for the determination of zink nd mercury analyzer for analysis of Hg in cream cosmetics distributed in cosmetic shop in Yogyakarta.
2. Materials and Methods
2.1 Materials
Cream cosmetics were obtained from cosmetic shop in Yogyakarta. Zink and mercury standard solutions were supplied by Merck (Darmstadt , Germany). The other reagents were supplied by Merck (Darmstadt, Germany). All reagents were analytical grade. The water use d as solvent was destilled and deionized. All glassware used were cleaned by soaking in detergent solution, then rinsing with disitilled water.
2.2 Digestion procedure
An appr oximately of 1 gram of cream cosmetic weighed into 250 m L Erlenmeyer flask and added with 5 mL of nitric acid and 5 ml of perchloric acid. The mixture was then he ated at a temperature between 100-150 °C until the solution was clear. The sample solution was then cooled and diluted t o 50 m L with distilled water.
2.3 Determination of zink
Instrumen atomic absorption spectroscopy Analytik Jena® ContrAA30 (Analytik Jena AG, Germany) was operated with flame C2H2 in water. Output pressure
acethylene was oper ated on 80-100 kPa, the air was operated on 300-600 kPa. The velocity of air to flame was operated on 50 L/hour for Cd. Burner type was use d is burner with wide 100 mm and the high was operated in 6 mm. -10 m L of sam ple solution is poured in flask and
then measured the absorbance in wavelength 213,857 nm for Zn.
2.4 Determination of mercury
Determination of Hg in cream cosmetics was performed using mercury analyzer as used by Noviana et al. (2012). Instrument of mercury analyzer Lab Analyzer-254 (gMB H, Karsfield, Germany) was operated with argon or nitrogen pump. Light source is
Method validation was performed by assessing several analytical figures of merit according to International Conference on Harm onization (ICH, 1994), namely line arity and range , precision, limit of detection (LOD) and limit of quantification ( LOQ), and accuracy.
3. Results and Discussions
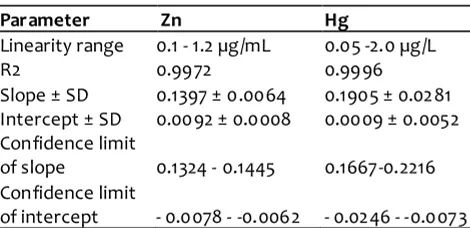
Several par ameters have been taken into account and evaluated for the validation of the analytical methods for quantitative determination of heavy metals in cream cosmetis, namely, range and linearity, the minimum detection limit, the minimum limit of quantification, accuracy, and precision. Linearity study was dem onstrated by analyzing six different concentrations of zink and Hg. Accur ately measured standard wor king solutions of zink 0.1, 0.2, 0.5, 0.6, 0.8, 1.0, and 1.2 µg/mL and mercury of 0.05, 0.1, 0.25, 0.75, 1.0, 1.5, and 2.0 µg/L were prepared . The corresponding linear regression equation obtained has correlation coefficient of 0.9972 (Zn) and 0.9996 ( Hg). According t o Eurachem (1998), the analytical was linier over certain concentration r anges if R2 obtaine d is higher than 0.995. The linearity parameter and range for Zn and Hg is compiled in Table 1.
Abdul Rohman and Erni Wijayanti/ J.Food Pharm.Sci (2015), 23-26 25
precision and accur acy (Gonzales and Herrador, 2007; IUPAC, 1998). In order to determine LOD and LOQ, ten blank samples were measured. LOD and LOQ were calculated as 3.3 SD/band and10 SD/band, respectively, where SD is the standard deviation of analytical responses and b is the slope of calibration curve. LOD and LOQ were found to be 2.8614 µg/g sam ple and 9.5281 µg/g sam ple respectively (for Zn usng AAS -flame) and to be 2.8614 µg/kg sam ple and 1.5827 µg/kg sample, respectively ( Hg using mercury analyzer).
Precision is usually measured as relative standard deviation (RS D) of a set of data (concentration in this study). Precision of the zink and Hg was checked in order to show if instrument response to Zn standard solution was always repr oducible (the same over different parameters). This par ameter takes int o account only the error coming from the oper ating system and not the error attributable to sam ple handling and prepar ation (Ertasa and Tezel, 2004). In order to assess the analytical method precision, measurements were done under conditions of repeatability and intermediate precision. Repe atibility of the method was evaluated from the analysis 10 blank sample solutions fortified with 0.2 µg/mL zink standard and 1.0 µg/L mercury standard, under the similar conditions (day, analyst, instrument, sam ple). The RSD value s obt ained were 8.67% (Zn) and 12.69% (Hg). Furthermore, the intermediate precision was evaluated
by per forming 10 measurement with three different days. The RSD value s obtaine d during the intermediate precision was 9.89% (Zn) and 7.17% (Hg). The results of precision studie s were com piled in T able 2. According t o RSD Horwitch function (Gonzale s and Herrador, 2007), the maximum RSD values accept able for the level analyte of 1 µg/m L is 16 %. Therefore, it can be st ated that the develope d method exhibited a good precision. The accuracy of the analytical method was determined by calculating recoveries of zink and Hg. To ensure the accuracy of the analytical method, the recovery studie s were carried out by adding a known quantity of analyte with preanalyzed by the pr oposed method. To check the accuracy of analytical method, the recovery studie s were performed in order to confirm the losses of Zn and Hg or contamination during sam ple prepar ation as well as matrix interferences during the measurement step (Ertasa and Tezel, 2004). According to ICH (1994) for the determination of the recovery, the spiking technique was used, i.e the known concentration of Zn and Hg solution were added to cream cosmetics, and the resulting spiked sample s were me asured, calculated, adn compared to the known value of Zn and Hg solution added. All analytical steps were performed in three replicates with three different levels of Zn concentration. The recovery value s for accuracy studie s of cream cosmetic sample s spiked with different level of Zn and Hg were shown in Table 3. For the analyte level Table 2. Precision studies data for determination of Zn and Hg.
Analyte Day Introduced analyte concentration
(µg/mL)
Calculated analyte concentration (µg/L)
RSD (%)
Intraday Interday
Zn (Zink) 1 0.20 0.22 ± 0.02 10.78
9.89
2 0.20 0.19 ± 0.02 8.67
3 0.20 0.22 ± 0.02 10.22
Hg (Mercury) 1 1.00 1.04 ± 0.13 12.69
7.17
2 1.00 1.34 ± 0.05 3.79
3 1.00 1.27 ± 0.06 5.03
Table 3. Accuracy studie s dat a for analysis of Zink and Mercury
Analyte Introduced analyte concentration
(µg/mL)
Calculated analyte concentration (µg/L)
Recovery percentage (%)
Zn
0.20 0.20 101.31
0.40 0.39 95.26
0.60 0.52 84.23
Hg
0.50 0.33 64.15
1.00 0.87 84.11
1.50 1.33 87.70
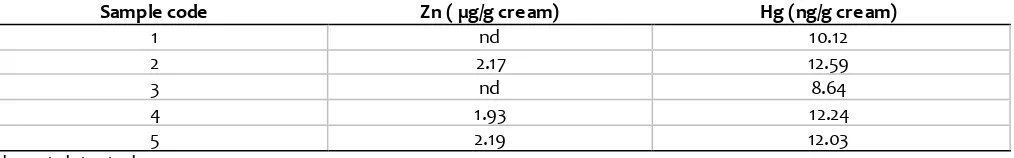
Table 4. The results of Zn and Hg in cream cosmetics obtaine d from Yogyakarta.
Sample code Zn ( µg/g cre am) Hg (ng/g cre am)
1 nd 10.12
2 2.17 12.59
3 nd 8.64
4 1.93 12.24
5 2.19 12.03
Abdul Rohman and Erni Wijayanti/ J.Food Pharm.Sci (2015), 23-26 26 of approximately 1 µg/m L, a recovery range of 80-110 %
was acceptable (Taveniers et al., 2004). Therefore, the develope d method was accurate for quantification of zink and Hg in cream cosmetics.
The developed method was further use d for determination of Zn and Hg in some cream products. The levels of Zn and Hg as determined by AAS -flame and mercury analyzer were compiled in Table 4. Food and Drug Administration, Republic of Indone sia stipulated that the maximum level of Hg in cosmetics cream is 1 ppm. From Table 4, it is known that Hg le vel is lower than that required by regulatory agency.
4. Conclusion
The atomic absorption spectroscopy using flame atomization and mercury analyzer were succesufully used for quantitative analysis of Zn and Hg in cream cosmetics, respectively. The developed methods meet the acceptance criteria of validation parameters according to Internal Conference on Harm onization (ICH). Farmasi (Introduction to pharmaceutical dosag e form), translated by I brahim, F.,UI Pre ss, Jakarta.
2. Barr, R. D., B. M. Woodger, and P. H. Rees, 1973. Levels of mercury in urine correlated with the use of skin lightening cream s. Am. J. Clin. Pathol., 59: 36-40.
3. Beaty, R.D., and J.D. Kerber, 1993. Concept, Instrumentation and T echniques in Atomic
Absorption Spectrophotometry, Perkin Elmer,
Inc., USA. Fever. Ann. Intern. Med. 114: 930-936.
6. Bourgeosis, M., A. Doom s-Goossens, D. Knockaert, D. Sprenger, M. Vsan B oven, and T . Van tittelboom, 1986. Mercury intoxication after topical application of a met allic mercury ointment. Dermatologica 172 : 48-51.
7. Budiman, M.H., 2008. Uji Stablitas Fisik dan Aktivitas Antioksidan Sediaan Krim yang Mengandung Serbuk Ekstrak Tomat (Solanum
lycopersicum L.) (Physical study evaluation and antioxidant activity of cream containing tomat o extract), Skripsi, Universitas Indone sia, Depok. 8. Darmono, 1995. Logam dalam Sistem Biologi 10. Ertasa, O.S and H. Tezel, 2005. A validated cold
vapour-AAS method for determining cadmium in human red blood cells. J. Pharm . Biomed. Anal., 36: 893–897.
11. Eurachem, 1998. The fitne ss for purpose of analytical method: A labor atory guide to method validation and related topics, acce sse d from: http://www.eurachem.org/guides/pdf., 18/ 04/2011.
12. Giunta, F., D. Dilandr o, and M. Chiarmda, 1983. Severe acute poisoning from the Ingestion of a permanent Wave solution of mercuric chloride . Human Toxicol., 2: 243-246.
13. Gonzalez, A.G. and M.A. Herrador, 2007. A Practical guide to analytical method validation, including me asurement uncertainty and accuracy profile s. Trends Anal. Chem., 26: 227-238.
14. International Conference on Harmonisation (ICH), 1994. Validation of Analytical Procedures:
Text and Methodology, accessedfrom:http://
www.ich.org/fileadmin/Public_W eb_Site/ICH_Pro ducts/Guidelines/Quality/Q2_R1/Step4/Q2_R1_Gui deline.pdf., 19 /04/2011.
15. ISO/IEC 17025. 2005. General requirements for the competence of testing and calibration laboratories.
16. Khopkar, S .M., 1990. Basic Concept of Analytical Chemistry, UI Press, Jakarta. Health. J. Environ. Re s., 7: 1342-1365.
20. Taverniers, I., M. De Loose, and E. Van Bockst aele, 2004. Trends in quality in the analytical laboratory: Analytical method validation and quality assur ance. Trends Anal . Chem., 23: 535 – 552.