Genetic Algorithm for Solving Location Problem in a Supply Chain
Network with Inbound and Outbound Product Flows
Suprayogi1*, Senator Nur Bahagia1, Yudi Thaddeus1
Abstract: This paper considers a location problem in a supply chain network. The problem addressed in this paper is motivated by an initiative to develop an efficient supply chain network for supporting the agricultural activities. The supply chain network consists of regions, warehouses, distribution centers, plants, and markets. The products include a set of inbound products and a set of outbound products. In this paper, definitions of the inbound and outbound
products are seen from the region’s point of view. The inbound product is the product demanded by regions and produced by plants which flows on a sequence of the following entities: plants, distribution centers, warehouses, and regions. The outbound product is the product demanded by markets and produced by regions and it flows on a sequence of the following entities: regions, warehouses, and markets. The problem deals with determining locations of the warehouses and the distribution centers to be opened and shipment quantities associated with all links on the network that minimizes the total cost. The problem can be considered as a strategic supply chain network problem. A solution approach based on genetic algorithm (GA) is proposed. The proposed GA is examined using hypothetical instances and its results are compared to the solution obtained by solving the mixed integer linear programming (MILP) model. The comparison shows that there is a small gap (0.23%, on average) between the proposed GA and MILP model in terms of the total cost. The proposed GA consistently provides solutions with least total cost. In terms of total cost, based on the experiment, it is demonstrated that coefficients of variation are closed to 0.
Keywords: Location problem, supply chain network, mixed integer linear programming model, genetic algorithm.
Introduction
This paper considers a location problem in a supply chain network. The problem addressed in this paper has been discussed by Suprayogi et al. [1] where it is motivated by an initiative to develop an efficient sup-ply chain network for supporting the agricultural ac-tivities. The supply chain network can help farmers to get agricultural activity supporting products (e.g. fertilizers, pesticides, and seeds) at lower cost and better supply. The supply chain network also can support farmers for distributing their agricultural products (e.g. rice) to markets. The supply chain network is designed to establish distribution centers and warehouses that can act as intermediaries. The supply chain network consists of regions, ware-houses, distribution centers, plants, and markets. The products include a set of inbound products and a set of outbound products. In this paper, definitions of the inbound and outbound products are seen from
the region’s point of view.
1 Faculty of Technology, Industrial Engineering Department,
Institut Teknologi Bandung, Jl. Ganesha 10, Bandung 40132, Indonesia. Email: [email protected], [email protected], [email protected].
* Corresponding author
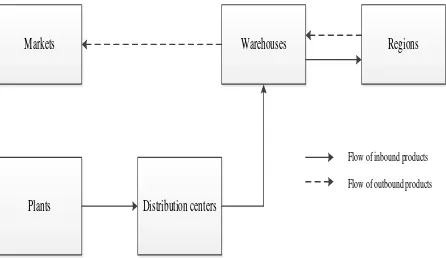
The inbound product is the product demanded by regions and produced by plants which flows on a sequence of the following entities: plants, distri-bution centers, warehouses, and regions. The out-bound product is the product demanded by markets and produced by regions and it flows on a sequence of the following entities: regions, warehouses, and markets. The supply chain network considered in this paper is illustrated in Figure 1.
The problem deals with determining locations of the warehouses and the distribution centers to be opened and shipment quantities associated with all links on the network that minimizes the total cost.
Figure 1. Illustration of the supply chain network Plants Distribution centers
Warehouses Regions Markets
A mixed integer linear programing (MILP) model to represent the problem has been proposed by Suprayogi et al. [1]. They gave an illustrative example and solution of the problem.
The problem can be considered as a strategic supply chain network problem. Min and Zhou [2] has pro-vided a review and taxonomies in supply chain modeling. In addition, the problem addressed in this paper integrates the facility location decisions with other relevant decisions in a supply chain network. Melo et al. [3] have pointed out the important roles of facility decision problems in the strategic supply chain network. They gave a literature review of facility location models in the context of supply chain management. According to the supply chain structu-re mentioned by Melo et al. [3], this problem has the following features: multiple location layers, multiple commodities, single period, and deterministic.
The supply chain network discussed in this paper involves simultaneously forward and reverse flows. In literature, this typical supply chain network can be called as the supply chain network with bidi-rectional flows as mentioned in De Rosa et al. [4] and Zhang et al. [5].
The facility location problem is one of hard com-binatorial optimization problems. Solving the MILP model can be applied only for small problems. In this paper, a solution approach based on genetic algo-rithm (GA) is proposed. GA is one of metaheuristic approaches where it is inspired from the natural selection process. The proposed GA in this paper is adapted from Costa et al. [6] where they proposed a new encoding/decoding procedure for designing a single product three-stage supply chain network. Using this procedure, infeasible distribution flows can be avoided in the decoding process.
Methods
Problem Definition
The problem definition is taken from Suprayogi et al. [1]. There are five entities in the supply chain net-work, i.e.: plants, distribution centers, warehouses, regions, and market. There are a set of inbound products produced by plants. The supply capacities of inbound products are known. There are a set of regions where each region requires the inbound products. The inbounds product is sent from plant to regions through distribution centers and ware-houses. There is a set of outbound products demand-ed by markets and producdemand-ed by regions. The out-bound products are delivered to markets through warehouses.
There is a set of location candidates of warehouses and a set of location candidates of distribution cen-ters. The problem deals with determining locations of warehouses and distribution centers to be opened and shipment quantities to minimize the total cost. The total cost consists of costs for opening ware-houses and distribution centers and costs of transporting both inbound and outbound products.
Characteristics of the supply chain network to be designed must meet the following policies: (a) A dis-tribution center can receive an inbound product from one plant or more. (b) A warehouse must receive all inbound products from a particular distribution center. (c) A region must receive all inbound pro-ducts from a particular warehouse. (d) All outbound products from a region must be delivered to a ware-house. (e) The warehouse delivering inbound pro-ducts to a region and receiving outbound propro-ducts of a region is same. (f) Each market can receive out-bound products from several warehouses.
Mixed Integer Linear Programing Model
Notations used in the MILP model are as follows: Sets:
fixed cost of establishing warehouse
inbound capacity of distribution center
inbound capacity of warehouse
unit transportation cost of inbound
from plant to distribution center
shipment quantity of inbound product
from distribution center to warehouse
shipment quantity of inbound product
from warehouse to region
shipment quantity of outbound product
from region to warehouse
shipment quantity of outbound product
from warehouse to market
binary variable representing the decision for opening distribution center ( if distribution center is opened, if otherwise)`
binary variable representing the decision for opening warehouse ( if ware-house is opened, if otherwise)
binary variable representing the decision
for shipping products between region and warehouse ( if products are shipped between region and warehouse,
if otherwise)
binary variable representing the decision
for shipping products between distribu-tion center and warehouse ( if products are shipped distribution center
and warehouse , if other-wise)
Performance measure:
total cost
According to Suprayogi et al. [1], the problem is for-mulated into a MILP model as follows:
Minimize
The objective function to be minimized is formulated in Equation (1). This equation represents the total cost including costs for opening distribution centers and warehouses and costs of transporting products. Constraints (2) and (3) ensure that product flows occur if entities (warehouses and distribution) are opened. Constraints (4) ensure that a region must be linked by a warehouse. Constraints (5) guarantee that a warehouse is linked by a distribution center. Constraints (6)-(8) are linking constraints. Capacity constraints of all entities are formulated in Con-straints (9)-(13). ConCon-straints (14)-(18) act as flow conservation constraints. Constraints (19)-(27) repre-sent the decision variables constraints.
Genetic Algorithm
Outline of the Proposed GA
Chromosome Representation
In this paper, a permutation-type chromosome adopted from Costa et al. [6] is applied to represent each chromosome. Each chromosome is divided into two segments. The first segment represents the DCs and the second one represents the warehouses. Thus, the length of the chromosome is the sum of possible DCs and warehouses. A locus in the chromo-some segment represents a facility that may be esta-blished. In the permutation-type chromosome, the value in each locus represents the priority of the faci-lity to be opened. A convention is used that number 1 is the highest priority and the next larger number will be less in priority. The values of each locus are unique across the two segments in a chromosome. Figure 3 illustrates a permutation-type chromosome with four possible DCs ad six possible warehouses to be opened. Table 1 shows the mapping value of locus to facilities priority.
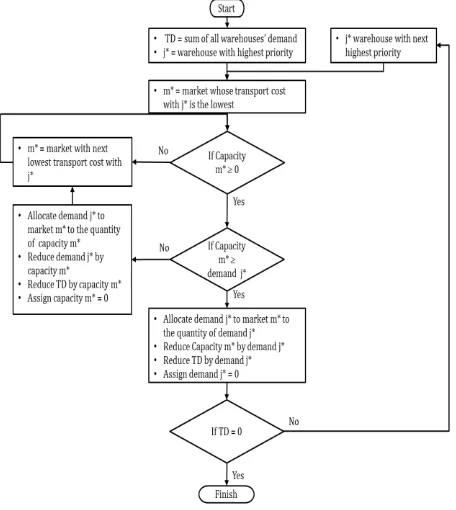
Decoding Procedure
Facility priority mapping will be useful for the decod-ing procedure. The final goal of decoddecod-ing process is to allocate demands to facilities. Once the demands are allocated, the total cost can be obtained through a known transport and facility building costs.
As the chromosome is divided into two segment, the decoding procedure can also be divided into two
steps. The first decoding step is done on the warehouse by allocating demands from regions to warehouses, and from warehouses to markets. The second decoding step is done on the DC segment where it allocate demands from warehouses to DCs, and from DCs to suppliers. The first decoding step can be described using flowcharts as shown in Figure 4 and Figure 5. The flowchart for demand allocation of the second step is similar.
4 1 5 7 9 2 3 8 6
1 2 3 1 2 3 4 5 6
DC W
are
hous
e
Figure 3. Illustration of the permutation-type chromosome
Table 1. Mapping value of locus to facilities priority
Facility Priority Facility to be opened
DC
1 DC 2 2 DC 1 3 DC 3
Warehouse
Figure 4. Flowchart of demand allocation from regions to warehouses.
Figure 5. Flowchart of demand allocation from ware-houses to markets.
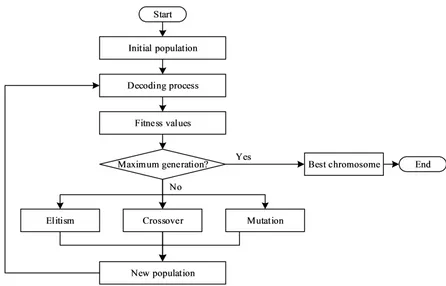
Genetic Algorithm Operators
Elitism. Elitism involves directly copying a number
of the best solutions from the current population to the new population.
Crossover. Crossover is a method in genetic
algo-rithm to mix best features of two candidate solution in order to find a better solution. This is done by mixing and exchanging the locus of two parent chromosome to obtain one or two new child chromo-somes. The crossover method used in this paper is position-based crossover illustrated in Figure 6.
4 1 5 7 9 2 3 8 6
4 1 2 8 9 7 3 5 6
6 4 3 2 9 1 8 7 5
Parent 1
Parent 2 Parent 2 Offspring 1
Figure 6. Illustration of position-based crossover
4
1
5
7
9
2
3
8
6
4
3
5
7
9
2
1
8
6
Parent
Offspring
Figure 7. Illustration of swap operator
According to Costa et al. [6], the procedure for generating offsprings are described in the following steps.
1. Select a set of position from parent 1 at random. 2. Generate an offspring by copying from parent 1
the randomly selected genes into the correspond-ing position of the offsprcorrespond-ing.
3. Fill the blank genes in the offspring by adding not already included genes in the order as they appear in parent 2.
4. Repeat the steps 1-3 for a second offspring by starting from a set of positions randomly selected from parent 2.
Mutation.Mutation is done to a single chromosome
to expand the solution space and escape a local optimum point. In the proposed GA, the swap opera-tor is used. Based on the selected chromosome, the operator selects two genes randomly and exchanges their position each other. Figure 7 illustrates the swap operator.
Results and Discussions
The proposed GA is implemented in Visual Basic for Application (VBA) of Microsoft Excel 2013. To assess the performance of the proposed GA, computational experiments are performed using four hypothetical instances. The main characteristics of each instance are shown in Table 2.
The proposed GA is run in 10 replications to obtain the best solution for each instance. Table 3 summa-rizes the computational results. From Table 3, it is shown that solving the MILP model can obtain the optimal solution only for three instances within 24 hours. For instance 4, solving the MILP model cannot find a feasible solution until 24 hours. But, using the proposed GA, the solution can be found within 25 seconds. Based on the optimal solutions obtained (instance 1-3), the gap in the total cost is very small (0.23%, on average).
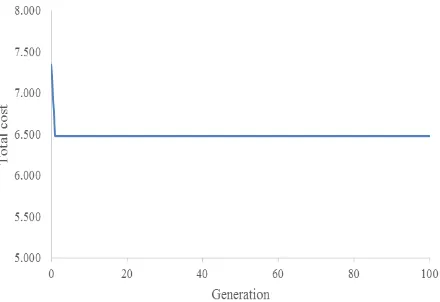
Figure 8 shows the convergence of the proposed GA based on instance 1 where it shows the best total cost for each generation. It is known that GA is a probabilistic metaheuristic approach. Therefore, each replication may produce a different solution. In terms of total cost, based on coefficients of variation, the consistency of the proposed GA is shown in Table 4.
It is shown that the coefficients of variations are close to 0 (based on 10 replications) and it demon-strates the consistency of the proposed GA. It is also observed that the bigger problem size will have a higher coefficient of variation.
Figure 8. Convergence of the prposed GA Table 2. Test instances
Instances RG WH DC IB OB SU_IB(1) SU_IB(2) SU_IB(3) MA_OB(1)
1 3 3 3 3 1 1 2 2 2
2 5 5 5 3 1 1 5 5 5
3 10 10 10 3 1 1 3 3 3
4 30 30 30 3 1 1 3 3 3
RG: Number of regions, WH: Number of warehouses, DC: Number of distribution centers, IB: Number of inbound products, OB: Number of outbound products, SU_IB(1): Number of plants for inbound product 1, SU_IB(2): Number of plants for inbound product 2, SU_IB(3): Number of plants for inbound product 3, MA_OB(1): Number of markets for outbound product 1.
Table 3. Computational results
Instance Optimal solution GA solution
TC CT TC CT
1 6,454 < 1 second 6,472 < 1 seconds
2 2,790,115 22 seconds 2,790,115 2 seconds
3 26,050 3.5 hours 26,155 4 seconds
4 Unknown 24 hours 88,697 25 seconds
TC: Total cost, CT = computation time
Table 4. Consistency for the proposed GA
Replication Instance
1 2 3 4
1 6,472.0 2,790,115.0 26,179.0 88,847.0
2 6,472.0 2,790,115.0 26,155.0 97,038.0
3 6,472.0 2,790,115.0 26,179.0 93,619.0
4 6,472.0 2,790,115.0 26,173.0 91,611.0
5 6,472.0 2,790,115.0 26,155.0 88,697.0
6 6,472.0 2,790,115.0 26,155.0 92,554.0
7 6,472.0 2,790,115.0 28,185.0 94,674.0
8 6,472.0 2,799,121.0 26,155.0 94,092.0
9 6,472.0 2,790,115.0 26,155.0 97,708.0
10 6,472.0 2,790,115.0 26,179.0 94,744.0
Average 6,472.0 2,791,015.6 26,367.0 93,358.4
Standard deviation 0.0 2,847.9 638.9 3,027.6
Conclusions
This paper has presented the facility location pro-blem in a supply chain network consisting of in-bound and outin-bound product flows. The solution approach based on genetic algorithm (GA) has been proposed. A computational experiment has been conducted to evaluate the performance of the pro-posed GA. The solutions of the propro-posed GA are com-pared to the optimal solutions obtained by solving the MILP model.
The comparison shows that there is a small gap (0.23%, on average) between the proposed GA and MILP model in terms of the total cost. In addition, the proposed GA can obtain the solution for the instance that cannot be obtained by solving the MILP model. Therefore, the proposed GA can be applied for solving large problems where they exist in the real situation. In addition, the proposed GA provides consistent results. In term of the total cost, it is demonstrated that coefficients of variation are closed to 0.
References
1. Suprayogi, Bahagia, S. N., and Thaddeus, Y., Location Problem in a Supply Chain Network
with Inbound and Outbound Product Flows, Proceedings of 6th International Conference on
Operations and Supply Chain Management,
2014, pp. 1353
–
1363, Bali.2. Min, H., and Zhou, G., Supply Chain Modeling: Past, Present and Future, Computers and
Industrial Engineering 43, 2002, pp. 231
–
249.3. Melo, M. T., Nickel, S., and Saldanha-da-Gama, F., Facility Location and Supply Chain Mana-gement–A Review, European Journal of
Operational Research 196, 2009, pp. 401
–
412.4. De Rosa, V., Gebhard, M., Hartmann, E., and Wollenweber, J., Robust Sustainable Bi-Directio-nal Logistics Network Design under
Uncertain-ty, International Journal of Production
Econo-mics 145, 2013, pp. 184
–
198.5. Zhang, Z. -H., Li, B. -F, Qian, X., and Cai, L. -N., An Integrated Supply Chain Network Design Problem for Bidirectional Flows, Expert Systems
with Applications,41, 2014, pp. 4298
–
4308.6. Costa, A., Celano, G., Fichera, S., and Trovato, E., A New Efficient Encoding/Decoding Proce-dure for the Design of a Supply Chain Network with Genetic Algorithms, Computers and