MANAGING PRODUCT RELIABILITY IMPROVEMENT
PROJECTS
Gembong Baskoro
Lecturer of Faculty of Industrial Technology, Industrial Engineering Department, Petra Christian University Surabaya
e-mail: [email protected]
ABSTRACT
Product reliability improvement projects have shown promising results for industries to preserve customer satisfaction. Therefore, best practices on reliability improvement in industries that operate in high volume consumer product can be used as a reference toward managing product reliability improvement. In reliability improvement the method should not only focus on how to achieve the expected deliverable but also to sustain the improvement itself and to close the improvement loop. The importance of managing product reliability improvement is on how to ensure that the project moves to the right direction without loosing its flexibility.
Keywords: reliability improvement, project.
1. INTRODUCTION
Alike other improvement projects, a reliability improvement project should also be managed in a structured way. Therefore to effectively manage reliability improvement projects, an appropriate strategy is needed. For this reason, this paper intends to demonstrate the importance of managing reliability improvement projects in practical context.
In a reliability improvement project, a checklist can be used to guide the project so that it can be completed in a structure and efficient way. In practice, initial success indicators of the project can be observed from the project plan. Therefore, developing a right project plan can ensure the success of the project. Moreover, to extend the success of the project requires a capability of managing the project. Managing a project requires an effort to understand the global view of the project. Also in managing a project includes the following activities: developing a model, setting goal and deliverable, planning, providing and motivating resource, identifying possible risks and traps, executing the project, controlling the project, solving conflict, and celebrating achievement.
Generally reliability improvement projects vary in term of duration, and complexity. To manage the project complexity, it is important to keep the focus, the energy, the momentum, and the excitement on the project. Moreover, it is also important to balance constraints e.g. project duration, deliverable, resource, budget, etc. Equally important is to seek compromise especially if the project involving many parties. It is because not surprisingly that each parties has their own interest on the project.
2. PROJECT CLASSIFICATION
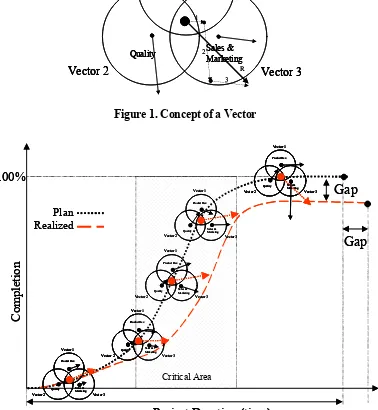
and/or outside the organization. Therefore it is possible that the interest from the parties can influence on the direction initially set for the project. To make a visualization, the interest can be defined as a vector as shown in Figure 1. It can be assumed that this vector of interest is changing over time, based on the focus of the interest itself (Figure 1). Therefore over time project should be reviewed to align the interests into the expected direction and goal (see also Figure 2).
Vector 3 Vector 2
Vector 1
Product Dev.
Quality Sales &Marketing
1
2
3 R
Vector 3 Vector 2
Vector 1
Product Dev.
Quality Sales &Marketing
Vector 3 Vector 2
Vector 1
Product Dev.
Quality Sales &Marketing
1
2
3 R
Figure 1. Concept of a Vector
Plan Realized
Gap
100%
Project Duration (time)
Critical Area
C
o
m
p
le
tion
Vector 3 Vector 2
Vector 1
Product Dev.
Quality Sales &Marketing Vector 3 Vector 2
Vector 1
Product Dev.
Quality Sales &Marketing
Vector 3 Vector 2
Vector 1
Product Dev.
Quality Sales &Marketing Vector 3 Vector 2
Vector 1
Product Dev.
Quality Sales &Marketing
Vector 3 Vector 2
Vector 1
Product Dev.
Quality Sales &Marketing Vector 3 Vector 2
Vector 1
Product Dev.
Quality Sales &Marketing
Vector 3 Vector 2
Vector 1
Product Dev.
Quality Sales &Marketing Vector 3 Vector 2
Vector 1
Product Dev.
Quality Sales &Marketing
Vector 3 Vector 2
Vector 1
Product Dev.
Quality Sales &Marketing Vector 3 Vector 2
Vector 1
Product Dev.
Quality Sales &Marketing
Gap
Plan Realized
Gap
100%
Project Duration (time)
Critical Area
C
o
m
p
le
tion
Vector 3 Vector 2
Vector 1
Product Dev.
Quality Sales &Marketing Vector 3 Vector 2
Vector 1
Product Dev.
Quality Sales &Marketing Vector 3 Vector 2
Vector 1
Product Dev.
Quality Sales &Marketing Vector 3 Vector 2
Vector 1
Product Dev.
Quality Sales &Marketing
Vector 3 Vector 2
Vector 1
Product Dev.
Quality Sales &Marketing Vector 3 Vector 2
Vector 1
Product Dev.
Quality Sales &Marketing Vector 3 Vector 2
Vector 1
Product Dev.
Quality Sales &Marketing Vector 3 Vector 2
Vector 1
Product Dev.
Quality Sales &Marketing
Vector 3 Vector 2
Vector 1
Product Dev.
Quality Sales &Marketing Vector 3 Vector 2
Vector 1
Product Dev.
Quality Sales &Marketing Vector 3 Vector 2
Vector 1
Product Dev.
Quality Sales &Marketing Vector 3 Vector 2
Vector 1
Product Dev.
Quality Sales &Marketing
Vector 3 Vector 2
Vector 1
Product Dev.
Quality Sales &Marketing Vector 3 Vector 2
Vector 1
Product Dev.
Quality Sales &Marketing Vector 3 Vector 2
Vector 1
Product Dev.
Quality Sales &Marketing Vector 3 Vector 2
Vector 1
Product Dev.
Quality Sales &Marketing
Vector 3 Vector 2
Vector 1
Product Dev.
Quality Sales &Marketing Vector 3 Vector 2
Vector 1
Product Dev.
Quality Sales &Marketing Vector 3 Vector 2
Vector 1
Product Dev.
Quality Sales &Marketing Vector 3 Vector 2
Vector 1
Product Dev.
Quality Sales &Marketing
Gap
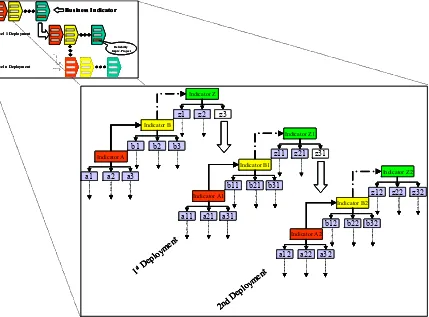
Figure 2. Moving of Interest Along Project Duration
Logically, the implication of this situation will be to project cost and project completion schedule. Moreover, if this situation is out of control then it can change the project to totally different goal than what it is intended at the first time (Figure 2).
2.1. Role of Business & Correlation to Business Plan
In a reliability improvement project, it is meaningful to understand the impact of this project for business. Sometimes it is not easy to (quantitatively) justify the impact for business. However, it is sufficient if the project has already been aligned to the business indicator preferably to key performance indicator (KPI).
Also it is not uncommon for reliability improvement projects that the contributions are considered as indirect contribution. It is valid only under circumstances that a direct contribution can only be made if a project is aligned to the key performance indicator. For this reason, it is necessary to know the links to other projects especially to those under the same umbrella of key performance indicator (see Figure 3).
Reliability Imprv. Project
Level 1 Deployment
Level n Deployment
Business Indicator
Reliability Imprv. Project
Level 1 Deployment
Level n Deployment
Business Indicator
Indicator Z
z1 z2 z3
Indicator B
b1 b2 b3
Indicator A
a1 a2 a3
Indicator Z1
z11 z21 z31
Indicator B1
b11 b21 b31
Indicator A1
a11 a21 a31
Indicator Z2
z12 z22 z32
Indicator B2
b12 b22 b32
Indicator A2
a12 a22 a32
1stDe ploy
ment
2nd D eplo
ymen t
Indicator Z
z1 z2 z3
Indicator B
b1 b2 b3
Indicator A
a1 a2 a3
Indicator Z1
z11 z21 z31
Indicator B1
b11 b21 b31
Indicator A1
a11 a21 a31
Indicator Z2
z12 z22 z32
Indicator B2
b12 b22 b32
Indicator A2
a12 a22 a32
1stDe ploy
ment
2nd D eplo
ymen t
Reliability Imprv. Project
Level 1 Deployment
Level n Deployment
Business Indicator
Reliability Imprv. Project
Level 1 Deployment
Level n Deployment
Business Indicator
Indicator Z
z1 z2 z3
Indicator B
b1 b2 b3
Indicator A
a1 a2 a3
Indicator Z1
z11 z21 z31
Indicator B1
b11 b21 b31
Indicator A1
a11 a21 a31
Indicator Z2
z12 z22 z32
Indicator B2
b12 b22 b32
Indicator A2
a12 a22 a32
1stDe ploy
ment
2nd D eplo
ymen t
Indicator Z
z1 z2 z3
Indicator B
b1 b2 b3
Indicator A
a1 a2 a3
Indicator Z1
z11 z21 z31
Indicator B1
b11 b21 b31
Indicator A1
a11 a21 a31
Indicator Z2
z12 z22 z32
Indicator B2
b12 b22 b32
Indicator A2
a12 a22 a32
1stDe ploy
ment
2nd D eplo
ymen t
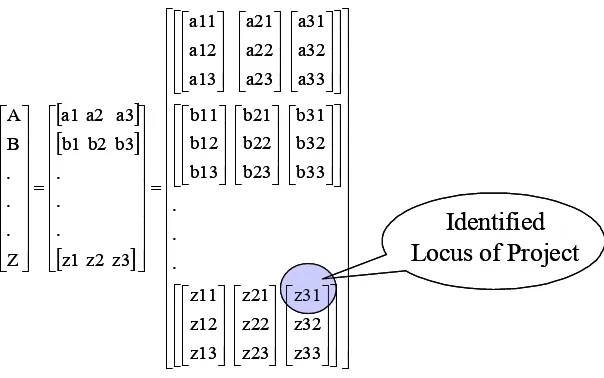
Figure 3. Deployment of Business Indicator
However, careful consideration is required in the decomposition. For example, if clustering with incorrect decomposition technique then it will end up with different goal as initially set. Therefore, it is important to have a correct decomposition technique. For example, the below vector matrix decomposition technique can be used as a model (Figure 4).
[ ] Locus of Project
[ ] Locus of Project
Figure 4. Matrix Decomposition
From this model, the project that has correlation to the reliability problem is on vector z31,
decomposed from the vector z3 with the initial indicator of Z. The vector z31 has two neighbors of
z11 and z21; they are located under z3 root (see also in Figure 3). Therefore to ensure the direction
of z3 under its intended direction it is necessary to resume test on the small projects of z11, z21, and
z31.
3. PROJECT DESIGN
3.1. Conceptual Development
Conceptual development plays a very significant role in order to have smooth and determined goal and/or objective. It is an initial step of a project design before defining a project plan. The conceptual development involves an understanding of big picture of the business such as grand business strategy and its correlation to other influence factors. The influence factors are
technology development, market change, and other issues that influence to the project.
A
B
C
D
Ma
rk
et
, S
al
es
Qua
lity,
R
el
ia
b
ility
P
rod
uc
t De
v.
Time
Time
Time
( Reliability ) Project Strategy, Plan
Business Indicator
Critical area
Critical area
Critical area
Grand Business Strategy; Vision, mission, values A
B
C
D
Ma
rk
et
, S
al
es
Qua
lity,
R
el
ia
b
ility
P
rod
uc
t De
v.
Time
Time
Time
( Reliability ) Project Strategy, Plan
Business Indicator
Critical area
Critical area
Critical area
Grand Business Strategy; Vision, mission, values
Figure 5. Conceptual Development
3.2. Project Global Strategy
To develop a project global strategy it is important to have the ability to define the strategy in a broader view (Figure 6). The global view helps to maximize control on the project.
A B
A1
A2
A3
B1
B2
B3
time
time
Gap Gap
Q
u
alit
y/R
el
ia
b
ilit
y
P
rod
uc
t De
ve
lopm
en
t
Project
A B
A1
A2
A3
B1
B2
B3
time
time
Gap Gap
Q
u
alit
y/R
el
ia
b
ilit
y
P
rod
uc
t De
ve
lopm
en
t
Project
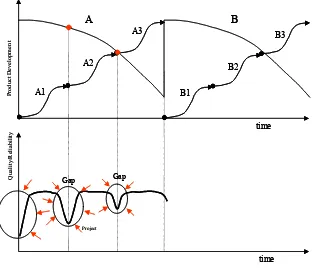
Figure 6 gives a model in global view of new product development; it starts with the project plan to develop product A to product B that has different characteristics. Therefore, in Figure 2, the A and B curves are located differently. Among other reasons of developing a new different product, usually one of them is due to innovation that is driven by technology breakthrough, saturation of market, and other driving forces (van Driel, 2003; von Stamm, 2003). In the life cycle of a product, namely product A from the conception to disposal, commonly there is a
continuous improvement on the product namely A1, A2, A3, etc. Usually, on this improvement no
major change/ breakthrough on the product.
Figure 6 also shows that weakness on product quality and reliability can happen regularly every time the product is introduced to the market. It is a gap between optimum performances of product quality/reliability to the first time performance when it is introduced. Therefore, reducing this gap can be one of the quality/reliability improvement strategies.
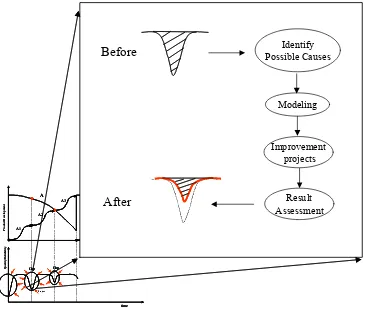
3.3. Importance of Modeling
After knowing what gap to be filled and its behavior, it is now the time to define the model. The model is used to describe the condition and the way to achieve the goal. It is the model that will explore root causes of the gap.
A B
A1 A2
A3
B1 B2
B3
time
time
Gap Gap
Q
u
al
it
y/
R
e
lia
b
il
it
y
P
roduc
t D
eve
lop
m
en
t
Project
A B
A1 A2
A3
B1 B2
B3
time
time
Gap Gap
Q
u
al
it
y/
R
e
lia
b
il
it
y
P
roduc
t D
eve
lop
m
en
t
Project
Identify Possible Causes
Modeling
Improvement projects
Result Assessment
Before
After
A B
A1 A2
A3
B1 B2
B3
time
time
Gap Gap
Q
u
al
it
y/
R
e
lia
b
il
it
y
P
roduc
t D
eve
lop
m
en
t
Project
A B
A1 A2
A3
B1 B2
B3
time
time
Gap Gap
Q
u
al
it
y/
R
e
lia
b
il
it
y
P
roduc
t D
eve
lop
m
en
t
Project
Identify Possible Causes
Modeling
Improvement projects
Result Assessment
Before
After
Figure 7. Model to Guide the Improvement
4. PLANNING FROM THE MODEL
Planning is the crucial start of a project improvement; the intention is on how to achieve the goal in an efficient, short and determined way. To better develop an efficient plan it is necessary to regularly refer to the model. Also important is on how to define the short path. Before developing a plan the following consideration should be taken into account:
1. Project duration
2. Resources availability
3. Budget availability
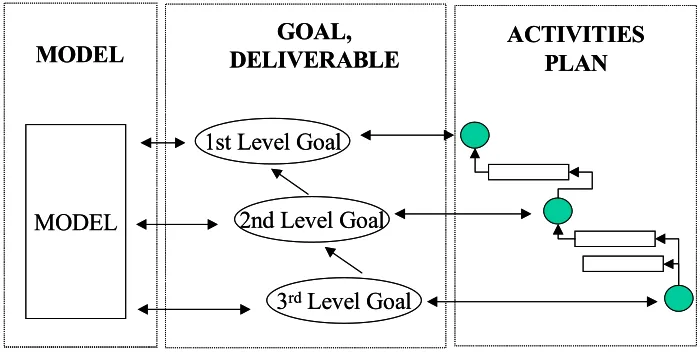
Commonly, these three factors can influence significantly to the project plan. Therefore, it is not uncommon that along the projects path these three factors have to be reviewed to ensure the objective is achievable. It is also important that for simplicity the ultimate goal can be breakdown to sublevel goals (see Figure 8).
MODEL
3rdLevel Goal
2nd Level Goal 1st Level Goal
MODEL
GOAL, DELIVERABLE
ACTIVITIES PLAN
MODEL
3rdLevel Goal
2nd Level Goal 1st Level Goal
MODEL
GOAL, DELIVERABLE
ACTIVITIES PLAN
Figure 8. The Breakdown of Project Goal
5. DISCUSSION
From the previous description, it can be noted that the importance factors for reliability improvement are as follows:
• Role of business
• Product portfolio strategy
• Business indicators
• Gap identification
• Efficient plan
It is possible that if reliability improvement projects established without proper consideration of the above factors then it can slip from the initial goal. Moreover, to develop a project strategy, the following factors are also important to be considered.
• Gap to be filled
• Model
• Goal/deliverable
• Resource
• Budget
• Time frame
Finally, to establish a reliability improvement project, it is urged that the project should be:
• Focus
• Small
• Medium time
• Team based
• Division of goal
This is necessary to bring the energy and momentum along the project and to ensure the success of the project.
REFERENCES
Baskoro, G., J.L. Rouvroye, A.C. Brombacher, 2002. “A Method for Product Reliability
Improvement”, Proc. of the 7th Int. Pac. Con. on Manufacturing & Management, ISBN
974-620-494-7, pp.124-129, Bangkok.
Baskoro, G., J.L. Rouvroye, W. Bacher, A.C. Brombacher, 2003. “Developing MESA: an
accelerated reliability test”, Proc. Ann. Reliability & Maintainability Symp. (RAMS), pp.
303-307, Florida.
Baskoro, G., J.L. Rouvroye, A.C. Brombacher, N. Radford, 2003. “High Contrast Consumer
Test: a case study”, Proc. European Safety & Rel. Conference (ESREL), p. 107-111,
Maastricht.
Brombacher, A.C., P.C. Sander, P.J.M. Sonnemans, J.L. Rouvroye, 2004. “Managing product
reliability in business processes “under pressure”, Reliability Engineering & System Safety,
vol. 88, pp. 137-146
Clark, K.B., S.C. Wheelwright, 1993. Managing New Product and Process Development, The
Free Press.
Dahan, E., J.R. Hauser, 2001. Product Development-Managing a Dispersed Process, for the
Handbook of Marketing.
De Meyer, A., C.H. Loch, M.T. Pich, 2002, Managing Project Uncertainty: From Variation to
Chaos, MIT SLOAN Management Review, pp. 60-67, Winter.
Kaplan, R.S., D.P. Norton, 1996. Translating Strategic into Action- The Balanced Scorecard,
Harvard Business School Press, Boston, Massachussets.
Kuczmarski, T.D., 1992. Managing new product: the power of innovation, Prentice-Hall.
Neely, A.D., C.A. Adams, 2000. The Performance Prism in Practice, Center for Business Performance, Cranfield School of Management, UK.
Trott, P., 2002. Innovation Management & New Product Development, Financial Times Pitman
Publishing.
van Driel, O.P., 2003. Tolerance Planning: The driving force in Design for Six Sigma, Innovation
& Industrial Support, Philips CFT, Eindhoven.