FORECASTING THE FREQUENCY OF DOMESTIC AIR PASSENGERS AT
JUANDA AIRPORT USING ARIMA AND TRANSFER FUNCTION AS A BASIS FOR
FUTURE DEVELOPMENT OF AIRPORT SCENARIO
Ary Miftakhul Huda, Heri Kuswanto, Suhartono
Commodity of Futures Trading Regulatory Agency (CoFTRA) – Ministry of Trade Kramat Raya Street No. 172, Jakarta10430 and (021) 31924744
e-mail: [email protected]
ABSTRAK
Kenaikan jumlah penduduk berbanding lurus dengan kebutuhan penduduk untuk menggunakan jasa transportasi, seperti jasa angkutan udara. Perkembangan jasa angkutan udara di Indonesia dapat dilihat dari peningkatan baik jumlah penumpang maupun barang yang diangkut selama 5 tahun terakhir, terutama di Bandar Udara Juanda. Peramalan jumlah penumpang periode ke depan dinilai penting untuk memberikan rekomendasi pada pihak bandara untuk mengembangkan kapasitas bandara. Kenaikan jumlah penumpang pada perode mendatang dapat diramalkan dengan analisis deret waktu dengan pendekatan multivariate time series, yakni model fungsi transfer dan univariate time series, yakni ARIMA Box Jenkins. Pada metode fungsi transfer, deret input adalah jumlah pesawat, inflasi, harga minyak dunia, sedangkan deret output adalah jumlah penumpang. Berdasarkan criteria Outsample, maka model yang terbaik untuk meramalkan jumlah penumpang domestik di Bandar Udara Juanda adalah model univariate time series, yakni ARIMA(1,1,0)(1,0,0)12 karena memiliki nilai RMSE yang minimum. Model terbaik yang didapatkan memiliki makna bahwa peramalan jumlah penumpang domestik di Bandar Udara Juanda bulan ini terkait dengan jumlah penumpang pada 1, 2, 12, 13, 14 bulan sebelumnya.
Kata Kunci : penumpang, pesawat, inflasi, harga minyak dunia, fungsi transfer
ABSTRACT
In this modern age, the increase of human population is proportional to the need for airport development services, including air transportation. In Indonesia, the development of air transportation services can be seen from the increase of both passenger numbers and goods transported during the last 5 years, including at Juanda Airport in East Java. The aim of this research wasto create an airport scenario based on the number of forcasted domestic air passengers. Globally, air passenger forcasting has been one of the most important policy tools used by decision makers. The growth in air passenger numbersin the future can be forecasted based on a time series analitical approach such as multivariate time series, for example the transfer function model as multivariate time series, and ARIMA Box Jenkins as univariate time series . In transfer function method, the input series is the number of aircrafts, inflation, oil prices, while the output series is the number of passengers. Based on Out-sample criteria, the best model to forecast the number of domestic passengers at the Juanda airport is univariate time series models, ARIMA(1,1,0)(1,0,0)12 due to its minimum RMSE values. The best model obtained implied that the forecastednumber of domestic passengers at Juanda airport this month was related to the number of passengers at 1, 2, 12, 13, 14 months earlier. The result of this research indicatedthat theforecastedvalue of domestic air passengers at Juanda airport for 5 years with ARIMA(1,1,0)(1,0,0)12, ie from January 2012 to December 2016, would increase gradually each year. Therefore, PT Angkasa Pura 1 should make a scenario to expand the capacity of aiports in order to accommodatethe increase of air passengers in the future, expecially at Juanda Airport.
Keywords: passengers, aircraft, inflation, oil prices, transfer function
INTRODUCTION
Indonesia’s 2012 population, there has been an increament in the population, about 20 million people based on the previous census data. In 2010 population census stated that the popula-tion of Indonesia ranges is about 237.556.363 souls that occupy an area which has an area of approximately 1.904.569 km2 and the current (in 2012) population in Indonesia has reached
257.516.167 people (Central Bureau of Statistics, 2012). The increase of human population is proportional to the demand of transportation, including air transportation. The development of air transportation services in Indonesia can be seen from the increase in both number of passengers and goods transported during the last 5 years, especially at Juanda Airport.
approaches such as univariate time series (ARIMA) and multivariate time series (Transfer Function). Several studies have been conducted to forecast air passenger. Suryani (2009) et al. conducted a research related to how to develop a model to forecast air passenger needs and to eva-luate some policy scenarios related with runway and passenger terminal capacity expansion to meet the future demand using regression methods. In those studies, it was found that plane tickets, service levels, GDPs, population, number of flights per day are influential in determining the volume of air passengers. Furthermore, Insanil (2010) forecasted the number of passengers and aircraft which arevery important to be used as reference in the world of transportation and tourism development using the ARIMA Box-Jenkins and ARIMAX involving dummy variable widths as input. Other studies about air passenger have been developed such as in studies indexed [D], [E], [F], and [G].
Transfer Function Model is a model that describes the predictive value of the future from time series (called series or output Yt) that is
based on past values of the time series itself and based also on one or more related time series (called input series or Xt) with output series.
Several studies using the Transfer Function method have been carried out in Indonesia. Dwi (2010) conducted modeling and forecasting gas sales in Surabaya. Data from the sales of the output variables are estimated to have the effect of input variables and the foreign exchange value of the number of customers which can be analyzed by using multiple input transfer function. By using this method, obtained from the forecasting model whose input variables is Foreign Exchange Rates and the output variable is the monthly sales results.
Nurani (2011) forecasted the stock price index PT HM Sampoerna Tbk by using multiple input Transfer Function. In this study, the stock price index forecasting model will be determined by the input variables that affect the exchange rate, the SBI rate, inflation rate, interest rate deposits, time deposits and positions in rupiah. The best forecasting model will be selected by the model that has all significant parameters, residual white noise, and the normal distribution, as well as having the smallest AIC. The results of the forecasting model in Transfer Function Multi Input value error evaluation remains at certain intervals. Interval evaluation is below 20%, which means the model is good for forecasting data. Other studies about Transfer Function in Indonesia has applied such as in studies indexed [J] and [K].
The development of research using the Transfer Function method has been performed on a variety of research around the world. Nelson and Paulo (2003) conducted a study to explain the numerical linear algebra algorithms for calculating the variabel the dominant power in the Multi Input Multi Output (MIMO) using a Transfer Function. Joe Kniss et al. (2003) conducted a study using a Gaussian Transfer Function because it is considered suitable to model and classify variable multivariate multidimensional data structures with numerical and graphical approach. Other studies havealso applied this method, such as studies indexed [N], [O], and [P].
RESEARCH METHOD
Air traffic statistical data, namely SLALU, were obtained from PT Angkasa Pura 1, an Indonesian airport operator. The data includes data of air passenger numbers and monthly domestic flight numbers within the period of January 2000 to December 2011. Monthly inflation and oil price data were obtained from the website of BPS-Statistics Indonesia, starting from January 2000 to December 2011 with monthly.
As for the analyses, this research employed two forecasting models known as ARIMA and Transfer Function. In the Transfer Function model, the input series is the number of aircrafts, inflation, oil prices, while the output series is the number of air passengers. The first procedure performed in the data analysis was the separation of input data series i.e., the number of aircrafts, January to December of 2011.
Then, the air passengers were forcasted using two approaches, ARIMA and Transfer Function. Box and Jenkins (1976) explained that there are four procedures in ARIMA which are model identification, parameter estimation, diagnostic check, and forecasting. Bowerman (1993) explained that there are three procedures for building a Transfer Function model. Those are :
1. Identification of a model describing xt and
prewhitening of xt and yt.
3. Identification of a model describing and of a final transfer function model.
RESULT AND DISCUSSION
Annual average of passenger numbers from 2000 to 2011 at Juanda Airport showed a continuable growth.This shows an increase in air transportation demand.The value of standard deviation was 254.340 passengers, meaning that the number of passengers per month displays a high variation. The highest number of passengers recorded by PT Angkasa Pura from 2000 to 2011 are as many as 1.190.385 people, while the lowest number of passengers are as many as 152.139 people.
ARIMA Box Jenkins (Univariate Time Series)
In determining the forecasting model with univariate time series, it can be seen from the time series plot of the data on the number of passengers to arbitrate the patterns and characteristics of the data. The time series plot of air passengers showed that the data of numbers of passengers is not stationary in the mean, so it is necessary to process non-seasonal differencing order 1. After undertaking the process, data on the number of passengers becomes stationary, then the estimation parameter is tested using t test statistic. ARIMA model must be checked whether the residual asssumption is white noise with L-Jung Box Test. Then, the testing residual which is having a normal distribution or not with Kolmogorov Smirnov. Based on the results of the Kolmogorov Smirnov test, three models, such as ARIMA (0,1,1 [13])(1,0,0)12, ARIMA
Table 1. Selecting Best Model in ARIMA
Model ARIMA AIC assumptions of significant residual white noise and normally distributed, and has minimum AIC value than other models. ARIMA model equa-tions for forecasting the number of passengers above, explainesthat forecasting the numbers of passengers at the Juanda airport this month is
related to the number of passengers at 1, 2, 12, 13, 14 months earlier.
Transfer Function (Multivariate Time Series)
To forecast the number of passengers with transfer function method, the considered best ARIMA model must be selected in the input sequence, such as the number of aircrafts, global oil prices, and inflation rates. ARIMA model equations are considered important in the formation of the transfer function model. ARIMA (1,1,0)(1,0,0)12 showed that the number of aircrafts at the current time period is related to the number of aircraft in period 1, 12, 13 months earlier.
The best ARIMA model for global oil price model is ARIMA(1,1,0). Equation in global oil prices meant that forecasting oil prices this month associated with global oil prices at 1, 2, 6 months earlier.
The best model which is used to model the inflation model is ARIMA (0,1,1) for the model parameters as well as meeting the assumptions of significant residual white noise and normally distributed, and has the minimum AIC value compared to other models. The equations is taken from ARIMA model for the input series of inflation, namely ARIMA(0,1,1) which explaines that the value of forecasting inflation this month is related to the inflation rate in the next 1 month earlier.
0 5 10 15 20 25 30
1 8 15 22 29 36 43 50 57
FORECAST
LOWER
UPPER
mestic passenger’s pattern at Juanda airport has dependencies in the number of domestic passengers at Juanda airport in months of 1, 2, 12, 13 months earlier and has a linear correlation with oil prices at 2, 3, 4, 14, 15 months earlier.
Meanwhile, the Transfer Function model for the Inflation rate is ARIMA(0,0,2 [12,24]) of those orde is b=16; r=0; s=0. It can be seen that the number of domestic passengers at Juanda airport this month has dependencies with the number of domestic passengers at Juanda airport in one month in advance and has a linear correlation with inflation at 16 and 17 months earlier.
Moreover, the establishment of Multi Input Transfer Function Models is done by firstly testing the significance of parameters using a statistical t test with significance level α = 0,05 to ARIMA (0,0,1 [12]). It is then known that all the ARIMA model parameters are statistically significant seen from its p-value less than α=0,05 but the orde of parameter (b, r, s) from the output series, such as global oil price (ω2), inflation rate
(ω16) that arenot statistically significant because
p-value is greater than α=0,05. Input sequence which is only statistically significant by number of aircrafts with p-value less than α=0,05. Therefore, the forecasting model of air passengers using the approach of Multivariate Time Series is Single Input Transfer Function with an input sequence of the number of the aircrafts.
Best Model in Forecasting Domestic Air Passengers
As the forecasting model fordomestic air passengers with ARIMA (univariate time series) and transfer function (multivariate time series) being obtained, the next stage is to compare both best models to forecast domestic air passengersat Juanda airport with the out-sample criteria using the criteria of RMSE.
Table 2. Comparison beetwen ARIMA and Transfer Function
Model RMSE
ARIMA 0,600891
Transfer Function 0,9255667
Based on the Out-sample criteria, the best model to forecast number of domestic air passengers at Juanda airport is the univariate time series models, ARIMA (1,1,0)(1,0,0)12 because it has a minimum RMSE values.
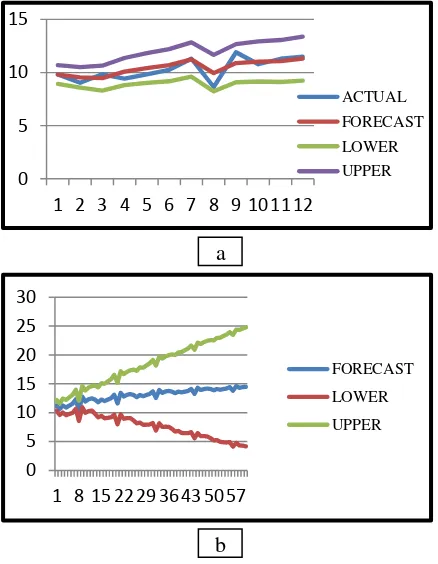
From Fig. 1. (a) it is understood that the forecasting value and the actual value of domestic passenger numbers at the Juanda airport using ARIMA Box Jenkins are still in the lower and upper bound forecasting with 95% confidence level. This suggests that ARIMA(1,1,0)(1,0,0)12 is capable of forecasting domestic air passengers. From Fig. 1. (b), the forecasted the number of domestic passengers at Juanda airport for 5 years, explained that the number of passengers from January 2012 to December 2016 is well within the upper and lower limit prediction. It suggests that the value of forecasted number of domestic passengers at Juanda airport in January 2012 to December 2016 is worth using.
Fig. 1. (a) Forecast and Actual Data Model ARIMA; (b) Forecast Air Passengers in 5 years
0 5 10 15
1 2 3 4 5 6 7 8 9 10 11 12
ACTUAL
FORECAST LOWER
UPPER
a
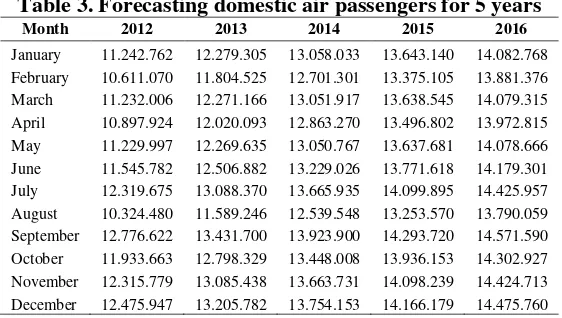
Table 3. Forecasting domestic air passengers for 5 years Month 2012 2013 2014 2015 2016
January 11.242.762 12.279.305 13.058.033 13.643.140 14.082.768
February 10.611.070 11.804.525 12.701.301 13.375.105 13.881.376
March 11.232.006 12.271.166 13.051.917 13.638.545 14.079.315
April 10.897.924 12.020.093 12.863.270 13.496.802 13.972.815
May 11.229.997 12.269.635 13.050.767 13.637.681 14.078.666
June 11.545.782 12.506.882 13.229.026 13.771.618 14.179.301
July 12.319.675 13.088.370 13.665.935 14.099.895 14.425.957
August 10.324.480 11.589.246 12.539.548 13.253.570 13.790.059
September 12.776.622 13.431.700 13.923.900 14.293.720 14.571.590
October 11.933.663 12.798.329 13.448.008 13.936.153 14.302.927
November 12.315.779 13.085.438 13.663.731 14.098.239 14.424.713
December 12.475.947 13.205.782 13.754.153 14.166.179 14.475.760
In Table 3, the forecasted of the number of domestic air passengers at Juanda airport for 5 years, ie from January 2012 to December 2016, shows an increasing trend annually. It is therefore suggested that PT Angkasa Pura 1 should make a planning to face this condition.
CONCLUSION
In this research, Univariate Time Series and Multivariate Time Series were used. Based on the ARIMA Box Jenkins analysis, the best model is ARIMA(1,1,0)(1,0,0)12. ARIMA model equations for forecasting the number of passengers explained that forecasting the number of passengers at the airport Juanda this month is related to the number of passengers at 1, 2, 12, 13, 14 months earlier.
Furthermore, it is also concluded that the best model for forecasting domestic air passengers using multivariate time series is Single input transfer function. The generated model explained that the pattern of the number of domestic passengers at Juanda airport has dependencies with the number of domestic passengers at Juanda airport in one month in advance and have a linear correlation with the number of aircraft on 12 and 13 the previous month. Therefore, the interpretation of the model noise series ARIMA (0,0,1 [12,23]) with linkages occur at lag-0 and lag-12 can be used to describe a linear relationship between the number of aircraft on the number of domestic passengers at airport Juanda.
The best model among univariate time series and multivariate time series is choosen by an out sample criteria. The result showed that the best model for forecasting domestic air passengers is univariate time series with ARIMA(1,1,0)(1,0,0)12because it has minimum value of Root Mean Squared Error (RMSE). Then, the ARIMA model is capable of forecasting domestic air passengers in 5 years because the forecast value is still in lower and
upper 95% confidence Interval. In the forecast value, we know that the domestic air passengers is likely to increase each year. So, based on this information, PT Angkasa Pura 1 should expand his capacity in order to face the increse of domestic air passengers in the future.
ACKNOWLEDGMENT
Authors would like to express thank to the reviewer for giving helpful comments. Authors would also like thank PT. Angkasa Pura 1 for providing air passengers and aircraft data from 2000 until 2011. This research was funded by the Department of Statistics, Mathematics and Science Faculty, Institute of Teknologi Sepuluh Nopember (ITS).
DAFTAR PUSTAKA
A.Badan Pusat Statistik. 2012. Hasil Sensus Penduduk Tahun 2012. Jakarta : Badan Pusat Statistik..
B. Suryani, Chou, dan Chen. 2010. Air Passenger Demand Forecasting and Passenger Terminal Capacity Expansion: A System Dynamics Framework. Journal of Expert Systems with Applications Vol. 37 pages 2324–2339.
C. Insanil, M. K. 2010. Pemodelan dan Peramalan Jumlah Penumpang dan Pesawat Di Terminal Kedatangan Internasional Bandara Juanda Surabaya dengan Metode Variansi Kalender. Surabaya : Institut Teknologi Sepuluh Nopember.
F. Prakoso, A. R. 2011. Analisis Peramalan Data Kedatangan Pesawat di Bandara Internasional Juanda Surabaya Dengan Menggunakan Metode Arima Box Jenkins. Surabaya : Institut Teknologi Sepuluh Nopember.
G.Ahadianti. 2010. Pemodelan Jumlah Penumpang Pesawat Rute Surabaya-Balikpapan Dengan Menggunakan Metode Fungsi Transfer Multi Input. Surabaya : Institut Teknologi Sepuluh Nopember.
H.Dwi, M. S. 2010. Pemodelan Dan Peramalan Penjualan Gas Bumi Sektor Industri Di Wilayah Surabaya Dengan Menggunakan Metode Fungsi Transfer. Surabaya : Institut Teknologi Sepuluh Nopember.
I. Nurani, F. 2011. Peramalan Indeks Harga Saham PT HM Sampoerna Tbk dengan Menggunakan Metode Fungsi Transfer Multi-Input. Surabaya : Institut Teknologi Sepuluh Nopember. J. Septiorini, A. 2010. Peramalan Inflasi Nasional yang Dipengaruhi Faktor Ekonomi Makro dengan Metode Fungsi Transfer. Surabaya : Institut Teknologi Sepuluh Nopember.
K.Yuliani, F. 2011. Peramalan Aset Dengan Memperhatikan Dana Pihak Ketiga (DPK) dan Pembiayaan Perbankan Syariah di Indonesia dengan Metode Fungsi Transfer. Surabaya : Institut Teknologi Sepuluh Nopember. L. Martins, N and Quintao, P. E. M. 2003.
Computing Dominant Poles of Power System Multivariable Transfer
Functions. Journal of IEEE Transactions On Power Systems, Vol. 18, No. 1.
M. Kniss, J. et al. 2003. Gaussian Transfer Functions for Multi-Field Volume Visualization. Journal of IEEE Visualization, Seattle, Washington. N. Rommes dan Martins. 2006. Efficient
Computation of Multivariable Transfer Function Dominant Poles Using Subspace Acceleration. Journal of IEEE Transactions On Power Systems, Vol. 21, No. 4.
O.Xiong dan Cai. 2006. Effective Transfer Function Method For Decentralized Control System Design Of Multi-Input Multi-Output Processes. Journal of Process Control 16 Pages 773–784. P. Garniera, et al. 2006. An Optimal IV
Technique For Identifying Continuous-Time Transfer Function Model Of Multiple Input Systems.
Journal of Control Engineering Practice 15 pages 471–486.
Q.Box, J. dan Reisel. 1994. Time Series Analysis and Control Forecasting. Prentice Hall. New Yersey.
R. Wei, W.W.S. 1994. Time Series Analysis: Univariate and Multivariate Methods. Addison-Wesley Publishing Company, New York.
S. Boweman, B. L. and O’Connell, R. T. 1993.