© The Author 2013. Published by Oxford University Press on behalf of the American Association for Public Opinion Research. All rights reserved. For permissions, please e-mail: [email protected]
THE PollS—TrEndS
AMERICANS’ CHANGING VIEWS ON CRIME AND
PUNISHMENT
MARK D. RAMIREZ*
Abstract Despite a decline in crime rates, the size of America’s crimi-nal justice system has continued to expand in both expenditures and the number of citizens under correctional supervision. Polls examined here show that the public viewed national crime as declining since the 1990s, while viewing local crime rates as stable. Moreover, the polls show that public support for “get tough” crime policies, once seen as unwavering, has declined substantially. The decline in support occurred across a range of policies, from judicial sentencing to the death penalty to increasing expenditures for law enforcement agencies. Finally, polls show fluctuations in public views regarding which political party was better suited to deal with crime. Overall, these data illustrate that leaders now have the opportunity to move policy in a less punitive direction and that no single party has ownership over the issue.
After 50 years of punitive approaches to dealing with crime, the correctional population (i.e., individuals experiencing incarceration, parole, probation) within the United States is higher than in any other country. An estimated seven million Americans (one in every 34 adults) are under some form of cor-rectional supervision (Glaze and Parks 2012). State and federal governments continue to devote substantial resources to fighting crime despite declines in revenue. This has led some scholars to conclude that the expansion of the criminal justice system is as significant as other postwar developments, such as the welfare state, the civil rights movement, and the Cold War (Edsall and
Edsall 1992; Tonry 1995; Gottschalk 2006).
Mark D. Ramirez is an assistant professor in the School of Politics and Global Studies, Arizona State University, Tempe, AZ, USA. The author thanks James E. Monogan and an anonymous reviewer for their helpful comments and assistance. Thanks also go to Sarah Dutton at CBS, Sheldon Gawiser at NBC, Scott Keeter at the Pew Research Center, and Maura Strausberg at Gallup for assistance with documentation. *Address correspondence to Mark D. Ramirez, Arizona State University, School of Politics & Global Studies, 6th Floor, Coor Hall, P.O. Box
873902, Tempe, AZ 85287-3902, USA; e-mail: [email protected].
doi:10.1093/poq/nft040 Advance Access publication December 10, 2013
at Jordan University of Science and Technology on July 26, 2016
http://poq.oxfordjournals.org/
Past issues of Public Opinion Quarterly have examined trends in public support for capital punishment (Erskine 1970), criminal sentencing (Erskine
1974; Warr 1995), and criminal justice institutions (Shaw et al. 1998). These
articles showed an increase in public support for various punitive policies between the 1970s and mid-1990s—an increase concurrent with actual and perceived changes in crime (Beckett 1997). Yet crime has declined signifi-cantly since the mid-1990s. According to the FBI’s Uniform Crime Report,
violent crime declined from 1,857,670 reported instances in 1994 to 1,203,564 reported instances in 2011 (a decrease of approximately 35 percent). Similarly, property crimes declined from 12,131,873 reported instances in 1994 to 9,063,173 reported instances in 2011 (a decrease of approximately 25 per-cent). Subsequently, “law and order” campaigns, prominent between 1964 and 1994, have subsided, and new issues such as global warming and immigration have moved to the forefront (Marion, Smith, and Oliver 2009).
An examination of polls between 1994 and 2013 shows changing public per-ceptions of national crime consistent with changes in the crime rate. The polls also show a decline in support for a variety of punitive policies (e.g., judicial sentencing, capital punishment, spending on law enforcement). However, sup-port for nonpunitive policies has remained stable, suggesting that the public is not ready to do away with punitive solutions to crime. The polls also show fluctuations in what party the public felt is best suited to deal with crime, but stability in support for law enforcement authorities.
Moreover, terrorism appears to have become entangled with criminal justice opinions and policy (Forst 2009). Public officials have linked the war on ter-ror to organized crime, drug trafficking, and street violence (Forst, Green, and
Lynch 2011). The violent nature of both crime and terrorism can instill fear in
the public, leading to a greater need for security. Subsequently, the polls show increases in support for punitive policies coinciding with terrorist activities, even though these are distinct phenomena.
Perceptions of Crime
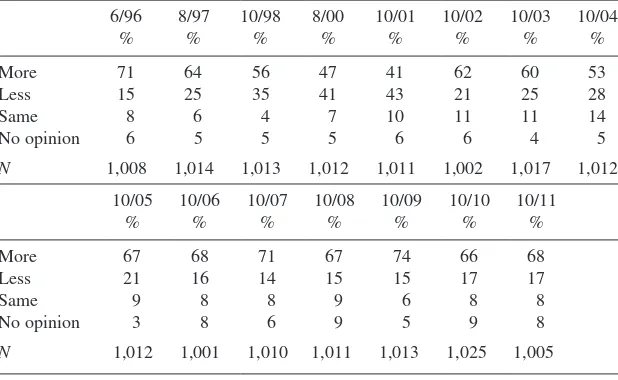
The public perceived a decline in national crime after the mid-1990s, but there is mixed evidence regarding the longevity of this change. Table 1 shows that 71 percent of respondents believed there was more crime in 1996 than in the previous year. This figure declined to 41 percent by 2001. From 2001 to 2002, there was a 21-percentage-point increase in the perception that there was more crime across the nation, possibly spillover from the terrorist attacks on September 11, 2001. An increased perception of national crime continued from 2004 to 2011. Table 2, however, shows that 73 percent of respondents in 1994 perceived that national crime had “gotten worse,” but by 2012 this percentage dropped by 28 percentage points. Respondents seem more willing to report that crime had “stayed the same” in this latter poll. Finally, table 3 shows a 15-percentage-point decline in how much respondents “worry” about
at Jordan University of Science and Technology on July 26, 2016
http://poq.oxfordjournals.org/
crime between 2001 and 2013. Public fear of crime reached its nadir in 2012, when only 42 percent of the respondents said they worry “a great deal” about “crime and violence.”
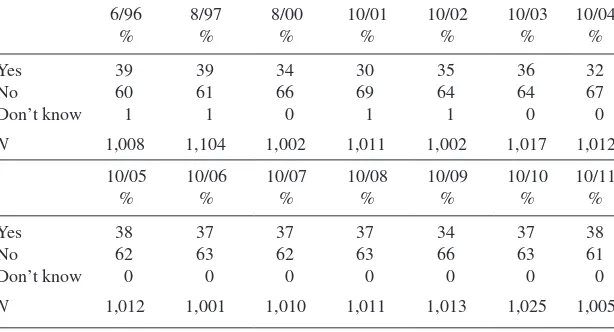
Table 4 also shows a small change in respondents’ perceived fear to walk
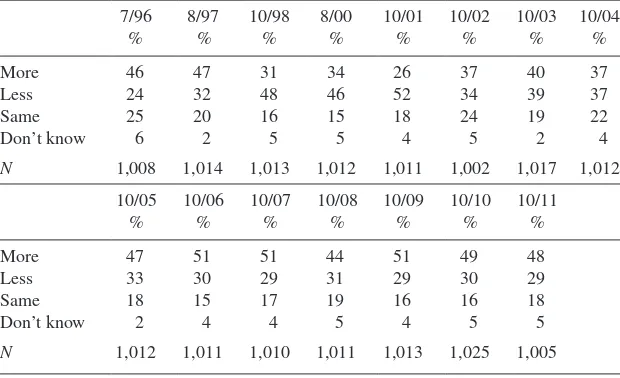
alone at night. The 1996 poll shows that 39 percent of respondents feared walking “alone at night.” This figure declined by 9 percentage points by 2001, with small year-to-year changes thereafter. According to table 5, the percent-age of respondents who viewed an increase in neighborhood crime dropped between 1996 and 2001, from 46 percent to 26 percent. However, this percent-age went back up to 48 percent by 2011.
Table 1. Perception of Crime in United States. GALLUP: “Is there more crime in the U.S. (United States) than there was a year ago, or less?”
6/96
N 1,008 1,014 1,013 1,012 1,011 1,002 1,017 1,012
10/05
N 1,012 1,001 1,010 1,011 1,013 1,025 1,005
Table 2. Perception of national Crime. CBS/NEW YORK TIMES: “In the last year, do you think crime in the country has increased, decreased, or stayed about the same?”
1/94
Increased 73 51 51 45
Decreased 3 12 14 7
Stayed the same 23 34 31 43
Don’t know 1 3 4 5
N 1,146 1,076 1,200 1,089
Samples are based on telephone interviews of adults in the United States. The 2012 sample is based on landline and cell-phone interviews of adults in the United States.
at Jordan University of Science and Technology on July 26, 2016
http://poq.oxfordjournals.org/
Finally, table 6 shows stability in public concern about drug use. The percent-age of respondents who worried “a great deal” about drug use in 2001 was 58 Table 3. Worry about Crime and Violence in the nation. GALLUP: “I’m going to read a list of problems facing the country. For each one, please tell me if you personally worry about this problem a great deal, a fair amount, only a little, or not at all. How much do you personally worry about crime and violence?”
N 1,060 1,006 1,008 1,005 1,004 1,000 1,009 1,012 1,014
3/11
amount 30 31 28
Only a little 19 21 20
Not at all 6 5 5
No opinion 0 0 0
N 1,021 1,024 1,022
Table 4. Fear of Crime in neighborhood. GALLUP: “Is there any area near where you live—that is, within a mile—where you would be afraid to walk alone at night?”
6/96
N 1,008 1,104 1,002 1,011 1,002 1,017 1,012
10/05
N 1,012 1,001 1,010 1,011 1,013 1,025 1,005
at Jordan University of Science and Technology on July 26, 2016
http://poq.oxfordjournals.org/
percent. This figure dropped to 49 percent by 2002, and to 42 percent by 2012. Overall, perceptions of crime declined during the late 1990s, increased slightly after 2001, and remained somewhat stable for the remainder of the decade. Table 5. Perception of Crime in neighborhood. GALLUP: “Is there more crime in your area than there was a year ago, or less?”
7/96
N 1,008 1,014 1,013 1,012 1,011 1,002 1,017 1,012
10/05
N 1,012 1,011 1,010 1,011 1,013 1,025 1,005
Table 6. Concern for drug Use. GALLUP: “How much do you worry about drug use?”
N 1,060 1,006 1,008 1,005 1,004 1,000 1,009 1,012
3/10
amount 27 24 24
Only a little 22 21 21
Not at all 13 14 13
No opinion 1 1 0
N 1,014 1,021 1,024
at Jordan University of Science and Technology on July 26, 2016
http://poq.oxfordjournals.org/
Judicial Sentencing
It is widely believed that public support for tougher judicial sentencing is a permanent fixture of American politics (e.g., Aladjem 2008). In the 1990s, a majority of Americans supported “get tough” sentencing policies such as man-datory minimums and “three strike” laws (Tyler and Boeckmann 1997). Yet,
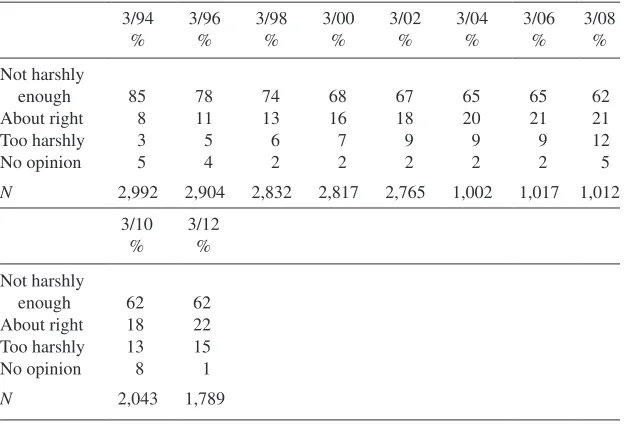
as table 7 shows, the public’s support for tougher sentencing declined from 85
percent in 1994 to 62 percent by 2012. A seven-percentage-point drop occurred between 1994 and 1996, while a 12-percentage-point drop occurred between 1996 and 2002. Disaggregating the General Social Survey (GSS) data between 1996 and 2000 (the period of greatest change) by subgroup shows that support declined among men (20 percentage points), women (16 percentage points), blacks (19 percentage points), whites (17 percentage points), Republicans (12 percentage points), Democrats (20 percentage points), respondents between 18 and 29 years of age (16 percentage points), and respondents over the age of 65 (20 percentage points).1
The decline in support for tougher sentencing could be a reaction to the growing number of conservative judges on both federal and state courts
1. These data were disaggregated by the author using the General Social Survey Cumulative File:
Smith et al., General Social Survey, 1972–2012 [machine-readable data file]; Chicago: National
Opinion Research Center [producer]; Storrs, CT: Roper Center for Public Opinion Research, University of Connecticut [distributor], 2013. Partisans are respondents with either a strong or moderate affiliation with a particular political party. Independents or party leaners are excluded from the percentages reported here. However, support for punitive policies also declined among these groups.
Table 7. Judicial Sentencing. GSS: “In general, do you think that the courts in this area deal too harshly or not harshly enough with criminals?”
3/94
N 2,992 2,904 2,832 2,817 2,765 1,002 1,017 1,012
3/10
About right 18 22
Too harshly 13 15
No opinion 8 1
N 2,043 1,789
at Jordan University of Science and Technology on July 26, 2016
http://poq.oxfordjournals.org/
(Posner 2008) or to an increase in federally mandated sentences. It is possible that as the courts became more punitive, the public began to temper its demand for tougher sentencing.
Capital Punishment
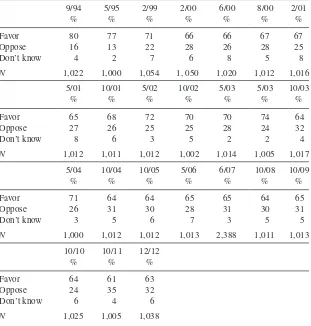
Support for capital punishment often hinges on the question format. The seemingly solid support for capital punishment shown in polls that constrain respondents to either favor or oppose the policy can significantly erode when respondents are provided with sentencing alternatives such as life without parole. The Gallup question that constrains respondents to either favor or oppose the death penalty for murder shows a substantial decline in public sup-port since its peak in 1994 (Warr 1995). Responses to the Gallup question, shown in table 8, reveal that the percentage of Americans favoring the death
Table 8. death Penalty Support. GALLUP: “Are you in favor of the death penalty for a person convicted of murder?”
9/94
N 1,022 1,000 1,054 1, 050 1,020 1,012 1,016
5/01
N 1,012 1,011 1,012 1,002 1,014 1,005 1,017
5/04
N 1,000 1,012 1,012 1,013 2,388 1,011 1,013
10/10
Oppose 24 35 32
Don’t know 6 4 6
N 1,025 1,005 1,038
at Jordan University of Science and Technology on July 26, 2016
http://poq.oxfordjournals.org/
penalty declined from 80 percent in 1994 to 65 percent by May 2001. Support for the death penalty increased to 68 percent by October 2001, shortly after the attacks on 9/11. Support, however, declined 10 percentage points between 2004 and 2011, suggesting that any influence of the terrorist attacks on death penalty support was short lived.
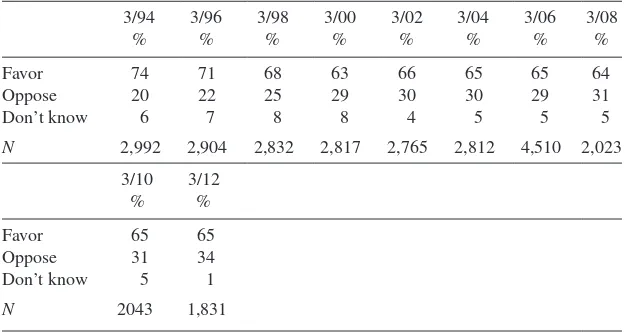
The GSS also uses the favor-or-oppose format and shows a similar decline in support for the death penalty. As shown in table 9, 74 percent of GSS respondents favored the death penalty in 1994, which declined to 63 percent by 2000. Support increased to 66 percent by March 2002, six months after the terrorist attacks on 9/11, and stabilized at about 65 percent between 2004 and 2012. Disaggregating the change in public support between 1994 and 2002 by subgroup shows that the largest decline in support occurred among women (13 percentage points), blacks (12 percentage points), and respond-ents above 65 years of age (13 percentage points). The smallest decline in support occurred among Republicans (five percentage points) and men (seven percentage points).
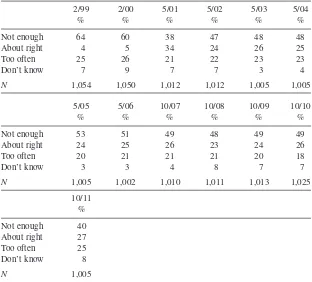
Table 10 shows a decline in the percentage of Americans saying the death
penalty is not implemented enough. In 1994, 64 percent of Americans believed the death penalty should be implemented more. This declined to 38 percent prior to 9/11. After 9/11, 47 percent of Americans believed the death penalty should be used more often. This declined to 40 percent by 2011. The decline in support for the death penalty follows a rise in litigation challenging the use of lethal injection as a means of execution (Steiker 2013). It also occurs alongside a decline in support among policymakers as legislative repeals of the death penalty have occurred in New Jersey, New Mexico, Illinois, Connecticut, and
Table 9. death Penalty opposition. GSS: “Do you favor or oppose the death penalty for persons convicted of murder?”
3/94
N 2,992 2,904 2,832 2,817 2,765 2,812 4,510 2,023
3/10
at Jordan University of Science and Technology on July 26, 2016
http://poq.oxfordjournals.org/
Maryland, while state courts in New York, Nebraska, and Kansas have ruled its use unconstitutional.
Sentencing Choices
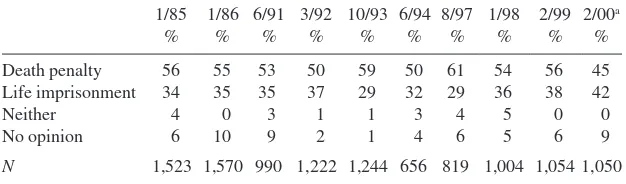
Declining support for the death penalty is also visible when the public is given a choice between sentencing criminals convicted of homicide to death or life imprisonment with no chance of parole. Table 11 shows that from 1985 to 1999, a majority of Americans preferred the death penalty. There is a 9-percentage-point increase in support for the death penalty by October 1993, six months after the siege in Waco, Texas, and the same month Congress introduced the Violent Crime Control and Law Enforcement Act (VCCLEA). Support for the death penalty increased 11 percentage points between 1994 and 1997, which coincides with the sentencing of the Table 10. Implementation of the death Penalty. GALLUP: “In your opinion, is the death penalty imposed—too often, about the right amount, or not often enough?”
N 1,054 1,050 1,012 1,012 1,005 1,005
5/05
N 1,005 1,002 1,010 1,011 1,013 1,025
10/11
at Jordan University of Science and Technology on July 26, 2016
http://poq.oxfordjournals.org/
Unabomber Ted Kaczynski. Support for life imprisonment was stable from 1985 to 1999 but nearly reached parity with support for the death penalty at 42 percent by 2000.
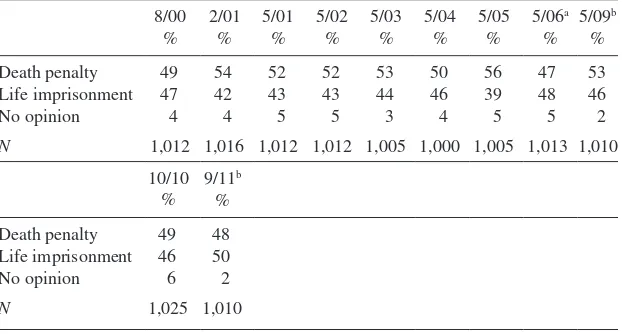
Table 12 shows responses to the same question with the addition of a
ques-tion preface.2 Support for the death penalty increased to 54 percent by 2001
and remained stable for the next three years. Support for life imprisonment also remained stable around 43 percent during this period. In the 2011 poll, Americans were split between the death penalty (48 percent) and life impris-onment (50 percent). If we assume the changes in the question preface had lit-tle effect on respondents’ opinions, then support for life imprisonment relative to the death penalty increased between 1985 and 2011.
Alternatives to Punishment
A series of Gallup polls, shown in table 13, reveal that a majority of Americans from 1989 to 2004 favored attacking the social problems that lead to crime rather than expanding the scope of law enforcement. In 1989, 61 percent favored attacking social problems, a figure that increased to 67 percent by 1992. This figure declined to 57 percent in 2004. Support for increasing pris-ons, police, and judges decreased from 32 percent in 1994 to 27 percent by 2000—consistent with the overall decline in punitiveness during this period. This figure increased to 39 percent by 2004.
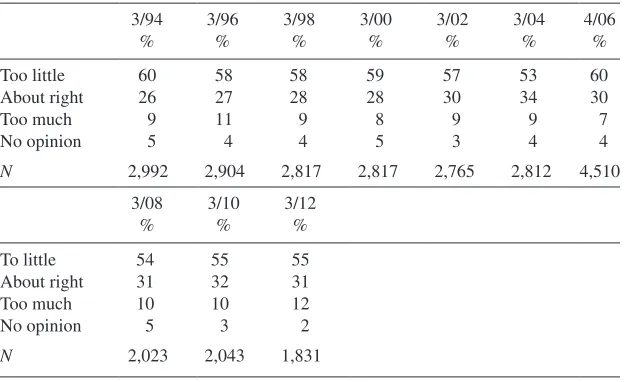
Table 14 shows that drug rehabilitation programs were also popular among
a large number of Americans. From 1994 to 2010, a majority supported drug
2. The preface to the question in Table 11 asks, “[W]hat do you think should be the penalty for murder” while the question in Table 12 asks, “[I]f you could choose between the following two approaches, which do you think is the better penalty for murder.” A cross-comparison of the data in 2000 shows similar responses across the variation in question wording.
Table 11. death Penalty or Prison with no Parole. GALLUP: “What do you think should be the penalty for murder—death or life imprisonment with absolutely no possibility for parole?”
1/85
Life imprisonment 34 35 35 37 29 32 29 36 38 42
Neither 4 0 3 1 1 3 4 5 0 0
No opinion 6 10 9 2 1 4 6 5 6 9
N 1,523 1,570 990 1,222 1,244 656 819 1,004 1,054 1,050
a”What do you think should be the penalty for murder—the death penalty, or life imprisonment
with absolutely no possibility of parole?”
at Jordan University of Science and Technology on July 26, 2016
http://poq.oxfordjournals.org/
rehabilitation programs, which is often an alternative to prisons for drug offenders. The best description of public support for such programs over time is stability. Fifty-two percent of respondents said the country is spending “too little” on drug rehabilitation in 1994. This figure remained essentially stable until 2008, when it dropped to 46 percent. Table 15 shows similar support for Table 12. death Penalty or Prison with no Parole. GALLUP: “If you could choose between the following two approaches, which do you think is the better penalty for murder—the death penalty, or life imprisonment with absolutely no possibility of parole?”
8/00
Life imprisonment 47 42 43 43 44 46 39 48 46
No opinion 4 4 5 5 3 4 5 5 2
N 1,012 1,016 1,012 1,012 1,005 1,000 1,005 1,013 1,010
10/10 %
9/11b
%
Death penalty 49 48
Life imprisonment 46 50
No opinion 6 2
N 1,025 1,010
aSurvey conducted by Gallup for USA Today.
bSurvey conducted by Opinion Research Corporation for the Cable News Network.
Table 13. Support for Alternatives to Punishment. GALLUP: “To lower the crime rate in the U.S., some people think additional money and effort should go to attacking the social and economic problems that lead to crime through better education and job training. Others feel more money and effort should go to deterring crime by improving law enforcement with more prisons, police, and judges. Which comes closer to your view?”
6/89
Attack social problems 61 57 67 51 63 57
Improve law enforcement 32 36 25 42 27 39
No opinion 7 2 1 7 5 4
N 1,235 1,031 1,387 1,011 1,012 1,015
a“Which of the following two approaches do you think would do more to reduce crime …
attacking the social and economic problems that lead to crime, through better education and job training, or deterring crime by improving law enforcement with more prisons, police, and judges?”
at Jordan University of Science and Technology on July 26, 2016
http://poq.oxfordjournals.org/
drug addiction programs. Support for spending more to reduce drug addiction started at 60 percent in 1994 and slowly dropped to 55 percent by 2012. The percentage of respondents who believed we are spending “too much” on drug addiction programs remained stable from 1994 to 2012.
Table 14. Support for drug rehabilitation. GSS: “Are we spending too much, too little, or about the right amount on drug rehabilitation?”
3/94
N 2,992 2,832 2,817 2,765 2,812 4,510 2,023
3/10 %
3/12 %
To little 48 45
About right 33 36
Too much 12 17
No opinion 7 2
N 2,043 1,789
Table 15. Support for drug Addiction. GSS: “Are we spending too much, too little, or about the right amount on drug addiction?”
3/94
N 2,992 2,904 2,817 2,817 2,765 2,812 4,510
3/08
About right 31 32 31
Too much 10 10 12
No opinion 5 3 2
N 2,023 2,043 1,831
at Jordan University of Science and Technology on July 26, 2016
http://poq.oxfordjournals.org/
Spending to Fight Crime
The decreasing punitiveness is also shown in public preferences toward spend-ing to fight crime. Table 16 shows that 75 percent of respondents believed the nation was spending “too little” money on “halting the rising crime rate” in 1994. By 2002, this figure had declined 18 percentage points. Disaggregating this change shows that support for spending declined among men (21 per-centage points), women (18 perper-centage points), blacks (14 perper-centage points), whites (21 percentage points), Republicans (20 percentage points), Democrats (18 percentage points), respondents between 18 and 29 years of age (36 per-centage points), and respondents over the age of 65 (21 perper-centage points).
Public support for greater spending for “law enforcement” also declined between 1994 and 2012. Table 17 shows that 63 percent of respondents believed spending for law enforcement was “too little” in 1994. That figure dropped 16 percentage points by 2002 and remained around 53 percent from 2004 to 2008. It declined to 49 percent by 2012.
Satisfaction with Crime Policies and Authorities
Although conventional wisdom places issue ownership of crime with the Republican Party (Beckett 1997), the polls show no clear party having
Table 16. Spending to Halt Crime. GSS: “We are faced with many
problems in this country, none of which can be solved easily or inexpensively. I’m going to name some of these problems, and for each one I’d like you to tell me whether you think we’re spending too much money on it, too little money, or about the right amount.…Halting the rising crime rate?”
3/94 %
3/96 %
3/98 %
3/00 %
3/02 %
3/04 %
3/06 %
4/08 %
Too little 75 67 61 59 56 56 60 59
About right 16 23 29 32 35 36 32 30
Too much 6 7 7 5 7 5 7 7
Don’t know 3 3 3 3 3 3 2 4
N 2,992 2,904 2,832 2,817 2,765 2,812 4,510 2,023
3/10 %
3/12 %
Too little 58 59
About right 31 33
Too much 8 7
Don’t know 3 1
N 2,043 975
at Jordan University of Science and Technology on July 26, 2016
http://poq.oxfordjournals.org/
Table 17. Spending on law Enforcement. GSS: “We are faced with many problems in this country, none of which can be solved easily or inexpensively. I’m going to name some of these problems, and for each one I’d like you to tell me whether you think we’re spending too much money on it, too little money, or about the right amount. Are we spending too much, too little, or about the right amount on . . . law enforcement?”
3/94
N 2,992 2,904 2,832 2,817 2,765 2,812 4,510 2,023 2,043
3/12
an advantage on the issue since 1994. Table 18 shows that the majority of respondents (52 percent) viewed both parties as equal in dealing with crime in 1994 (per the NBC/WSJ poll), but this percentage declined to 21 percent in 1996 before it increased to 38 percent in 1998. The Pew surveys show a smaller number of respondents viewing both parties as equal on crime relative to the NBC/WSJ polls. In March 1998, 11 percent of respondents viewed both parties as equal, which declined to 9 percent by October 2006. Since 1994, roughly equal percentages of the public favored one party over the other. In some polls more respondents favored the Democratic Party (i.e., 1998, 2002), while in other polls more respondents favored the Republican Party (i.e., 1994, 1995, 1997, 2006).
Table 19 shows public satisfaction with national crime policies from 2001 to
2013. A small but stable percentage of respondents were “very satisfied” with national policies to reduce crime. This percentage never rose above 11 percent during this period. Almost twice as many respondents were “very dissatisfied” with crime policies, although this number decreased seven percentage points from 2001 to 2002. Dissatisfaction peaked by 2013, with 24 percent of the public saying they were “very dissatisfied.”
Finally, table 20 shows satisfaction with law enforcement authorities. The poll specifically asks respondents how much confidence they have in their local
at Jordan University of Science and Technology on July 26, 2016
http://poq.oxfordjournals.org/
would do a better job—the Democratic Party, the Republican Party, both about the same, or neither?”
NBC/WSJ NBC/WSJ NBC/WSJ NBC/WSJ NBC/WSJ NBC/WSJ
5/94 %
6/94 %
10/94 %
11/94 %
6/95 %
12/95 %
Democratic Party 9 18 23 14 17 20
Republican Party 20 26 28 25 32 27
About the same 52 33 21 34 25 27
Neither 15 19 12 19 20 20
Not sure 4 4 7 8 6 6
N 1,002 1,005 1,509 802 1,008 2,007
NBC/WSJ NBC/WSJ NBC/WSJ Pew Pew NBC/WSJ
5/96 10/96 9/97 3/98 8/98 10/98
% % % % % %
Democratic Party 21 30 21 35 39 19
Republican Party 31 28 27 34 32 27
About the same 25 21 29 11 10 38
Neither 16 13 16 10 7 10
Not sure 7 8 7 10 12 6
N 1,001 1,008 2,004 1,206 2,226 1,025
Continued Ramirez
6/99 12/99 9/02 2/06 9/06 10/06a
% % % % % %
Democratic Party 35 22 35 37 32 29
Republican Party 35 26 26 30 34 33
About the same 12 33 14 8 8 9
Neither 6 14 10 10 10 9
Not sure 12 5 15 15 16 20
N 1,153 2,014 1,919 1,502 1,507 2,006
The NBC/WSJ samples consist of telephone interviews of adults in the United States conducted by Hart and Teeter Research Companies. The Pew samples consist of telephone interviews of adults in the United States conducted by Princeton Survey Research.
aSample contains oversample of 515 respondents in competitive U.S. House elections.
iews on Crime and Punishment
1021
police. In 1998, 26 percent of respondents had “a great deal” of confidence in their local police. This figure dropped to 18 percent by 2000 before it climbed back to 34 percent by 2001 following the terrorist attacks on 9/11 (see also Shaw and Brannan [2009]). Confidence in the police remained largely stable from 2002 to 2012, suggesting that changing views toward the police are not tightly connected to the public’s changing attitudes toward punishment of criminals.
Conclusion
A majority of Americans support punitive criminal justice policies. However, Americans today are less supportive of punitive policies than they were in the midst of the “law and order” era between 1970 and 1994. This decline in sup-port for punitive policies is consistent across specific punitive policies (e.g., death penalty, sentencing, spending) and across various subgroups (see also Ramirez [2013]). This is a substantial change from the past, when punitive policies appeared to be the dominant approach to crime.
These data also show a decreased perception of national crime since the mid-1990s. Perceptions of crime, however, do not follow the same pattern as support Table 19. Satisfaction with national Criminal Justice Policy. GALLUP: “We’d like to know how you feel about the state of the nation in each of the following areas. For each one, please say whether you are very satisfied, somewhat satisfied, somewhat dissatisfied, or very dissatisfied. If you don’t have enough information about a particular subject to rate it, just say so. How about the nation’s policies to reduce or control crime?”
1/01 %
1/02 %
1/03 %
1/04 %
1/05 %
1/06 %
Very satisfied 6 10 8 10 11 8
Somewhat satisfied 39 44 43 43 46 40
Somewhat dissatisfied 32 30 28 28 23 29
Very dissatisfied 20 13 18 16 16 18
No opinion 3 3 3 3 4 5
N 1,004 1,015 1,000 1,004 1,005 1,003
1/07 %
1/08 %
1/12 %
1/13 %
Very satisfied 9 7 7 8
Somewhat satisfied 38 41 43 33
Somewhat dissatisfied 31 30 25 30
Very dissatisfied 18 18 20 24
No opinion 4 4 6 5
N 1,018 1,023 1,011 1,011
at Jordan University of Science and Technology on July 26, 2016
http://poq.oxfordjournals.org/
for specific punitive policies. Thus, perceptions of crime cannot be uniquely responsible for the shifts in punitiveness. Instead, support for punitive policies has increased after instances of terrorism rather than periods of high crime.
Appendices
Abbreviations
CBS: Columbia Broadcasting Network; Gallup: Gallup Organization;
GSS: National Opinion Research Center, General Social Survey; GWU-Battleground, George Washington University Battleground Poll; HART: Hart and Teeter Research Companies;
NBC: National Broadcasting Company; NYT: New York Times;
PEW: Pew Research Center; Roper: Roper Organization; WSJ: Wall Street Journal
The survey results reported here were obtained from searches of the iPOLL Databank and other resources provided by the Roper Center for Public Table 20. Confidence in the Police. GALLUP: “I am going to read you a list of institutions in American society. Please tell me how much confidence you, yourself, have in each one—a great deal, quite a lot, some, or very little?...The police?”
N 1,003 1,016 1,021 1,010 1,020 1,029 1,002 1,004
6/06
N 1,002 1,007 822 1,011 1,020 1,020 1,004
at Jordan University of Science and Technology on July 26, 2016
http://poq.oxfordjournals.org/
Opinion Research, University of Connecticut. Unless otherwise noted in the table notes, all Gallup surveys between 1994 and 2007 involved national adult samples and were conducted via telephone with households selected by ran-dom-digit-dialing. All Gallup surveys from 2008 onward involved national adult samples and were conducted via landline and cell phone selected by random-digit-dialing. Unless otherwise noted in the table notes, all General Social Surveys involved national adult samples and were conducted by face-to-face interviews. Response rates are as follows (when available):
CBS and CBS/NYT: 8/2001, 15.6%; 4/2005, 17.11%; 7/2005, 13.95% (AAPOR RR1; response rates for surveys prior to 2001 were unavailable) GSS: 1994, 77.8%; 1996, 76.1%; 1998, 75.6%; 2000, 70.0%; 2002, 70.1%; 2004, 70.4%; 2006, 71.2%; 2008, 70.4%; 2010, 70.3%; 2012, 71.4% (AAPOR RR3)
PEW: 9/2006, 27%; 10/2006, 26% (AAPOR RR5; response rates were una-vailable for surveys prior to 2006)
Response rates were requested from but not provided by Peter Hart Research (including Hart and Teeter Research Companies), Gallup Organization, and the National Broadcasting Company/Wall Street Journal.
disaggregation of GSS data
This appendix contains tables that disaggregate the General Social Survey (GSS) data on public support toward judicial sentencing, the death penalty, and spending on crime. Unfortunately, the data file necessary to perform a subgroup analysis is not available from the Roper Center, iPoll, or the survey organiza-tion for many of the survey marginals listed in the manuscript. The GSS, how-ever, does provide a data file that allowed the disaggregation of poll questions by various subgroups. This analysis examined gender, race, age, and partisan affiliation, since past research highlights important differences in punitive atti-tudes across these constituencies. The subgroup survey marginals are shown in
table A1 for spending to halt crime, table A2 for support for the death penalty,
and table A3 for support for tougher judicial sentencing. Consistent with past
research on the over-time movement in policy opinions of various subgroups (i.e., Page and Shapiro 1992), these data show that the decline in support for punitive policies was consistent across men, women, blacks, whites, the young, the old, Republicans, and Democrats. Thus, the aggregate marginals in the text are largely consistent with the subgroup analysis.
Appendix table notes: REP indicates a strong or moderate affiliation with the Republican Party. DEM indicates a strong or moderate affiliation with the Democratic Party. Independents and independents that lean toward a party were excluded from these tables. 18–29 indicates respondents between the ages of 18 and 29; 65+ indicates respondents 65 years of age or greater. These data are derived from the GSS Cumulative Data file (citation in text).
at Jordan University of Science and Technology on July 26, 2016
http://poq.oxfordjournals.org/
Table A1. Spending to Halt Crime across Groups. GSS: “We are faced with many problems in this country, none of which can be solved easily or inexpensively. I’m going to name some of these problems, and for each oneI’d like you to tell me whether you think we’re spending too much money on it, too little money, or about the right amount.…Halting the rising crime rate?”
Men Men Men Men Men Women Women Women Women Women
3/94 3/96 3/98 3/00 3/02 3/94 3/96 3/98 3/00 3/02
% % % % % % % % % %
Too little 74 65 58 56 51 80 73 67 65 62
About right 19 26 32 37 39 14 22 28 31 33
Too much 7 8 10 7 10 6 6 5 4 5
N 646 620 572 604 589 819 772 758 753 732
White White White White White Black Black Black Black Black
3/94 3/96 3/98 3/00 3/02 3/94 3/96 3/98 3/00 3/02
% % % % % % % % % %
Too little 76 67 61 59 55 83 82 78 74 69
About right 17 25 31 25 37 14 14 17 22 27
Too much 7 8 8 6 7 3 4 5 4 4
N 1,215 1,111 1,054 1,080 1,058 190 201 177 199 186
Continued
iews on Crime and Punishment
1025
18–29 18–29 18–29 18–29 18–29 65+ 65+ 65+ 65+ 65+
3/94 3/96 3/98 3/00 3/02 3/94 3/96 3/98 3/00 3/02
% % % % % % % % % %
Too little 86 72 64 61 50 78 70 63 62 57
About right 11 24 32 36 45 12 23 30 33 36
Too much 3 4 4 3 5 10 6 7 5 7
N 229 248 236 223 239 239 1,180 1,106 1,126 1,096
REP REP REP REP REP DEM DEM DEM DEM DEM
3/94 3/96 3/98 3/00 3/02 3/94 3/96 3/98 3/00 3/02
% % % % % % % % % %
Too little 72 65 57 60 52 80 71 71 63 62
About right 19 25 35 32 40 15 25 23 32 32
Too much 9 10 8 7 8 5 4 7 5 6
N 424 396 349 324 366 538 455 431 440 444
Table A1. Continued
Ramirez
Table A2. death Penalty Support across Groups. GSS: “Do you favor or oppose the death penalty for persons convicted of murder?”
Men Men Men Men Men Women Women Women Women Women
3/94 3/96 3/98 3/00 3/02 3/94 3/96 3/98 3/00 3/02
% % % % % % % % % %
Favor 82 82 79 75 75 76 72 69 63 63
Oppose 17 18 21 25 25 23 28 31 37 37
N 1,229 1,223 1,154 1,149 631 1,556 1,457 1,445 1,416 677
White White White White White Black Black Black Black Black
3/94 3/96 3/98 3/00 3/02 3/94 3/96 3/98 3/00 3/02
% % % % % % % % % %
Favor 83 80 78 74 73 57 58 50 42 45
Oppose 17 20 22 26 27 43 42 50 58 55
N 2,338 2,189 2,065 2,025 1,051 346 351 359 381 183
Continued
iews on Crime and Punishment
1027
18–29 18–29 18–29 18–29 18–29 65+ 65+ 65+ 65+ 65+
3/94 3/96 3/98 3/00 3/02 3/94 3/96 3/98 3/00 3/02
% % % % % % % % % %
Favor 77 77 71 68 67 82 77 74 69 69
Oppose 23 23 29 32 33 18 23 26 31 31
N 436 497 454 439 245 456 2,279 2,167 2,139 1,067
REP REP REP REP REP DEM DEM DEM DEM DEM
3/94 3/96 3/98 3/00 3/02 3/94 3/96 3/98 3/00 3/02
% % % % % % % % % %
Favor 87 88 82 80 82 70 67 67 63 58
Oppose 13 12 18 20 18 30 33 33 37 42
N 803 773 677 634 345 988 891 893 829 449
Table A2. Continued
Ramirez
Table A3. Judicial Sentencing across Groups. GSS: “In general, do you think that the courts in this area deal too harshly or not harshly enough with criminals?”
Men Men Men Men Men Women Women Women Women Women
3/94 3/96 3/98 3/00 3/02 3/94 3/96 3/98 3/00 3/02
% % % % % % % % % %
Not harsh 87 82 76 72 67 91 84 82 77 75
About right 10 12 16 19 20 7 11 12 15 17
Too harsh 3 6 8 9 12 2 4 6 7 7
N 1,219 1,203 1,115 1,137 620 1,619 1,488 1,487 1,421 665
White White White White White Black Black Black Black Black
3/94 3/96 3/98 3/00 3/02 3/94 3/96 3/98 3/00 3/02
% % % % % % % % % %
Not harsh 90 85 80 76 73 85 78 74 69 66
About right 8 12 14 18 19 9 10 10 14 16
Too harsh 2 3 5 6 8 6 13 15 17 17
N 2,360 2,182 2,075 2,007 1,033 364 369 389 398 182
Continued
iews on Crime and Punishment
1029
18–29 18–29 18–29 18–29 18–29 65+ 65+ 65+ 65+ 65+
3/94 3/96 3/98 3/00 3/02 3/94 3/96 3/98 3/00 3/02
% % % % % % % % % %
Not harsh 85 83 77 72 69 92 83 80 75 72
About right 10 10 12 16 18 7 11 13 16 18
Too harsh 5 7 11 12 13 1 5 7 9 10
N 429 485 439 414 235 474 2,283 2,195 2,121 1,047
REP REP REP REP REP DEM DEM DEM DEM DEM
3/94 3/96 3/98 3/00 3/02 3/94 3/96 3/98 3/00 3/02
% % % % % % % % % %
Not harsh 91 86 85 83 79 89 80 79 71 69
About right 7 10 12 13 19 8 14 14 19 19
Too harsh 2 4 3 4 2 3 6 7 10 12
N 809 783 686 635 348 1,018 907 910 848 434
Table A3. Continued
Ramirez
references
Aladjem, Terry K. 2008. The Culture of Vengeance and the Fate of American Justice. New York:
Cambridge University Press.
Beckett, Katherine. 1997. Making Crime Pay. New York: Oxford University Press.
Edsall, Thomas Byrne, and Mary D. Edsall. 1992. Chain Reaction. New York: W. W. Norton.
Erskine, Hazel. 1970. “The Polls: Capital Punishment.” Public Opinion Quarterly 34:290–307.
———. 1974. “The Polls: Politics and Law and Order.” Public Opinion Quarterly 38:623–34.
Forst, Brian. 2009. Terrorism, Crime, and Public Policy. New York: Cambridge University Press.
Forst, Brian, Jack R. Green, and James P. Lynch. 2011. Criminologists on Terrorism and
Homeland Security. New York: Cambridge University Press.
Glaze, Lauren E., and Erika Parks. 2012. “Correctional Populations in the United States.” Bureau of Justice Statistics. Office of Justice Programs. U.S. Department of Justice, NCJ239672.
Gottschalk, Marie. 2006. The Prison and the Gallows: The Politics of Mass Incarceration in
America. New York: Cambridge University Press.
Marion, Nancy E., Colleen M. Smith, and Willard M. Oliver. 2009. “Gubernatorial Crime Control
Rhetoric: A Study in Symbolic Politics.” Criminal Justice Policy Review 20:457–74.
Posner, Richard A. 2008. How Judges Think. Cambridge, MA: Harvard University Press.
Ramirez, Mark D. 2013. “Punitive Sentiment.” Criminology 51:329–64.
Shaw, Greg M., and Kathryn E. Brannan. 2009. “The Polls—Trends: Confidence in Law
Enforcement.” Public Opinion Quarterly 73:199–220.
Shaw, Greg M., Robert Y. Shapiro, Shmuel Lock, and Lawrence R. Jacobs. 1998. “The Polls—
Trends: Crime, the Police, and Civil Liberties.” Public Opinion Quarterly 62:405–26.
Smith, Tom W., Peter Marsden, Michael Hout, and Jibum Kim. 2013. General Social Survey,
1972–2012 [machine-readable data file]. Chicago: National Opinion Research Center [pro-ducer]. Storrs, CT: Roper Center for Public Opinion Research, University of Connecticut [distributor].
Steiker, Jordan M. 2013. “The American Death Penalty: Constitutional Regulation as the
Distinctive Feature of American Exceptionalism.” University of Miami Law Review 67:329–56.
Tonry, Michael. 1995. Malign Neglect—Race, Crime, and Punishment in America. New York:
Oxford University Press.
Tyler, Tom R., and Robert J. Boeckmann. 1997. “Three Strikes and You Are Out, But Why? The
Psychology of Public Support for Punishing Rule Breakers.” Law & Society Review 31:237–65.
Warr, Mark. 1995. “The Polls—Trends: Public Opinion on Crime and Punishment.” Public
Opinion Quarterly 59:296–310.
at Jordan University of Science and Technology on July 26, 2016
http://poq.oxfordjournals.org/