THE EFFECT OF THE WINDOW-TO-WALL RATIO
ON COOLING ENERGY USAGE AND COMFORT TEMPERATURE
Aris Budhiyanto
Department of Architecture, Petra Christian University Jalan Siwalankerto no. 121-131, Surabaya, Indonesia
E-mail: [email protected]
ABSTRACT
This study presents an investigation of the effect of building envelope, especially glass facade buildings on cooling energy usage and thermal comfort. An office building was modeled with various window-to-wall ratio (WWR) using panasap glass with SC=0.58 in order to analyze the effect of the WWR addition on cooling energy usage and comfort temperature. The result suggested that the average increase of the cooling energy usage is about 5.67% per 10% WWR addition, and of the operative temperature ranges from 0.350C to 0.560C per 10% WWR addition. Moreover, the building
with above 20% WWR doesn’t provide comfort temperature.
Keywords: Building envelope; window-to-wall ratio; cooling energy; operative temperature; comfort temperature.
INTRODUCTION
Increasing numbers of offices and public buildings in Indonesia that have designed with large areas of glass facade for aesthetic appearance in recent years brings consequence in the energy usage for cooling (Mintorogo, 2006). The energy consumed for cooling increases as the intensity of solar heat radiation received by the building envelope increase (Santoso & Antaryama, 2005). Mirrahimi et al. (2016) indicated that 73% of the total heat gain loss was contributed by the building envelope.
Building envelope, consisted of the opaque and the transparent materials, serves as the physical separator between the interior of a building and the exterior environment so as to maintain the indoor thermal comfort (Koo, Park, Hong & Park, 2014). In the investigated building with a large glass windows, the thermal comfort was not only affected by long-wave radiation from isothermal surfaces but also by beam and diffuses solar radiation falling on the human body radiated through the glass windows (Hwang & Shu, 2011). The research that conducted by Dahlan et al. (2011) indicated the outdoor condition directly influenced the indoor thermal conditions recorded in measured hostel rooms. High operative temperatures (from 290C to 300C) recorded among the three hostels are often present in Malaysia due to high mean outdoor temperature. In seven different cities in USA, Ma et al. (2015) showed that the mean values of operative temperature vary a lot when the U-value of window material and the WWR (window to wall area ratio) were changed.
Thermal comfort is a neutral thermal sensation which is the feeling of neither slightly warm nor
slightly cool. It is affected by a combination of factors, including metabolic rate, clothing, air temperature, air temperature stratification, radiant temperature, radiant temperature asymmetry, relative humidity, air speed, and turbulent intensity in the occupied zone (Chow, Fong, Givoni, Lin & Chan, 2010). The temperature, as one of parameters of thermal comfort is considered: Tair—air temperature (dry-bulb temperature), Tsurf—surface temperature, Tmrt—mean radiant temperature (MRT), dan Tres— resultant temperature/ operative temperature. The interrelations between these temperatures with coefficients describing heat exchange are presented in figure 1.
Fig. 1. Interrelations between temperatures (Source: Janicki & Heim, 2013)
the calculation of the MRT is based on the radiant heat exchange between all radiating surfaces and the human body. In this case, all radiating surfaces are walls, floor and ceiling that separate the inside of the building with the environment outside. When the building envelope receives solar radiation, it storages the heat energy that makes its surface temperature increases. Furthermore, it radiates the heat energy into the interior room, resulting in the increasing of MRT. As the MRT increases, the air temperature must decrease in order to maintain the equal comfort. The more air temperature decreases, the more cooling energy is needed (Halawa & Soebarto, 2014; Janicki & Heim, 2013).
As the average air temperature and radiant temperature, the operative temperature is one of the factors that influence comfort (Eder & Bednar, 2015). The operative temperature changes following the surface temperature of building envelope and the mean radiant temperature. Despite the temperature of air-conditioning system, the operative temperature is considered an effective temperature in an occupied space with air velocity less than 0.4 m/s; and the ‘neutral temperature’ is defined as the operative temperature which corresponds closest to a mean thermal sensation vote of zero (Mui & Fong, 2010).
Since interior heat gain obtained throughout the configuration of the envelope, including the conduction processes, convective processes on inside and outside surfaces of the envelope, and radiative processes; the first architectural step of designing a comfortable interior is focusing on the indoor operative temperature range as the design constraint (Wang et al., 2014). The objective of this paper is to develop an understanding of the linkage between the design of building envelopes and the comfort temperature as well as the cooling energy usage. A model of office building in different WWR is simulated using the weather file of Jakarta to demonstrate the effect of the glass façade toward cooling energy usage and indoor thermal comfort.
METHOD
This study used simulation method. A model of a typical office building, with a square floor plan and facades facing the four main orientations, was set up within EnergyPlus simulation software (version 8.4). EnergyPlus is building energy simulation software developed by the United States Department of Energy (Crawley, Lawrie, Winkelmann & Pedersen, 2001). It has capability to simulate cooling/heating loads, daylighting and photovoltaic systems with repeated accurate results which had been validated through
analytical, comparative and empirical tests (Pereira, Bögl & Natschläger, 2014). An illustration of the research methodology for this paper is shown in fig. 2.
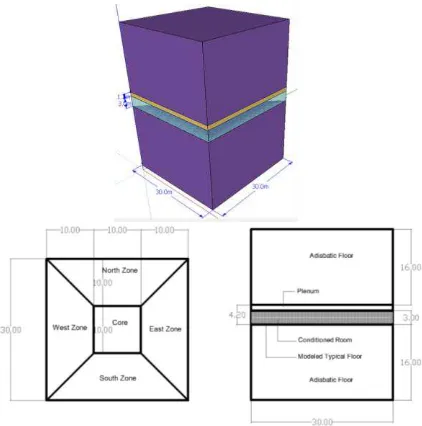
Fig. 2. The building model geometry (left), the plan view of the model (middle), and the section of the model (right)
A standard floor of office building (L-30 m × B-30 m × H floor to floor-4.2 m and 3 m from floor to ceiling) was modeled and divided into five zones, consisting of four perimeter zones that facing four orientations, and a core zone. A square plan model was selected in order to get the four perimeter zones that had the same floor area as well as façade area. The depth of each zone was about 10 m in order to avoid the domination of external heat gain as well as internal heat gain. The higher of the depth of the zone, the higher of domination of internal heat gain, while the lower of the depth of the zone, the higher of domination of external heat gain (Saud, 2012). To prevent heat transfer in between the zones, they were separated by internal walls which were deemed adiabatic, so that each perimeter zone can be analyzed accurately (Ng, Mithraratne & Wei Kua, 2013)
back panel, the maximum WWR that could be achieved was 70% WWR. Therefore, the building was simulated in various WWR, starting from 10% to 70%.
The internal heat gain of the building was designed following the National Standard of Indonesia (SNI) which is the occupancy was 0.1 person/m2, the lighting load was 12 W/m2, and the equipment load was 10 W/m2, while the cooling set point of air-conditioning was 250C. The average window inside face surface temperature, MRT and operative temperature would be analyzed within a year in each different oriented-facing zone. Not only the temperatures, but also the cooling energy consumption a year would be analyzed.
RESULT AND DISCUSSION
The impact of WWR to the Cooling Energy Consumption
Despite the SC of panasap glass is about 0.58 and it can reduce the cooling load inside the building, its characteristic that absorbs the solar radiation brings the window surface temperature higher than clear glass with higher SC. The temperature of the inside (room-side) face of the inside glass layer is called window inside face surface temperature. The higher window inside face surface temperature is, the higher window radiates heat energy into the building and the higher MRT is. As it affects the MRT and MRT affects the cooling energy consumption, the analysis begins from the surface temperature. In this case, it focuses on window inside face surface temperature since it is the inside face temperature that radiates heat into the room (Winkelmann, 2001).
34
Window Inside Face Surface Temperature
North
East
South
West
Fig. 3. Window inside face surface temperature
As the area of transparent building envelope increases, the window inside face surface temperature increases too (figure 3). The highest window inside face surface temperature is obtained at the west façade. It is about 39.620C at the 10% WWR model, 41.660C at the 50% WWR model, and 42.40C at the
70% WWR model. The average increase of window inside face surface temperature per 10% WWR addition is about 0.460C at the west façade, 0.360C at the north façade, 0.430C at the east façade and 0.30C at the south façade.
Figure 4 shows the MRT of the model with various WWR. The MRT of the model without glass window ranges from 290C to 29.320C and it tends to increase as the WWR added. In the 70% WWR model, the highest MRT measured is the MRT of the west-facing zone, which is 37.090C and the lowest one is the MRT of the south-facing zone, which is 33.840C. The average increase of MRT per 10% WWR is about 1.120C in the west-facing zone, 0.880C in the north-facing zone, 1.030C in the east-facing zone and 0.70C in the south-facing zone.
29
Fig. 5. The cooling energy consumption of the model with various WWR
The increase of MRT affects to the increase of cooling energy consumption. Figure 5 shows the cooling energy consumption of the model with various WWR while figure 6 shows its percentage increase. The cooling energy consumption of the model without glass façade is 46.04 kWh/m2.yr and it increases 10% when the 10% WWR is presented. Then it increases about 4% to 8% per 10% WWR addition up to the 60% WWR model. Yet, when its WWR is 70%, the increase of the cooling energy is 44.92%, only 2% different from the 60% WWR model. In average, it increases about 5.67% per 10% WWR addition.
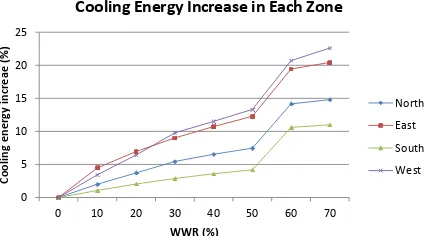
Furthermore, the cooling energy consumption in each zone is presented in figure 7 and its percentage increase in figure 8. When a 30% WWR presented, the increase of cooling energy usage is under 10% in every zone. However, it is above 10% when the WWR presented is above 30% in the west and east-facing zones, and is above 60% in the north and south-facing zones. It is obvious that the orientation of the building affecting the cooling energy. In west-facing zone, the cooling energy consumption is highest than in the other zones, while the south-facing zone provides the least cooling energy consumption. In the 70% WWR model, the cooling energy increase of the west-facing zone is 22.59% from the model
Cooling Energy in Each Zone
North
East
South
West
Fig. 7. The cooling energy consumption of the model with various WWR in each zone
0
Cooling Energy Increase in Each Zone
North
East
South
West
Fig. 8. The percentage of cooling energy consumption increase of the model with various WWR in each zone
The Impact of WWR to the Comfort Temperature
Fig. 9. The operative temperature of the model with various WWR
Since the air temperature is set 250C in a conditioned room, the MRT mainly affects the operative temperature in the building. As the MRT increasing following the WWR increase, the operative temperature tends to increase too. Figure 9 shows the operative temperature of the model with the operative temperature above 280C causes thermal discomfort to the occupants of the building. Therefore, the models with above 20% WWR don’t meet its comfort temperature, while in the 20% WWR model only south-facing zone provides a neutral temperature.
CONCLUSION
33.47% when the 50% WWR is presented, and about 44.91% when the 70% WWR is presented. In addition, the building with above 20% WWR and the same window material doesn’t provide the comfort temperature.
REFERENCES
Chow, T.T., Fong, K.F., Givoni, B., Lin, Z. & Chan, A.L.S. (2010). Thermal sensation of Hong Kong people with increased air speed, temperature and humidity in air-conditioned environment.
Build-ing and Environment, 45(10), pp.2177–2183.
http://doi.org/10.1016/j.buildenv.2010.03.016 Crawley, D.B., Lawrie, L.K., Winkelmann, F.C. &
Pedersen, C.O. (2001). EnergyPlus: New Capa-bilities in a Whole-Building Energy Simulation Program. Building Simulation 2001, pp.51–58. Retrieved from http://www.ibpsa.org/procee-dings/BS2001/BS01_0051_58.pdf\nhttp://www. ibpsa.org/?page_id=122
Dahlan, N.D., Jones, P.J. & Alexander, D.K. (2011). Operative temperature and thermal sensation assessments in non-air-conditioned multi-storey hostels in Malaysia. Building and Environment, 46(2), pp.457–467. http://doi.org/10.1016/ j.buildenv.2010.08.007
Dinapradipta, A. (2015). Office building facades for functionality and adaptability in humid tropical
cities : multi-case studies of office buildings in
Jakarta-Indonesia. Technische Universiteit
Eindhoven General, Eindhoven.
Eder, K. & Bednar, T. (2015). Effect of facade sys-tems on the performance of cooling ceilings: In situ measurements. Frontiers of Architectural
Research, 4(1), pp.68–78. http://doi.org/10.1016/
j.foar.2014.11.003.
Halawa, E., van Hoof, J. & Soebarto, V. (2014). The impacts of the thermal radiation field on thermal comfort, energy consumption and control—A critical overview. Renewable and Sustainable
Energy Reviews, 37, pp.907–918. http://doi.org/
10.1016/j.rser.2014.05.040.
Hwang, R.L. & Shu, S.Y. (2011). Building envelope regulations on thermal comfort in glass facade buildings and energy-saving potential for PMV-based comfort control. Building and Environ-ment, 46(4), pp.824–834. http://doi.org/10.1016/ j.buildenv.2010.10.009.
Janicki, M. & Heim, D. (2013). Double criterion optimisation of transparent facades based on solar thermal processes. Frontiers of
Architec-tural Research, 2(1), pp.23–29. http://doi.org/
10.1016/j.foar.2012.11.005.
Karyono, T.H. (2015). Predicting Comfort Tempe-rature in Indonesia, an Initial Step to Reduce Cooling Energy Consumption. Buildings, 5, pp. 802–813. http://doi.org/10.3390/buildings5030 802.
Koo, C., Park, S., Hong, T. & Park, H.S. (2014). An estimation model for the heating and cooling demand of a residential building with a different envelope design using the finite element method.
Applied Energy, 114, pp.205–215. http://doi.
org/10.1016/j.apenergy.2014.12.051
Loekita, S. (2007). Analisis Konservasi Energi Melalui Selubung Bangunan. Civil Engineering
Dimension, 8(2), pp. 93–98.
Ma, P., Wang, L.S. & Guo, N. (2015). Maximum window-to-wall ratio of a thermally autonomous building as a function of envelope U-value and ambient temperature amplitude. Applied Energy, 146, pp.84–91. http://doi.org/10.1016/j.apener-gy.2015.01.103
Mintorogo, D.S. (2006). Unsustainable Building Façades and Fashions in Surabaya. DIMENSI
(Jurnal Teknik Arsitektur), 34(1), pp.67–72.
http://doi.org/10.9744/dimensi.34.1.pp.67-72 Mirrahimi, S., Mohamed, M. F., Haw, L. C., Ibrahim,
N. L.N., Yusoff, W.F.M. & Aflaki, A. (2016). The effect of building envelope on the thermal comfort and energy saving for high-rise buildings in hot–humid climate. Renewable and
Sustainable Energy Reviews, 53, pp.1508–1519.
http://doi.org/10.1016/j.rser.2015.09.055
Mui, K.W., Wong, L.T. & Fong, N.K. (2010). Optimization of indoor air temperature set-point for centralized air-conditioned spaces in sub-tropical climates. Automation in Construction, 19(6), pp.709–713. http://doi.org/10.1016/j.aut-con.2010.02.015.
Ng, P.K., Mithraratne, N. & Wei Kua, H. (2013). Energy analysis of semi-transparent BIPV in Singapore buildings. Energy & Buildings, 66, pp.274–281. http://doi.org/10.1016/j.enbuild. 2013.07.029
Pereira, W., Bögl, A. & Natschläger, T. (2014). Sen-sitivity analysis and validation of an EnergyPlus model of a house in Upper Austria. Energy
Procedia, 62, pp.472–481. http://doi.org/
10.1016/j.egypro.2014.12.409
Santoso, A.J. & Antaryama, I.G.N. (2005). Konse-kuensi Energi Akibat Pemakaian Bidang Kaca Pada Bangunan Tinggi Di Daerah Tropis Lem-bab. DIMENSI (Jurnal Teknik Arsitektur), 33(1), pp.70–75. http://doi.org/10.9744/dimensi. 33.1. Saud, M. I. (2012). Pengaruh Konfigurasi Window to
Orientasi Bangunan Terhadap Kinerja Termal Selubung Bangunan, Simulasi Bangunan Hipo-tetik Perkantoran Berlantai Banyak
Berdasar-kan Data Iklim Jakarta. Gadjah Mada
Univer-sity.
Wang, L.S., Ma, P., Hu, E., Giza-Sisson, D., Mueller, G. & Guo, N. (2014). A study of building envelope and thermal mass requirements for achieving thermal autonomy in an office building. Energy and Buildings, 78, pp.79–88. http://doi.org/10.1016/j.enbuild.2014.04.015.
Wibowo, A. P. (2014). Kaca Sebagai Elemen Passive Cooling System. In Prosiding Seminar Nasional Ke-9, Rekayasa Teknologi Industri dan Infor-masi 2014, Eco-Technology: Paradigma Pem-bangunan Masa Depan untuk Mendukung Masterplan Percepatan dan Perluasan
Pem-bangunan Ekonomi Indonesia (pp.83–89).
Yogyakarta: Sekolah Tinggi Teknologi Nasio-nal.
Winkelmann, F.C. (2001). Modeling Windows in EnergyPlus. In Seventh International IBPSA