Prediction of Increasing Production Activities using Combination
of Query Aggregation on Complex Events Processing and Neural
Network
Achmad ArwanTeknik Informatika – FILKOM Universitas Brawijaya, Malang
E-mail: [email protected]
Abstrak
Produksi, order, penjualan, dan pengiriman adalah serangkaian event yang saling terkait dalam industri manufaktur. Selanjutnya hasil dari event tersebut dicatat dalam event log. Complex Event Processing adalah metode yang digunakan untuk menganalisis apakah terdapat pola kombinasi peristiwa tertentu (peluang/ancaman) yang terjadi pada sebuah sistem, sehingga dapat ditangani secara cepat dan tepat. Jaringan saraf tiruan adalah metode yang digunakan untuk mengklasifikasi data peningkatan proses produksi. Hasil pencatatan rangkaian proses yang menyebabkan peningkatan produksi digunakan sebagai data latih untuk mendapatkan fungsi aktivasi dari jaringan saraf tiruan. Penjumlahan hasil catatan event log dimasukkan ke input jaringan saraf tiruan untuk perhitungan nilai aktivasi. Ketika nilai aktivasi lebih dari batas yang ditentukan, maka sistem mengeluarkan sinyal untuk meningkatkan produksi, jika tidak, sistem tetap memantau kejadian. Hasil percobaan menunjukkan bahwa akurasi dari metode ini adalah 77% dari 39 rangkaian aliran event.
Kata kunci: complex event processing, event, jaringan saraf tiruan, prediksi peningkatan produksi, proses.
Abstract
Productions, orders, sales, and shipments are series of interrelated events within manufacturing industry. Further these events were recorded in the event log. Complex event processing is a method that used to analyze whether there are patterns of combinations of certain events (opportunities / threats) that occur in a system, so it can be addressed quickly and appropriately. Artificial neural network is a method that we used to classify production increase activities. The series of events that cause the increase of the production used as a dataset to train the weight of neural network which result activation value. An aggregate stream of events inserted into the neural network input to compute the value of activation. When the value is over a certain threshold (the activation value results from training process), the system will issue a signal to increase production, otherwise system will keep monitor the events. Experiment result shows that the accuracy of this method is 77% for 39 series of event streams.
Keywords: complex event processing, event, neural networks, process, production increase prediction.
1.
Introduction
There are many processes in a manufacturing industry, ranging from scheduling, purchasing, productions to shipments. In common production systems, production scheduling is usually made by considering the trends of sales and production capacity. The trend of sales order is recapped daily, weekly or monthly. Problems arise when an increase in market demand come and go quickly. When demand increases, companies are still doing the analysis whether to increase production or not. It takes long time because the data (e.g. sales, purchases data, shipments, cancel order, production) need to be recapped, combined, and concluded to support the decision whether to increase production or not.. However, after companies has decided to increase their productions meanwhile market demand has decreased, so that the company suffered a loss as a result of the problem.
events occurs randomly. Therefore these events need to be aggregated to match the number of input on neural network.
There are several research in this field. Li et al applied neural decision tree to predict the petroleum productions (Li, Chan, & Nguyen, 2013). He compares several methods to predict the production of petroleums, and suggest to apply neural network model for predicting petroleum of production. Widder et al proposed a method that used to detect fraud of business on insurance by combining discriminant analysis and neural network (Widder, von Ammon, Schaeffer, & Wolff, 2008). He has several groups of fraud business events which used as data training. His dataset is also very limited which consist of 16 events (8 fraud and 8 no fraud) and 5 attributes of events (2 fraud relevant and 3 no-fraud relevant attributes). He also does not explain the accuracy of his method. Our research proposes how to predict increasing production by combines event aggregation on CEP and neural networks and measure the
The data are generated by external sources or other applications. The data are not controllable and unpredictable.
The amount of the data may be very large.
The data type of attributes can be well-structured, semi-structured, or unstructured. Some of the data items are error, corrupted or discarded due to network problems.
Data stream using a sliding window to process unlimited stream. Data on sliding window are always updated when the new event arises.
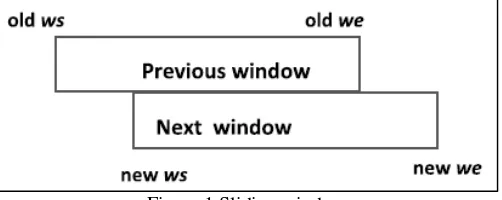
Figure 1 Sliding window
Figure 1 showed of sliding window. Sliding window is set of data which are captured from one time (ws/window started) to other time (we/window ended). Old ws means time when the old window have started, meanwhile old we means time when the old window have ended. New ws means time when the new window have started, meanwhile new we means time when the new window have ended. There are two windows. Previous window was the set of the captured data from old ws time to old we. Next window was the set of the captured data from new ws time to new we. Each of window must be aggregated to classify whether to increase production or not. Prediction is generated based on the data values on sliding window. By reading a combination of events data within sliding window, system should be able to predict what is special event that happening. The size of sliding window is matched to the number of single series of events data training.
This research proposed a methods how to predict production increase quickly by using event aggregation on CEP as input to neural networks. There are several methods to catch special events on CEP. In this paper, we used simple pattern matching which is done by comparing sequent of events within a sliding window with sequent of event from an experts (training data). We created an aggregate query whose order must be matched with training data. For example, when the training data had attribute sequence like productions, sales & cancel order, then we also aggregated and ordered the variables with the same sequence (productions, sales & cancel order) .
2.
Research Methodology
aggregated events (each of them has five input variables & one output variable). It is artificial, but modeled from a single product manufacture business. It is also considering many factors such as machine capacity, sales capacity (considers about safe stock), and amount of shipment or cancel order (consider on previous order). We have difficulties to get real data because we cannot find any business or theories about manufacture which are based on event. Most of the theories only explain how to plan production, sales and shipments. Based on the theory, finally we created artificial training data. Table 1 shows of our training data.
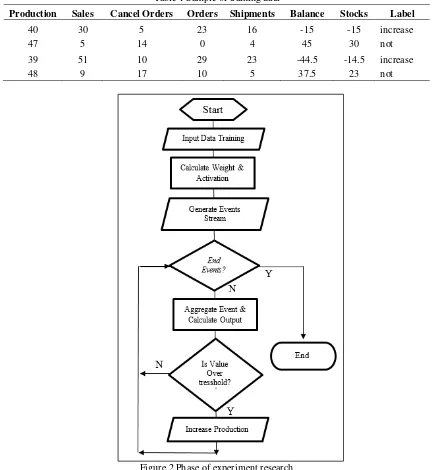
Table 1 Sample of training data
Production Sales Cancel Orders Orders Shipments Balance Stocks Label
40 30 5 23 16 -15 -15 increase
47 5 14 0 4 45 30 not
39 51 10 29 23 -44.5 -14.5 increase
48 9 17 10 5 37.5 23 not
Figure 2 Phase of experiment research
There are eight columns on our training data. Columns production to shipment describe number of values of each process. Column “Balance” describe a number of calculation of those five columns (production, sales, cancel orders, orders, shipping). Below is the equation of Balance.
𝐵𝑎𝑙𝑎𝑛𝑐𝑒 = 𝑃𝑟𝑜𝑑𝑢𝑐𝑡𝑖𝑜𝑛 − 𝑆𝑎𝑙𝑒𝑠 + (0.5 ∗ 𝐶𝑎𝑛𝑐𝑒𝑙 𝑂𝑟𝑑𝑒𝑟𝑠) − (0.5 ∗ 𝑂𝑟𝑑𝑒𝑟𝑠) − 𝑆ℎ𝑖𝑝𝑚𝑒𝑛𝑡𝑠 (1)
𝑆𝑡𝑜𝑐𝑘 = 𝐵𝑎𝑙𝑎𝑛𝑐𝑒 + 𝑆𝑡𝑜𝑐𝑘𝑛−1 (2)
The goal of this research is to predict production increase quickly by combining CEP and neural networks. To reach this, Figure 2 shows the methods that we used to accomplish the goal.
At the first phase, we input training data to calculate the best configuration of neural networks including the number of hidden layers, node and activation level using Neuroph Studio. Neuroph Studio is lightweight Java neural network framework to create a neural network architecture easily (Sevarac, 2012).
The second phase is a calculation process which is done by Neuroph studio. We tried to create a few configurations of neural network. Each configuration should be tested using training data. When the total mean square error is less equal than 0.01 the iteration (epoch) will stop. After several trials finally we got the best neural network configuration which is shown on Figure 3. Activation level is 0.1955 which mean if calculation result is more than this, the system will be alerted.
Figure 3 Phase of experimental research
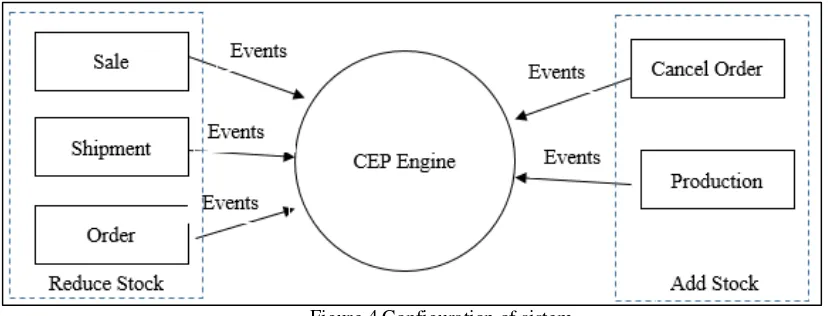
The third phase is creating an event stream. ESPER CEP engine is a software to create and monitor an event stream (Team & Inc, 2006). We used ESPER to create events stream randomly. It simulated process on manufacture company, which is shown on Figure 4.
Figure 4 Configuration of sistem
value is over the threshold or not. If it is over the threshold, system is giving alert to increase the production, otherwise system keep monitoring the events.
To evaluate this method we used accuracy comparison, below is the equation (Fawcett, 2006).
𝐴𝐶𝐶 =𝑇𝑃 + 𝐹𝑁 + 𝐹𝑃 + 𝑇𝑁 (3)𝑇𝑃 + 𝑇𝑁
TP (True Positives) mean that actual data are true and the system also predicted as true. While TN (True negatives) means the data are false and the system also predicted them as false, not the opposite. FP (False positive) means data actual are false but predicted as true. Meanwhile, FN (False negative) means the actual data are true but the system predicted them as false.
3.
Experiment Results
We splitted our experiment into two parts. The first experiment’s objective was to determine the best configuration of neural network, while the second to create synthetic events stream using ESPER. On the first experiment, we used Neuroph to create neural network. Several configuration have set, each set then trained using data training to find the weight and activation level. Iteration of training would stop after mean square error (MSE) reached less than equal 0.01. When output value of data training set to one, the iteration never stop (never reach MSE <=0.01), same result with 0.05. Table 2 shows process training of neural network.
Table 2 Configuration of Neural Network.
#Set #hiddenlayer /#Neuron MSE Threshold Accuracy
After several experiments, finally we found that the output value should be 0.1955 for true (increase production) and 0 for false (not increase production). MSE <= 0.01 reached after 500 iterations. Second part was created events stream using ESPER. We developed a simulation of event stream by using API ESPER for Java. Events has two attributes, name and value. Name contained the name of the events (production, sales, order, shipment, cancelled order). The value contained amount of events. Value of events generated randomly range 1-5 to simulate real event on merchant, factory, warehouse, etc. Further, we execute an aggregated query to sum value of events. Aggregate query (sum an event then group by name) executes every 10 millisecond as sliding window of the stream. When we set more than 10 milliseconds the result of aggregation would bigger than data training, while if less far from 10 milliseconds the result would smaller than data training. It would increase the error of prediction. Figure 5 shows the event generation using API ESPER for Java and increase productions prediction.
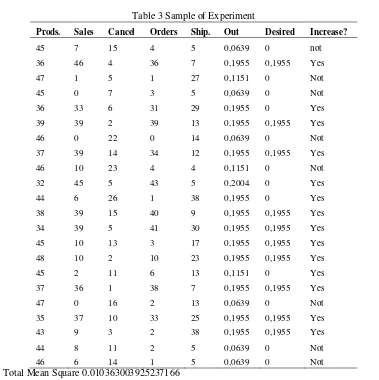
To simulate the system, we produce 4125 events (contain of combination sale, product, orders, shipment, cancel order). These events are then aggregated every 10 millisecond. To predict special event, we used the result of aggregated event as input on neural network. Later, neural network generated output number. If the output is less than 0.1955, it means that a special event has not happened and company should not increase the number of production. Otherwise, if output is equal or more than 0.1955, it means that a special event has happened and company must increase the number of productions. 39 aggregated events were used to check the accuracy of our method. Table 1 shows some of our experiments. To measure accuracy of our method we use accuracy calculation shown on Table 4.
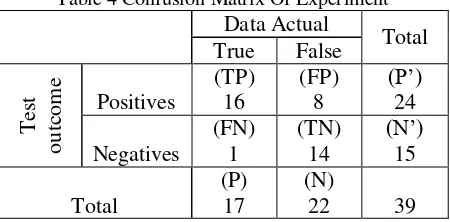
Table 4 Confusion Matrix Of Experiment
Table 4 shows a summary of experiment results. Accuracy of this method is
𝐴𝐶𝐶 =𝑇𝑃+𝑇𝑁𝑃+𝑁 =16+1417+22=3039= 0,77.
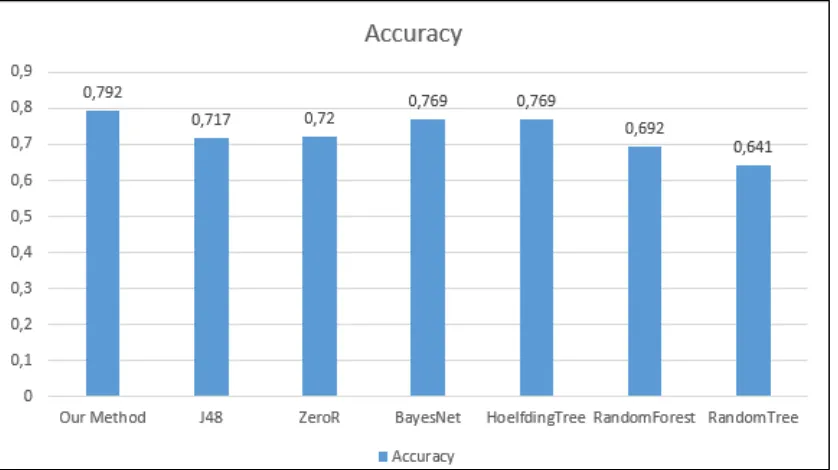
We are also doing some experiments with some other classifier methods like J48, Bayesnet, Hoefldingtree, Randomforest, Randomtree to compare with our method. We are also used WEKA (Hall, et al., 2009) as our tools to help us when we try to get comparison result against our method.
After several experiments using other methods, finally we have the results of tests. As we can see on Figure 5, our method reached highest value of accuracy among others. On the second rank are BayesNet and HoelfdingTree which both of them are reach similar results. Their results are about 0.76. On the third rank we have J48 and ZeroR which both of them are also get similar results. Their results are about 0.72. And the last position are RandomForest and RandomTree which both of them are only get accuracy less than 0.7.
4.
Conclusion dan Future Works
Figure 5 Results of Precision Comparison
5.
Referensi
Bishop, C. M. (1995). Neural networks for pattern recognition. New York: Oxford University Press. Chakravarthy, S., & Jiang, Q. (2009). Stream data processing: a quality of service perspective:
modeling, scheduling, load shedding, and complex event processing. New York: Springer Science & Business Media.
Fawcett, T. (2006). An introduction to ROC analysis. Pattern Recognition Letters, 27, 861–874. Hall, M., Frank, E., Holmes, G., Pfahringer, B., Reutemann, P., & Witten, I. H. (2009). The WEKA data
mining software: an update. Newsletter ACM SIGKDD Explorations Newsletter. 11, pp. 10-18. New York: ACM.
Li, X., Chan, C. W., & Nguyen, H. H. (2013). Application of the Neural Decision Tree approach for prediction of petroleum production. Journal of Petroleum Science and Engineering, 104, 11–16. Mendes, M. R., Bizarro, P., & Marques, P. (2009). A Performance Study of Event Processing Systems.
In Performance Evaluation and Benchmarking (pp. 221-236). Berlin Heidelberg: Springer . Sevarac, Z. (2012, Mei). Retrieved from Neuroph is lightweight Java neural network framework:
http://neuroph.sourceforge.net/
Team, E., & Inc, E. (2006). Esper Reference Version 5.2.0. Wayne: EsperTech Inc.