www.scholink.org/ojs/index.php/ra
58
A Study of Boron and Silica Foliar Application on Growth and
Yield of Rice in High Boron Content Media
Paul Benyamin Timotiwu1*, Agustiansyah1, Eko Pramono1 & Wayan Ana Voulina1 1
Department of Agrotechnology, College of Agriculture, University of Lampung, Bandar Lampung, Indonesia
*
Paul Benyamin Timotiwu, E-mail: [email protected]
Received: October 27, 2016 Accepted: October 31, 2016 Online Published: November 8, 2016 doi:10.22158/ra.v1n2p58 URL: http://dx.doi.org/10.22158/ra.v1n2p58
Abstract
The low level of micro nutrients will cause a deficiency in plants, but even the slightest excess will be
toxic. This research aimed to know the possible physiology effect of foliar application of boron, silica
and their interaction on growth and yield of rice in high boron content media. The research was
conducted in the Integrated Green house Field Laboratory, College of Agriculture, University of
Lampung from October 2014 to March 2015. The treatments were arranged in a 3 x 5 factorial by
applying in a Randomized Complete Block Design (RCBD) with two replications. The first factor was
boron applied with concentrations of 0, 10 and 20 ppm, respectively. The second factor was silica
applied with concentrations of 0, 50, 100, 150 and 200 ppm, respectively. The homogeneity of variance
was tested using Bartlett’s test and the non-additivity of model using Tukey’s test. The differences of treatment mean were analyzed using orthogonal contrast and polynomial at 5% and 1% probability
level. The results showed that the foliar application of boron, silica and their interaction did not affect
growth and yield of rice in high boron content media. The high formation of wax in the cuticle layer
supported by high levels of boron may cause boron and silica which was applied through the leaves
difficult to be absorbed by plants.
Keywords
cuticle layer, micro nutrients, wax
1. Introduction
High levels of boron in the soil cause toxicity symptoms to the plant. It occurs following the pattern from the base to the tip of the leaf causing typical poisoned symptoms of chlorosis or necrosis at the edges of older leaves (Roessner et al., 2006). Cayton (1985) in his IRRI research revealed that levels of boron in the soil is called critical (high) if it contains > 5 mg B/kg based on the hot water extraction analysis.
Silica element is categorized as a supportive nutrient. Although most of the plants can complete their life cycle in a state of shortage of silica, the adequate level of silica in plants is important to support healthy growth, especially on accumulating plants such as rice (Kraska & Breitenbeck, 2010). The role of silica in supporting the growth of plants by pressing biotic stresses such as disease and pests, and
abiotic stresses such as drought, salinity and toxicity of metals by performing two ways polymerization of silicate acid which leads to the formation of a dense layer of silica gel (poly-silicate acid) and it has an important role in organic defense compound formation through changes in gene expression (Epstein, 2009).
Nutrients applied through the soil likely to be tied up and form sediment influenced by pH and ions contained in the soil (Lopez-Arredondo et al., 2013). Fertilizer application through the leaves can be an alternative to fulfill the micronutrients need because the response showed by the plants is relatively quick. Absorption of sprayed nutrients through the leaf carried on by the surface of plants which has a hydrophobic membrane, or cuticle (the membrane which limits exchange of water, solutes and gases between plant and the environment), also might through stomata’s although those two entrances are debatable (Fernandez et al., 2013). Fernandez et al. (2013) revealed that spraying nutrients which are immobile in the plant is only beneficial for tissues which receive the sprayed nutrients directly. This research aimed to study of foliar application of boron, silica and their effect on growth and yield of rice in high boron content media.
2. Materials and Methods
The research was conducted in the green house at the Integrated Field Laboratory, College of Agriculture, University of Lampung from October 2014 to March 2015. The treatments were arranged in a 3 x 5 factorial by applying in a Randomized Complete Block Design (RCBD) with two replications and each replication there were two sub replications. The first factor was the application of boron with concentrations of 0, 10 and 20 ppm, respectively. The second factor was the application of silica, of 0, 50, 100, 150 and 200 ppm, respectively. Treatments combination or experimental unit was in the form of plastic buckets filled with a red-yellow podzolic mud soil media as much 8 kg/bucket. The homogeneity of variance was tested using Bartlett’s test and the non-additivity of model using Tukey’s test. The difference of means were analyzed using orthogonal contrast and polynomial at 5% and 1% probability level.
60
insecticides. Potential yield of Mekongga varieties reached 8.4 tons/ha, resistant to pests (brown planthopper biotype 2 and 3) and diseases (bacterial leaf blight strains IV), so widely grown by farmers. Boric acid (H3BO3) needed to create boron solutions with concentration of 10 and 20 ppm those were equivalent to 0.06 and 0.11 g, respectively. Silica fertilizer needed to make 1 liter of solution with concentration of 50, 100, 150 and 200 ppm was equivalent to 0.51; 1.01; 1.52; 2.03 g of Si, respectively. Based on the analysis result of N, P and K levels with a colorimetric method (staining), fertilizer added was equivalent to 200 kg urea/ha (1.25 g/buckets), 75 kg SP-36/ha (0.47 g/buckets), and 50 kg KCl/ha (0.31 g/buckets).
Media was flooded for 30 days to reach a pH of 6-7. Rice seeds were soaked in water for 24 hours, and
then wrapped using gauze for 48 hours, so that the seed germinated uniformly. The germinating seed were then sown in seedbed. When seedlings were 21 days old (days after sowing) then seedlings were transferred the seedbed to the bucket. The seedlings were planted right in the middle of circle of bucket, two seedlings per bucket, at a depth of 3-5 cm. After one week old, one less vigor of the seedling was removed and leaving the vigorous one to grow in the bucket. Boron and silica was applied when the plants were 28, 35 and 42 Days After Planting (DAP). Watering was done by flushing water in the bucket to the brim each began to dry with the aim of giving an opportunity to oxidation. Weeding was done physically if there were weeds growing. Basic fertilization was performed at the age of 7 DAP for half dose of urea fertilizer, as well as full dose of SP-36 and KCl. Rest of half dose of urea fertilizer was added after the plant was 36 DAP. Controlling of pest and disease was carried out if during the observation was found the symptoms. Harvesting was done at the time the plant was 120 days, marked by race grain and flag leaf yellowing and water content ranging from 17%-23%. Furthermore, the drying of seeds were done until the seeds moisture content around 11%.
Observations to components of growth included plant height (at 9 weeks after planting), productive tiller number (at 13 weeks after planting), tiller angle (at 49 days after planting), greenness leaves level (at 42 days after planting) and plant dry weight (at 65 days after planting); and yield components observed after the harvest: filled grain number, total grains number, unfilled grain number, filled grain weight, unfilled grain weight, 1000 grain weight, and yield potential.
3. Results and Discussion
The results showed that the application of boron through the leaves did not affect the rice growth and yield. Increasing the concentration of silica applied through the leaves did not affect the rice growth and yield. Rice plant responses to increased concentration of silica were independent on the increased concentration of boron (data were not given).
Standard error of the mean of the effect of boron on the rice growth and yield showed no differences on the application of 0, 10 and 20 ppm boron, respectively (Tables 1 and 2). This was also shown on the application of silica which showed no difference in the growth and yield of the application 0, 50, 100, 150 and 200 ppm silica, respectively (Tables 3 and 4).
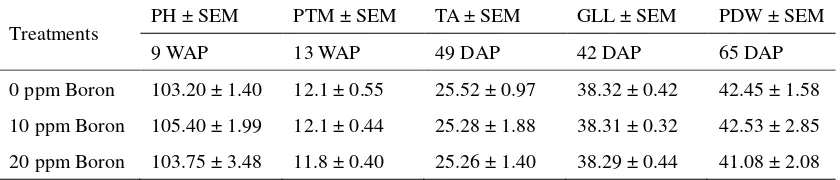
Table 1. Standard Error of the Mean (SEM) of the Effect of Boron on Plant Height (PH), Productive Tiller Number (PTN), Tiller Angle (TA), Greenness Leaves Level (GLL) and Plant Dry Weight (PDW)
Treatments PH ± SEM PTM ± SEM TA ± SEM GLL ± SEM PDW ± SEM
9 WAP 13 WAP 49 DAP 42 DAP 65 DAP
0 ppm Boron 103.20 ± 1.40 12.1 ± 0.55 25.52 ± 0.97 38.32 ± 0.42 42.45 ± 1.58 10 ppm Boron 105.40 ± 1.99 12.1 ± 0.44 25.28 ± 1.88 38.31 ± 0.32 42.53 ± 2.85 20 ppm Boron 103.75 ± 3.48 11.8 ± 0.40 25.26 ± 1.40 38.29 ± 0.44 41.08 ± 2.08
Note. WAP = Weeks After Planting; DAP = Days After Planting.
Table 2. Standard Error of the Mean (SEM) of the Effect of Silica on Plant Height (PH), Productive Tiller Number (PTN), Tiller Angle (TA), Greenness Leaves Level (GLL) and Plant Dry Weight (PDW)
Treatments PH ± SEM PTN ± SEM TA ± SEM GLL ± SEM PDW ± SEM
9 WAP 13 WAP 49 DAP 42 DAP 65 DAP
0 ppm Silica 104.00 ± 0.93 11.92 ± 0.41 25.71 ± 1.95 38.21 ± 0.62 40.35 ± 1.57 50 ppm Silica 102.67 ± 3.28 12.67 ± 0.37 26.42 ± 0.83 38.49 ± 0.31 41.58 ± 1.85 100 ppm Silica 107.50 ± 1.45 12.08 ± 0.37 25.76 ± 1.20 38.74 ± 0.36 44.83 ± 1.58 150 ppm Silica 101.42 ± 1.01 12.00 ± 0.47 25.47 ± 1.02 38.12 ± 0.11 41.71 ± 3.32 200 ppm Silica 105.00 ± 2.89 11.33 ± 0.27 23.42 ± 1.44 37.96 ± 0.21 41.62 ± 1.95
Note. WAP = Wees After Planting; DAP = Days After Planting.
62
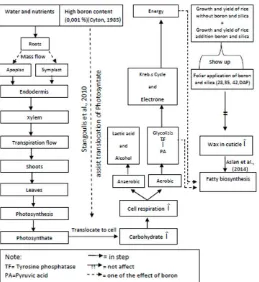
symplast path. Afterward the nutrients and water went to the endodermis, flowed through xylem tissues following the transpiration stream towards the top of the plant. Miwa and Fujiwara (2010) revealed that boron in the soil absorbed by plants in form of boric acid soluble in water and largely distributed through the transpiration stream. Water was absorbed by roots and CO2 through the leaves. They were used by plants to produce photosynthate in carbohydrate forms. Boric acid in plants is easy to bind into a complex with polyhydroxyl compounds (Camacho-Crist’obal, 2008). Furthermore, boron plays a role in regulating the transport and translocation of sugar through the plant cell membranes (Stangoulis et al., 2010).
High levels of boron in the soil resulted in increased distribution of carbohydrates thus increased cell
respiration. Respiration in plants occurs in aerobic (requiring O2) and anaerobic (not requiring O2). Through a series of aerobic respiration, glycolysis process converts glucose into pyruvic acid to form tyrosine phosphatase involved in the synthesis of fats, proteins and other compounds. The next process, in the Kreb’s cycle transfers electrons to mitochondria to change to energy. The energy is also formed from the excess of lactic acid and other fermentation (anaerobic respiration). The energy created is used for the formation of new cells in all parts of the plant. This energy is also used to remodel pyruvic acid (in the aerobic respiration) in forming of fat, proteins and other compounds. Fat then forms a layer of wax (which costs the energy) in the leaf cuticle which acts as a barrier membrane between plants and the environment which limits the exchange of water, solutes and gases (Aslan et al., 2014; Fernandez et al., 2013). Increased distribution of carbohydrate supported by high levels of boron may cause the increase of pyruvic acid and fat synthesis, which results in high wax synthesis.
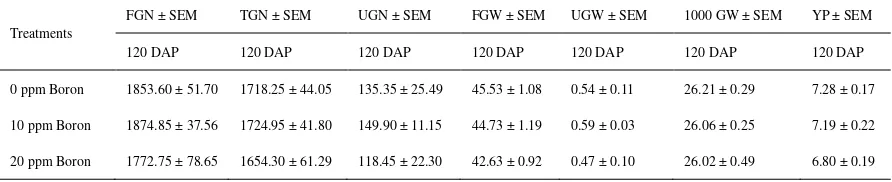
Table 3. Standard Error of the Mean (SEM) of the Effect of Boron on Filled Grain Number (FGN), Total Grain Number (TGN), Unfilled Grain Number (UGN), Filled Grain Weight (FGW), Unfilled Grain Weight (UGW), 1000 Grain Weight (1000 GW ) and Yield Potential (YP)
Treatments
FGN ± SEM TGN ± SEM UGN ± SEM FGW ± SEM UGW ± SEM 1000 GW ± SEM YP ± SEM
120 DAP 120 DAP 120 DAP 120 DAP 120 DAP 120 DAP 120 DAP
0 ppm Boron 1853.60 ± 51.70 1718.25 ± 44.05 135.35 ± 25.49 45.53 ± 1.08 0.54 ± 0.11 26.21 ± 0.29 7.28 ± 0.17
10 ppm Boron 1874.85 ± 37.56 1724.95 ± 41.80 149.90 ± 11.15 44.73 ± 1.19 0.59 ± 0.03 26.06 ± 0.25 7.19 ± 0.22
20 ppm Boron 1772.75 ± 78.65 1654.30 ± 61.29 118.45 ± 22.30 42.63 ± 0.92 0.47 ± 0.10 26.02 ± 0.49 6.80 ± 0.19
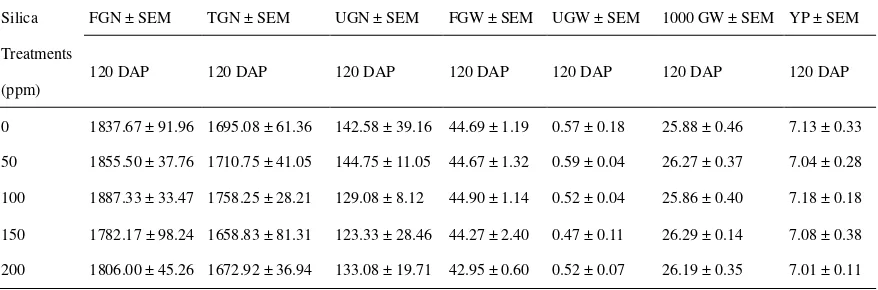
Table 4. Standard Error of the Mean (SEM) of the Effect of Silica on Filled Grain Number (FGN), Total Grain Number (TGN), Unfilled Grain Number (UGN), Filled Grain Weight (FGW), Unfilled Grain Weight (UGW), 1000 Grain Weight (1000 GW) and Yield Potential (YP)
Silica
Treatments
(ppm)
FGN ± SEM TGN ± SEM UGN ± SEM FGW ± SEM UGW ± SEM 1000 GW ± SEM YP ± SEM
120 DAP 120 DAP 120 DAP 120 DAP 120 DAP 120 DAP 120 DAP
0 1837.67 ± 91.96 1695.08 ± 61.36 142.58 ± 39.16 44.69 ± 1.19 0.57 ± 0.18 25.88 ± 0.46 7.13 ± 0.33
50 1855.50 ± 37.76 1710.75 ± 41.05 144.75 ± 11.05 44.67 ± 1.32 0.59 ± 0.04 26.27 ± 0.37 7.04 ± 0.28
100 1887.33 ± 33.47 1758.25 ± 28.21 129.08 ± 8.12 44.90 ± 1.14 0.52 ± 0.04 25.86 ± 0.40 7.18 ± 0.18
150 1782.17 ± 98.24 1658.83 ± 81.31 123.33 ± 28.46 44.27 ± 2.40 0.47 ± 0.11 26.29 ± 0.14 7.08 ± 0.38
200 1806.00 ± 45.26 1672.92 ± 36.94 133.08 ± 19.71 42.95 ± 0.60 0.52 ± 0.07 26.19 ± 0.35 7.01 ± 0.11
Note. DAP = Days After Planting.
64
Figure 1. Diagram the Possible Physiology Effect of Boron and Silica Foliar Application in High Boron Content Media
4. Conclusion
The results showed that the foliar application of boron, silica and their interaction do not affect growth and yield of rice in high boron content media. The high formation of wax in the cuticle layer supported by high levels of boron may causes boron and silica which is applied through the leaves in this study is difficult to be absorbed by plants.
References
Aslan, S., Sun, C., Leonova, S., Dutta, P., Dörmann, P., Domergue, F., ... Stymne, S. (2014). Wax esters of different compositions produced via engineering of leaf chloroplast metabolism in Nicotiana benthamiana. Metabolic Engineering, 25, 103-112.http://dx.doi.org/10.1016/j.ymben.2014.07.001 Camacho-Crist´obal, J. J., Rexach, J., & Gonz´alez-Fontes, A. (2008). Boron in Plants: Deficiency and Toxicity (Invited Review). Journal of Integrative Plant Biology, 50, 1247-1255. http://dx.doi.org/10.1111/j.1744-7909.2008.00742.x
Cayton, M. T. C. (1985). Boron Toxicity in Rice. The International Rice Research Institute. Manila, Philippines.
Epstein, E. (2009). Silicon: Its Manifold Roles in Plants. Annals of Applied Biology, 155, 155-160. http://dx.doi.org/10.1111/j.1744-7348.2009.00343.x
Practices. International Fertilizer Industry Association. IFA, Paris, France.
Kraska, J. E., & Breitenbeck, G. A. (2010). Survey of the Silicon Status of Flooded Rice in Louisiana. Agronomy Journal, 102, 523-529.http://dx.doi.org/10.2134/agronj2009.0146
Miwa, K., & Fujiwara, T. (2010). Review: Part Of A Special Issue on Plant Nutrition Boron Transport In Plants. Annals of Botany, 105, 1103-1108. http://dx.doi.org/10.1093/aob/mcq044
ópez-Arredondo1, D. L., Leyva-González1, M. A., Alatorre-Cobos, F., & Herrera-Estrella, L. (2013). Biotechnology of Nutrient Uptake and Assimilation in Plants. International Journal of Developmental Biology, 57, 595-610. http://dx.doi.org/10.1387/ijdb.130268lh
Roessner, U., Patterson, J. H., Forbes, M. G., Fincher, G. B., Langridge, P., & Bacic, A. (2006). An
Investigation of Boron Toxicity in Barley Using Metabolomics. Plant Physiology, 142, 1087-1101. http://dx.doi.org/10.1104/pp.106.084053
Saleem M., Khanif, Y. M., Ishak, F., Samsuri, A. W., & Hafeez, B. (2011). Importance of Boron for Agriculture Productivity: A Review. International Research Journal of Agricultural Science and Soil Science, 1, 293-300.
Stangoulis, J., Tate, M., Graham, R., Bucknall, M., Palmer, L., Boughton, B., & Reid, R. (2010). The Mechanism of Boron Mobility in Wheat and Canola Phloem. Plant Physiology, 153, 876-881. http://dx.doi.org/10.1104/pp.110.155655
Wahyuni, T. B., Purwoko, B. S., Junaedi, A., & Abdullah, S. B. (2013). Correlation of Leaf Characteristics and Yield of Various Types of Rice Cultivars. Indonesian Journal of Agronomy, 41(3), 181-187.
![Similarity:Phosphorus and Boron Application on Growth, Yield, and Quality of
Soybean Seeds (Glycine max [L.] Merril)](data:image/gif;base64,R0lGODlhAQABAIAAAP///wAAACH5BAEAAAAALAAAAAABAAEAAAICRAEAOw==)