Genotype by Birth or Rearing Type Interaction in the Growth
Trajectory of Merino Lamb
A. Dakhlan1, N. Moghaddar12 and J.H.J. van der Werf12
1School of Environmental and Rural Science, University of New England,
Armidale, NSW 2351, Australia.
[email protected]; [email protected]
2CRC for Sheep Industry Innovation, Armidale, NSW 2351, Australia
Summary
This study explores genotype by birth or rearing type interaction for body weight across the growth trajectory of Merino lambs by estimating the contribution of sire by birth type or rearing type interaction (SxBT/RT) to the phenotypic variance and by estimating the genetic correlation between body weights (BW) expressed in single versus twin birth type (BT) or rearing type (RT) at different ages. Results from univariate random regression analysis showed that from 75 to 200 days of age the heritability for body weight increased gradually from 0·43 to 0·65 and decreased afterwards to 0.55 at 300 days of age. A sire by birth type and sire by rearing type interaction contributed around 2-6% to variation in body weight at 200 until 300 days of age, while before 200 days of age this contribution was almost zero. Results from bivariate random regression analysis showed that genetic correlation between weights in single BT and RT and twin BT and RT classes of lambs (single born/single reared (SS) vs twin born/twin reared (TT)) was consistently high (0.84-0.97) along the trajectory, while the genetic correlation between weights in different BT but the same RT (SS vs TS) increased gradually from 0.75 to 0.95 until 250 days and decreased afterwards (to 0.84). Genetic correlation between weights in different RT but the same BT (TS vs TT) increased from 75 to 175 days of age (from 0.86 to 0.94) and flattened until 250 days and decreased thereafter to 0.87. Result indicated that genotype expression differed in different BT and RT across the growth trajectory with BT having a larger effect than RT in earlier growth and with RT having a larger effect than BT in later growth of lambs.
Keywords: genotype by birth or rearing type interaction, body weight, Merino lamb, random regression model
Introduction
Birth type (BT) and rearing type (RT) influence lamb growth and development from zygote to birth (for BT) and from birth to adult (for BT and RT). BT and RT also constitute an environment that influence the expression of early growth of Merino lambs and its influence might continue along its further growth trajectory. Genotype expression of growth traits in different environments created by different BT or RT might differ between ages along the growth trajectory. In a previous study (Dakhlan
of lambs. Therefore, the interaction of BT and RT with the expression of genotype might change over the time along the growth trajectory. This interaction along the growth trajectory can be described by the genetic correlation between traits in different environments (e.g. body weight in different BT or RT) and this correlation might gradually change along the trajectory. Random regression models can be used to estimate such correlations.
This study explores the genetic model underlying the growth path for singles and twins and how the pre- and post-natal environment affects the expression of genetic merit for different parts of the growth curve. For this purpose we estimate parameters describing genotype by birth or rearing type interaction for body weight across the growth trajectory of Merino lamb as sire by BT or RT (SxBT/RT) interaction as well as the genetic correlation between weights expressed in single versus twin BT or RT in a random regression model.
Material and Method
We used repeated records on body weight (BW) of Merino lambs obtained from the Information Nucleus (IN) program of the CRC for Sheep Industry Innovation in Australia. Details on this program and its design are described by Van der Werf et al. (2010). Body weights recorded between 75-300 days of age were used in this study. The total number of records was 27,622, measured on 1,626 lambs born and reared as single (SS), 401 lambs born as twins but reared as singles (TS) and 1,831 lambs born and reared as twins (TT) with a total of 3,858 animals generated from 167 sires and 2,484 dams.
Fixed effects in the random regression model (RRM) for analysis included mean, contemporary group of year of birth (5 levels, 2007-2011), flock (8 levels) and management group within flock (up to 4 levels). Further fixed effects fitted were sex (2 levels) and birth by rearing type interaction (3 levels: SS, TS and TT) and age of dam (7 levels: 2-8 years of age). As random effects in the animal model, we fitted genetic group effects (135 groups of origin, including Merino strain), animal additive genetic effect, effect of the animal’s permanent environment, and maternal effect. A pedigree file was used consisting of 9,961 animals from 7 generations. In the univariate RRM we also compared models with and without fitting sire by BT/RT, sire by flock (SxF), SxF and SxBT, and SxF and SxRT interaction effects. We undertook bivariate RRM analysis to estimate genetic correlations between different birth or rearing type. All fixed and random effects in the RRM were fitted as interacting with age using Legendre polynomials.
The components of (co)variances and genetic parameters were estimated using the method of restricted maximum likelihood with the ASReml software (Gilmour et al., 2009). We used log likelihood, Akaike information criterion (AIC) and Bayesian information criterion (BIC) to find the best model by fitting various orders of the Legendre polynomial.
without SxBT/RT variance).
Results and Discussion
Univariate Random Regression Models
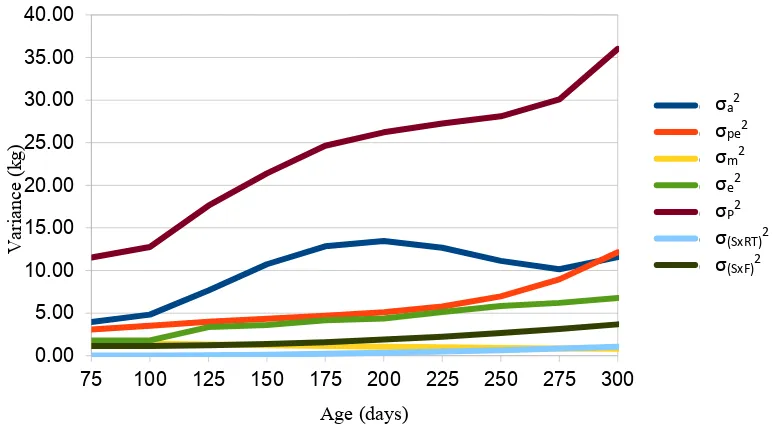
Results from univariate random regression analysis from the best model (2211, a second order Legendre polynomial for direct additive genetic, a second order for permanent environment, a first order for maternal effects and a first order for genetic group) without one of the interactions SxF, SxBT or SxRT included in the model (Figure 1) indicates that additive genetic variance increased gradually from 4.95 kg2 at 75 days of age to 19.8 kg2 at 300 days of age. Additive genetic variance
in this study dominated the phenotypic variance, followed by permanent environmental, residual and maternal variance. Additive genetic variance in this study was slightly smaller than the additive genetic variance reported by Fischer et al. (2006) for early age and higher for later age. Animal permanent environmental variance increased gradually from 2.97 kg2 at 75 days of age to 8.56 kg2 at 300 days of age. Maternal variance decreased gradually from 1.73 kg2 at 75 days of age to 1.00 kg2 at 300 days of age. When SxBT interaction was included in the model
additive genetic variance decreased at age 200 to 300 from 17.48 kg2 and 19.80 kg2 to 16.17 and 16.79 kg2, respectively and from 15.87 to 16.58 kg2 when SxRT interaction was included in the model. When SxF interaction was included in the model additive genetic variance decreased further and also with the inclusion of SxBT or SxRT (Figure 2).
Heritability estimates of weight at different ages along the trajectory increased gradually from 0.43 to 0.65 at 75 to 200 days of age and decreased gradually to 0.55 at 300 days of age, when using all data. The ratio between maternal variance and phenotypic variance decreased gradually from 0.15 at 75 days to 0.03 at 300 days of age, while the ratio between permanent environmental variance and phenotypic variance decreased from 0.26 at 75 days to 0.14 at 225 days of age and increased to 0.24 at 300 days of age. When the SxBT interaction was included in the model, heritability estimates decreased from 0.63, 0.60, 0.57 and 0.55 at 225, 250, 275 and 300 days of age to 0.57, 0.52, 0.48 and 0.46, respectively, and to 0.56, 0.51, 0.47 and 0.46, respectively, when SxRT interaction included in the model. The decrease of heritability estimates was larger across the trajectory for all ages when SxF interaction was included in the model. The contribution of the SxBT/RT interaction was very small varied between 0-6% of the phenotypic variance, while contribution of SxF varied between 7-12% of the phenotypic variance.
Bivariate Random Regression Model
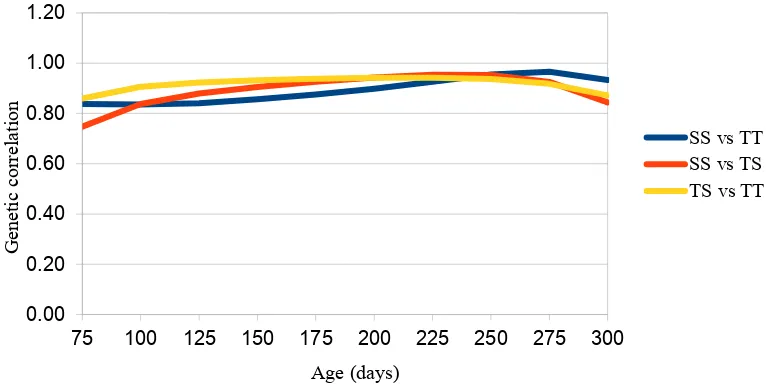
BT (TSxTT) increased from 75 to175 days of age and remained constant afterwards until 250 days of age and decreased towards the end. This result showed that BT has a larger effect on the genotype expression for growth rate than RT, particularly at early ages. Different BT apparently affected the expression of breeding value at early ages (75-175 days), and different RT affected the expression of growth breeding values more at later ages (225-275 days). Genetic correlations between weights expressed in different birth and rearing type (SSxTT) of this study were similar with a previous study (Dakhlan et al., 2017) using bivariate analysis of weight at fixed ages which gave genetic correlations of 0.91 for WWT (91.9 days of age) and of 0.96 for PWWT (261.1 days of age). In general, the genetic correlation between weights expressed in different birth and rearing type in this current study were higher than 0.8 which is often considered as a limited of practical importance (Robertson, 1959).
Conclusion and Implications
Both sire by birth type and sire by rearing type interaction contributed around 2-6% to the variation of body weight and decreased heritability estimates at age 200 to 300 days in this study. Genotype expression differed in different birth types and different rearing types particularly in earlier growth of lambs for birth type and in later growth for rearing type with birth type having a larger effect than rearing type. The implications of this study is that expression of growth potential along the trajectory differs between expressions in single and twins and may have to be considered in genetic evaluation and selection.
Acknowledgements
This PhD project was funded by the Directorate General of Human Resource for Science, Technology and Higher Education of The Republic of Indonesia. The authors acknowledge the contributions of the Sheep CRC Information Nucleus in providing data for this study.
List of References
Dakhlan A., N. Moghaddar & J.H.J van der Werf, 2017. (under review in Anim. Prod. Sci.).
Fischer, T. M., J. H. J. van der Werf, R. G. Banks, A. J. Ball & A. R. Gilmour. 2006. Genetic analysis of weight, fat and muscle depth in growing lambs using random regression models. Anim. Sci. 82: 13-22.
Gilmour, A. R., B. J. Gogel, B. R. Cullis & R. Thompson. 2009. ASReml User Guide Release 3.0. VSN International Ltd, 5 The Waterhouse, Waterhouse Street, Hemel Hempstead, HP1 1ES, UK.
Robertson, A. 1959. The Sampling Variance of the Genetic Correlation Coefficient. Biometrics 15: 469-485.
Figure 1. Variance component (σa2, additive genetic variance; σpe2, permanent
environmental variance; σm2, maternal variance, σe2, residual variance;
σp2 = phenotypic variance) for body weight as a function of age using all data without including SxBT/RT interaction in the model
Figure 2. Variance component (σa2, additive genetic variance; σpe2, permanent
environmental variance; σm2, maternal variance, σe2, residual variance;
σp2= phenotypic variance; σSxBT2, sire by birth type variance; σSxF2, sire by flock variance) for body weight as a function of age using all data with SxF and SxRT interaction included in the model
Figure 3. Genetic correlation between weights expressed in different BT and RT (SS vs TT), in different BT (SS vs TS) and in different RT (TS vs TT) in every subset of age
0.00 0.20 0.40 0.60 0.80 1.00 1.20
75 100 125 150 175 200 225 250 275 300
Gen
etic
co
rr
elatio
n
Age (days)