DOI 10.1007/s11149-009-9105-4
P R AC T I T I O N E R S E C T I O N
Greenhouse gas policy and California electricity prices
Carl Danner
Published online: 10 July 2009
© Springer Science+Business Media, LLC 2009
Abstract California has adopted a policy of mandatory reductions in greenhouse gas (GHG) emissions to 1990 levels by the year 2020. (California Legislature (2006) Assembly Bill 32, the Global Warming Solutions Act of 2006, California Air Resources Board (2008)Climate change draft scoping plan, Sect.2) Electricity utilities will need to recover related expenses, such as for the purchase of emissions permits. Economists often assume that raising usage prices for the commodity is the best way to recoup such expenses. However, regulated usage prices to California residential customers already exceed the cost of electricity generation plus a plausible externality cost for carbon dioxide (CO2) emissions. Instead, recovering compliance expenses through usage insensitive charges could avoid causing unnecessary economic harm to con-sumers.
1 Introduction: Greenhouse gases and the California electricity industry
California is the first U.S. state to adopt a comprehensive, mandatory greenhouse gas control regime. In 2004, 6.8% of total U.S. carbon dioxide emission equivalents of 7078 million tons occurred within the state (California Air Resources Board 2007;
U.S. Environmental Protection Agency 2008page ES-13). With regard to electricity, in-state California power generation contributed only 2.4% (or 59.4 million tons) out of 2,459.8 million tons of related GHG emissions nationwide in 2006 (U.S. Energy Information Administration 2007a). These relatively low emissions result from a mix of natural gas, hydroelectric, nuclear, and designated “renewable” generation sources such as smaller hydroelectric facilities, geothermal, windmills, and biomass. About a quarter of California’s electricity is imported from other states, Canada and Mexico;
C. Danner (
B
)its generation is estimated to produce as much GHG emissions as does in-state gener-ation, due largely to the use of coal (California Air Resources Board 2008, Appendix C page 89). Overall, California’s 12.2% of the U.S. population accounts for 7.2% of nationwide electricity usage (U.S. Census Bureau 2008;U.S. Energy Information Administration 2007b;Sudarshan and Sweeney 2008).
Notwithstanding this relatively low electricity usage and carbon intensity in a na-tional context, state regulators have determined a reduction target by 2020 of approx-imately 50 million tons per year of CO2output for electricity consumed in California from sources both inside and outside the state (California Air Resources Board 2008, Table2 at page 17). At present, there is no other direct regulation of greenhouse gases applicable to California electricity generation or use, although state policies also encourage the development of alternative energy sources, the adoption of energy efficiency measures, and conservation.
Below, Section2introduces the Pigouvian tax approach. Section3compares retail electricity prices to estimates of the social cost of electricity generation, including an externality cost for greenhouse gases. Section4considers an alternative, multi-part tariff approach to retail pricing. Conclusions and some further policy observations follow in Section5.
2 Efficient retail pricing and a Pigouvian tax
This paper examines how retail electricity prices may be used in an efficient manner to recover GHG regulatory costs utilities are likely to incur under California’s rules (such as for purchase of emissions permits in a cap and trade program).
A useful benchmark for this analysis is a Pigouvian tax, which adds a social cost of related externalities to the marginal cost of a good. Here, a Pigouvian tax would require consumers to factor a cost for GHG emissions into decisions about electricity usage. In response, consumers may cut back some low value usage, increase investments in energy efficiency and conservation, use more alternatives to electricity, and continue higher-value electricity usage where superior substitutes do not exist even given the added tax. Indeed, where a usage price fails fully to cover social costs (including externalities), the remedy of a Pigouvian tax is intended to reduce consumption.
California regulators set residential electricity prices to recover most revenues through per-kilowatt-hour charges.1By recovering non-usage related costs (such as for distribution poles and wires) from variable charges, this policy marks up usage prices above the average variable cost of electricity generation and delivery. This is not uncommon in other jurisdictions. However, California rates have the feature of tiered increasing block rates, with the first two blocks frozen by legislation at their nominal levels of February, 2001 (California Legislature 2001).2This policy raises
1 Only one of the three utilities has a fixed monthly charge ($0.87 per month for Southern California
Edison). All have modest minimum monthly bills (including usage), the highest of which is San Diego Gas & Electric’s at $5.10 per month.
Table 1 CPUC tariffed electricity usage prices (cents/kilowatt-hour, 2009)
Percent of baseline usage 0–100 101–130 131–200 201–300 301+
PG&Ea 11.5 13.1 24.7 35.4 41.0
SCEb 12.2 14.1 20.5 23.9 27.3
SDG&E summerc 12.9 14.9 32.0 34.0 34.0
SDG&E winter 12.9 14.9 30.3 32.3 32.3
aPacific Gas & Electric residential rates as of January 1, 2009, fromhttp://www.pge.com/tariffs/electric. shtml(accessed January 22, 2009)
bFrom Southern California Edison Tariff D, filing date December 24, 2008. Prices reflect the total of
Delivery Service, URG Generation, and DWR Generation—calculated using the 30 percent DWR gen-eration factor suggested athttp://www.sce.com/AboutSCE/Regulatory/tariffbooks/ratespricing/dailydwr/
(accessed January 22, 2009)
cFrom San Diego Gas & Electric Tariffs Schedules DR, EECC, and DWR-BC (effective January 1, 2009);
includes Residential Service, Electric Energy Commodity Cost, and Department of Water Resources Bond Charges, fromhttp://www.sdge.com/regulatory/currentEffectiveTariffs.shtml(accessed January 22, 2009)
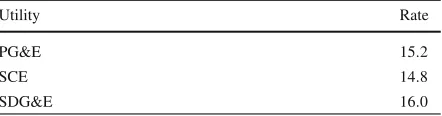
Table 2 Average residential retail rates (cents/kilowatt-hour, 2007)a
aCalifornia Public Utilities
Commission 2009
Utility Rate
PG&E 15.2
SCE 14.8
SDG&E 16.0
upper tier rates disproportionately as utility expenses rise.3The resulting residential rates are displayed below in Table1for the state’s three major investor-owned elec-tricity utilities.
Another possibility is that customers respond to average rather than marginal usage prices.4Table2reports average residential usage prices for the three utilities.
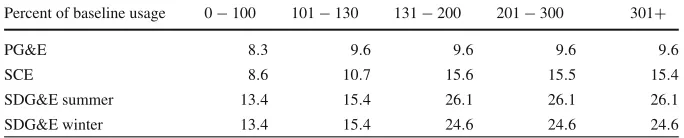
California also has discounted low-income electricity rates, charged to a quarter of residential customers who are responsible for about a fifth of total residential usage.5 These rates are displayed in Table3.
3 Prices and social cost
Ordinarily, a Pigouvian tax analysis starts with a commodity sold at a market price that does not include the cost of a related externality. The cost of the externality is
3 CPUC rate designs for commercial and industrial customers include more substantial monthly charges,
demand charges, and (often) time-of-use commodity rates.
4 Customers can face challenges in understanding their consumption levels, the usage rates they pay, and
the actual running costs of energy-using appliances.Bushnell and Mansur(2004) found a lag in the response of San Diego consumers to changes in prices they faced during the brief retail deregulatory period in 1999– 2000.Borenstein(2008b) found some preliminary evidence that California customers do not respond to increasing marginal prices.
5 These rates are available to customers receiving certain other public assistance benefits, or who self-certify
Table 3 Discounted low-income (“CARE”) residential retail rates (cents per kilowatt-hour, 2009)a Percent of baseline usage 0−100 101−130 131−200 201−300 301+
PG&E 8.3 9.6 9.6 9.6 9.6
SCE 8.6 10.7 15.6 15.5 15.4
SDG&E summer 13.4 15.4 26.1 26.1 26.1
SDG&E winter 13.4 15.4 24.6 24.6 24.6
aSources: Utility tariffs as cited for Table1
added to the market price to determine a total social cost and optimal price (or tax). The following calculations work backwards by starting with prices that are adminis-tratively determined, and asking whether they exceed the full social cost of production including a GHG externality.
Therefore, the test is whether the Retail Price exceeds the Marginal Social Cost (including the GHG Externality).
In other words, if the current retail electricity usage price is effectively subsidized (through failing to include all relevant costs, including for GHG), then a Pigouvian carbon tax could raise the price to cover social marginal cost to encourage consumers to take full account of global warming concerns in their choices about how to use electricity.
The marginal cost of electricity generation is the first component of social cost. The California Public Utilities Commission (CPUC) calculates a “market price referent” as a levelized estimate of the forward-looking cost of electricity generation over a 10–20-year horizon (CPUC 2004). The CPUC’s most recent estimate for a natural gas plant over a 20-year horizon is 10.0 cents per kwh (CPUC 2008).6A federally-spon-sored study found a lower estimate of 6.8 cents per kwh (U.S. Department of Energy 2007).
Two recent estimates of the incremental cost of coal-fired electricity were 4.8 and 6.4 cents per kwh for the subcritical pulverized technology currently in wide use (Massachusetts Institute of Technology 2007;U.S. Department of Energy 2007).
Generation cost estimates such as the above can be compared to the CPUC’s stan-dard utility tariffed rates, which are not time-differentiated and only slightly differen-tiated seasonally for one utility (SDG&E).7
In terms of retail prices, the CPUC maintains separate rate schedules for general residential and designated low-income customers. Current tariffed electricity usage prices are shown in Table3.
Note that Table3’s rates for low-income customers are distinct from the “baseline” method of pricing applied to all. The latter policy gives customers varying allowances
6 The CPUC uses this cost estimate to evaluate whether renewable energy sources are economic and should
be contracted for purchase by utilities. The promotion of renewable energy is a principal goal of California state energy policy.
7 A more precise analysis could consider marginal costs differentiated by time of day (e.g., peak and off
of lower-priced usage based on their “climate zones,” a policy intended to provide households with a reasonably-priced basic amount of electricity. The pricing differ-ences among baseline rate tiers are not based on differdiffer-ences in underlying costs.
Estimates of the social cost of GHG emissions complete the information needed for a Pigouvian comparison. Analysts often present these as estimates of an optimal carbon tax level. Natural gas is usually the marginal fuel for electricity generation in serving California demands. Its use releases about half a ton of CO2per megawatt-hour of electricity generated (Borenstein 2008a). Therefore, a carbon tax measured in dollars per ton will translate into about half that level in dollars per mwh for generated electricity. For example, a $20/ton tax on CO2output would add $10/mwh to the cost of gas-fired electricity, or 1 cent per kwh. The use of coal releases about a ton of CO2 per megawatt-hour, so a coal-based GHG tax would be twice these levels per kwh.
There is a range of possible values for the externality cost of a ton of emitted CO2. Presumably, such figures are no more than approximate given the uncertainties of global warming science and economics. At the same time, any policies to restrict CO2 output may implicitly reflect assumed damages or costs at some level. Here are some representative examples.
The CPUC determined a “Greenhouse Gas Adder” (based on a forecast of GHG compliance costs) of an additional 1.1 cents per kwh for the 20 year forward market price calculation reported above (CPUC 2008, Appendix A). The Energy Information Administration estimated the emissions offset cost per ton of CO2implied by proposed federal legislation, the McCain-Lieberman Climate Stewardship and Innovation Act of 2007 (U.S. Energy Information Administration 2007c, Fig. 12, page 31). The 2010 figure was about $13/ton, rising gradually in subsequent years. European carbon emis-sions offsets are trading just below the $20/ton level (Point Carbon 2009). A survey of the resource plans of fifteen western utilities showed base case figures ranging from zero to a levelized $20 per ton for CO2emissions regulatory costs through 2030 (Lawrence Berkeley National Laboratory 2008, pages 9–12).
Borenstein(2008a, page 25) noted that policy discussions of carbon markets tend to include an “escape valve” at or below $20 per ton, at which price the government might sell an unlimited number of permits. He suggests that permit prices may be limited to no more than $100/ton by the economics of renewable sources of electricity that become quite favorable at about that level.
Finally,Nordhaus(2007, pages 87–88) has reported modeling estimates of the dam-age function caused by CO2and global warming, along with related control costs and expected benefits. He finds an optimal carbon tax of $34 per metric tonne of carbon in 2010 (or about $8.50 per short ton of CO2), rising to about $50 per ton of CO2by 2100.
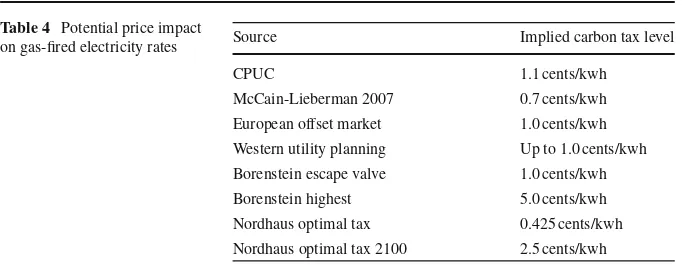
Table4shows the equivalent prices for these CO2tax estimates in terms of elec-tricity generated from natural gas.
elec-Table 4 Potential price impact
on gas-fired electricity rates Source Implied carbon tax level
CPUC 1.1 cents/kwh
McCain-Lieberman 2007 0.7 cents/kwh
European offset market 1.0 cents/kwh Western utility planning Up to 1.0 cents/kwh
Borenstein escape valve 1.0 cents/kwh
Borenstein highest 5.0 cents/kwh Nordhaus optimal tax 0.425 cents/kwh
Nordhaus optimal tax 2100 2.5 cents/kwh
tricity generation—even accounting for current estimates of GHG externality costs. The conclusion is the same for average retail prices, and for coal-based electricity (with potential carbon taxes at twice the level of those applicable to gas). Even more striking, the markups on regulated retail electricity rates beyond the frozen rate tiers are multiples of what a Pigouvian tax would imply. By contrast, there could be a GHG externality case for some increases to usage rates for many low-income customers of PG&E and SCE.
4 The possible use of Ramsey pricing or multi-part tariffs
The foregoing discussion indicates that applying a carbon tax on top of existing Cal-ifornia residential electricity rates is unnecessary. Indeed, current upper-tier rates are presumably harming consumers by forcing them to cut back usage or to make energy-saving investments in an uneconomic manner. However, if utilities must pay fees related to carbon regulation, then they will need to be recovered from customers in some way.
Principles of Ramsey pricing and multi-part tariffs offer one approach to minimiz-ing economic harm, assumminimiz-ing that consumers respond to marginal prices. A multi-part tariff can be an efficient way to recover fixed costs for utilities, because it allows usage prices to reflect only usage-sensitive costs. Otherwise, spreading fixed costs over usage-sensitive prices will raise them and thus suppress some demand inefficiently.
Given existing levels of usage-sensitive residential electricity prices in California, recovering carbon tax costs through a non-usage-sensitive customer charge would in effect raise the access price for electricity service and perhaps change few, if any economic decisions.8However, that question depends on which price residential
cus-tomers consider in deciding how much electricity to consume. If instead of marginal price they respond to the average price of electricity, then there may be no way to recover compliance costs from customer bills without providing a price signal that exceeds social cost—since average prices already are above that level.
8 SeeHausman et al. 1993for an analysis of demand interactions between usage and access prices in
5 Conclusion
California’s sources of electricity are relatively low in emissions, and current estimates of CO2control costs would only support a relatively modest Pigouvian carbon tax on top of the cost of production based on natural gas as the typical marginal generation fuel. However, California regulation is already requiring most residential customers to pay retail prices that are higher than these levels, in many instances strikingly higher. Thus, there may not be an economic case for raising California’s regulated residen-tial electricity usage prices further on account of concerns about CO2emissions—since to do so could cause unnecessary harm to consumers and the economy. Of course, these economics will change if anticipated GHG control costs and/or damage functions also change. However, relative to current expectations, most California electricity consum-ers appear already to have a more than adequate economic signal for this purpose.
This finding may seem counter-intuitive in light of California’s global warming policy. Why should customers of regulated electricity utilities not be subject to related requirements, including price increases to spur conservation? The answer lies in a dis-tinction between measures to address the supply and demand sides of the electricity industry—considerations that can be separated in a utility context more easily than they might for a fully-competitive industry.
Recall that estimates of efficient carbon tax levels ought to build from (among other data) information about the cost of opportunities on the supply side to substitute away from GHG-intensive production, as well as opportunities on the demand side to reduce consumption whose value falls below the full social cost of electricity production. The resulting optimal tax estimates define (roughly) the dividing line between GHG con-trol measures that would be least costly to the economy to attain the desired concon-trol objectives, versus others that are relatively more expensive and thus not economic to pursue under the present understanding of the problem.
On the supply side, it seems likely that California’s regulated utilities will bear costs of GHG control even though the state’s electricity generation is already relatively low in GHG intensity. Leaving aside many important details, for our purpose it suffices that expenses of this kind will be incurred, and that regulated utilities will be entitled to recover them.
If regulators continue to collect all but a very small percentage of residential rev-enues from usage charges, these findings also suggest something of a dilemma for California’s ratemaking policy—which has been heavily focused on perceived equity impacts. Raising upper-tier rates to recover GHG compliance costs would increase the worst distortions of the current ratemaking approach, and put even greater pressure on those customers to cut back on usage of electricity that is actually quite valuable to them. Viewed strictly from the standpoint of global warming concerns, raising lower-tier and low-income usage rates would be more economically justified.9
Acknowledgements The author acknowledges helpful discussions with Robin Walther, Phillip McLeod, and Veronique Bugnion. Helpful comments were received from Michael Crew, two anonymous referees, and participants in the 21stAnnual Western Conference of the Rutgers University Center for Research in Regulated Industries, Monterey, California, June 18–20, 2008.
References
Borenstein, S. (2008a).The market value and cost of solar photovoltaic electricity production. University of California Energy Institute working paper 176. January, 2008.
Borenstein, S. (2008b). Equity effects of increasing-block electricity pricing. University of California Energy Institute CSEM WP 180. November, 2008.
Bushnell, J. B., & Mansur, E. T. (2004).Consumption under noisy price signals: A study of electricity retail rate deregulation in San Diego. University of California Energy Institute PWP-082R. November, 2004.
California Air Resources Board (2007). California greenhouse gas inventory. Accessed January 14, 2009, from http://www.arb.ca.gov/cc/inventory/data/tables/rpt_inventory_sector_ activity_2007-11-19.pdf. November 19, 2007.
California Air Resources Board (2008). Climate change draft scoping plan. October 2008 draft, as adopted by the CARB on December 11, 2008.
California Legislature (2001).Assembly Bill ABX1 1. Keeley, Chapter 4, Statutes of 2001.
California Legislature (2006).Assembly Bill 32, the Global Warming Solutions Act of 2006. Nunez, Chapter 488, Statutes of 2006.
California Public Utilities Commission (2004).Decision 04-06-015. June 9, 2004. California Public Utilities Commission (2008).Resolution E-4214. December 18, 2008.
California Public Utilities Commission (2009).Rates charts and tables—electricity: Average bundled customer rates by class. Accessed January 22, 2009, fromhttp://www.cpuc.ca.gov/PUC/energy/ Electric+Rates/ENGRD/ratesNCharts_elect.htm. January 20, 2009.
Hausman, J., Tardiff, T., & Belinfante, A. (1993). The effects of the breakup of AT&T on telephone penetration in the United States.American Economic Review, 83(2), 178–184.
Lawrence Berkeley National Laboratory (2008).Reading the tea leaves: How utilities in the west are managing carbon regulatory risk in their resource plans. March, 2008, report LBNL-44E. Massachusetts Institute of Technology (2007).The future of coal: Options for a carbon-constrained
World, MIT.http://web.mit.edu/coal/The_Future_of_Coal.pdf. Accessed January 21, 2009. Nordhaus, W. (2007).The challenge of global warming: economic models and environmental policy.
Accessed March 21, 2008, fromhttp://nordhaus.econ.yale.edu/dice_mss_072407_all.pdf. July 24, 2007.
Point Carbon (2009). Point carbon EUA OTC Assessment. Accessed January 16, 2009, from http:// www.pointcarbon.com. January 16, 2009, 13.25 euros/ton.
Sudarshan, A., & Sweeney, J. (2008).Deconstructing the ‘Rosenfeld Curve’. Precourt Institute for Energy Efficiency working paper, Stanford University. Accessed May 26, 2009, fromhttp://piee.stanford.
9 There is recent evidence that the skewed standard residential rate design does little to transfer wealth
edu/cgi-bin/docs/publications/sweeney/Deconstructing%20the%20Rosenfeld%20Curve.pdf. July 1, 2008.
U.S. Census Bureau (2008). State and county quickfacts. Accessed January 15, 2009, from http:// quickfacts.census.gov/qfd/states/00000.html. Revised July 25, 2008.
U.S. Department of Energy (2007).Cost and performance baseline for fossil energy plants. Accessed January 21, 2009, from http://www.netl.doe.gov/energy-analyses/pubs/Bituminous%20Baseline_ Final%20Report.pdf. August, 2007, DOE/NETL-2007/1281.
U.S. Energy Information Administration (2007a).U.S. electric power industry estimated emissions by state (EIA-767 and EIA-906). Accessed January 14, 2009, from http://www.eia.doe.gov/cneaf/ electricity/epa/epat5p1.html. Released October 26, 2007.
U.S. Energy Information Administration (2007b)Electric power annual with data for 2006. U.S. Electric Industry Total Retail Sales by State. Accessed January 15, 2009, fromhttp://www.eia.doe.gov/ cneaf/electricity/epa/fig7p2.html. Released October 22, 2007.
U.S. Energy Information Administration (2007c).Energy market and economic impacts of S. 280, the Climate Stewardship and Innovation Act of 2007. Accessed January 16, 2009, fromhttp://www. eia.doe.gov/oiaf/servicerpt/csia/. August, 2007.