Fakultas Ekonomi Universitas Syiah Kuala
Banda Aceh, 21-22 Juli 2011
ROE and EVA: Could They Explain Concurrently in
Stock Return Association Model?
Sumiyana
(University of Gadjah Mada)
Hendrian
(OpenUniversity Indonesia)
Abstract
Based on empirical theories, EVA could explain better than ROE because it shows wealth creation to shareholders. However, it is still in a contradiction. This study investigates reliability of ROE and EVA in accordance with stock return model. They should explain concurrently in the association of accounting fundamentals and stock return if they are reliable measurement. This study finds that combination of ROE and EVA could not explain stock return variations. This study also finds that combination of high ROE and high EVA could not explain higher stock return variations than others. It means that EVA accompanied by ROE
could not show the stockholders’ wealthfares. Finally, because of their
inconcurrency, this study suggests that they are factually weak and
indifference in their ability to show stockholders’ wealth creation when
they are investigated in a stock return association model.
Keywords: EVA, ROE, wealth creation, earnings yield, book value, growth opportunities.
Fakultas Ekonomi Universitas Syiah Kuala
Banda Aceh, 21-22 Juli 2011
2
1. Introduction
Company value is created when the company book value exceeds its cost of capital (Black, Wright and Davies, 2001). This increase shows wealth creation magnitude, and it was expected by stockholders. The two current accepted measurements of wealth creation are ROE (return on equity) as the popular measure or EVA (economic value added) as the modern one. EVA is considered to be better than ROE because it adds internal firm performance to measure the increases of stockholder’s wealth. Likewise, the EVA’s calculation process considers economic profit (Wet and Toit, 2006). On the contrary, ROE user group still contributes as the best indicator because return on invested capital should always be increased and the cost of capital should always be decreased (Black, Wright and Davies, 2001).
Currently, the two stockholder’s wealth additional value measure, ROE and EVA, are competing to show their usefulness reliability in performance measurement. Meanwhile, the role of fundamental accounting still shows association degree to stock price or return. The most modern empirical theory based fundamental accounting and stock return association is come from Chen and Zhang (2007) which is associates positively four-related cash inflows, namely earnings yield, book value, profitability, and growth opportunities. This four-related cash inflow is undisputable in explaining stock return movement.
This study’s purpose is to identify ROE and EVA role contradiction or harmony by
means of evaluating in return association based model (Chen and Zhang, 2007). ROE and
EVA’s establishment level should be in harmony with various accounting fundamental and stock return association degrees. In contradiction, ROE and EVA also could establish an inverse in explaining return association model. It means, ROE could explain return
association model for a group of certain company meanwhile EVA couldn’t, and so do the
opposite. In other words, this study examines the superiority among ROE and EVA in
Fakultas Ekonomi Universitas Syiah Kuala
Banda Aceh, 21-22 Juli 2011
3 This study becomes so important or dominantly contributes because of the ROE and
EVA’s discordance as the company financial performance measure and concerning the stockholder’s wealth creation. If stockholder’s wealth measurement is not so important, this study is still needed because it can identifies the stockholder’s wealth increases trigger
factors (main mover) or stock’s market value. Finegan (1991), Stern (1993), O’Byrne (1996), Dodd and Chen (1996), Makelainen (1998) and Biddle, Bowen and Wallace (1999) suggest the importance of company internal performance measurement identification which
affects stock’s market value performance. Moreover, company internal performance
measurement in accordance with company market value is empirically proved that their relationship is standard (Black, Wright, and Davies, 2001).
This study is based on these assumptions. First, company internal performance measure is linear-related to the company market value. This assumption considers that fundamental accounting based measurement associates with company market value or has a coherency value. Second, capital market in semi-strong hypothesis category which fundamental accounting information is reflected into the stock price. This assumption is used because it explains as if fundamental accounting information is the only one that explains stockholder’s wealth value. These two assumptions are used because this study is
based on Chen and Zhang’s return association model (2007).
2. Literature Review and Hypothesis Development
ROE, Its excellences, and Weaknesses
Fakultas Ekonomi Universitas Syiah Kuala
Banda Aceh, 21-22 Juli 2011
4 used for measuring company value performance in the meaning of wealth achievement (Firer, Ross, Westerfield and Jordan, 2004).
Currently, ROE is still used by managements and investors because it is seen practical and has excellence. Its excellence is on simplicity of measuring, requiring as a future investment project parameter, and could identify that the current investment has a high investment return exceeds its cost of capital equity at once. Some managements still commit using ROE because with its third excellence has showed that if the exceeds of return and cost of capital is positive, it shows that in ruining the business, company has a gain in form of certainty growth opportunities (Reimann, 1989, de Wet and du Toit, 2007). Likewise, that condition is also consequent to the management which always has to increase its return and decreased its cost of capital interest rate (Black, Wright and Davies, 2001).
Behind its excellences, ROE has weaknesses in form as following. First, ROE is measured in generally accepted accounting principles based accounting earnings (Reimann, 1989, de Wet and du Toit, 2007). In that measurement, policies and accounting
methods affect ROE’s magnitude. Second, ROE measurement is very weak because inside of it, there is assets turnover measurement which contained inflation. Therefore, ROE’s
magnitude is tended to increase because sales is affected by inflation, meanwhile capital book value does not affected inflation (Rappaport, 1986). Third, ROE is also affects on
Fakultas Ekonomi Universitas Syiah Kuala
Banda Aceh, 21-22 Juli 2011
5 Although, ROE measurement has some weaknesses as in case, ROE is still currently used as company internal performance measure and in accordance with stockholder’s wealth measure. Consequently, the existence of ROE as performance measure needs to be investigated its relevance level in return association model. ROE should explain return association model degree.
EVA, Its excellence and Weaknesses
EVA emerges as the most modern company financial performance measure. The emerging of EVA is resulted from ROE’s weaknesses aforementioned. Besides that, EVA has excellences as follows. First, EVA considers cost of capital equity because of fixed equity capital still needs capital interest or it means no free (Jensen and Meckling, 1999, de Wet and du Toit, 2007).
Second, EVA moves simultaneously with SVA (shareholder value added). This EVA and SVA movement conformity has been empirically proved that EVA is really could show the creation of stockholder wealth (Jensen and Meckling, 1999, Stewart III, 2003, and de Wet and du Toit, 2007). In other words, the excellences of EVA are properly the same with its ability to show economic profit. It means, EVA formulates economics profit which is calculated from accounting profit reduces by cost of capital equity.
Currently, many EVA weaknesses have not been identified. Actually, EVA weaknesses are also not a good performance measurer. Mangers which are focus to EVA
wouldn’t accept projects that have negative value of EVA. Although, this negative value of
Fakultas Ekonomi Universitas Syiah Kuala
Banda Aceh, 21-22 Juli 2011
6
ROE, EVA and Return Association Model
The association model between company fundamental value and the newest stock price is suggested by Chen and Zhang (2007). The study provided theory and also empirical evidences at once that stock return is function of accounting variables, specifically is consisted of earnings yield, capital equity, profitability, growth opportunities and cost of debt and capital discount rate. Reasoning the Chen and Zhang research (2007) is that company equity value contains assets value and growth opportunities in the future.
The return association model actually describes equity appraisal model. Company equity appraisal model for the first time correlated accounting data information and future
cash flow prospects. This model’s approach refers to Ohlson (1995), and Feltham and Ohlson (1995; 1996). The model took scale and profitability reasoning. In details, scaling and profitability is current condition function and future potential. Therefore, earnings role becomes so important because it could shows company growth tendency or stopping its operation.
Appraisal model is a measurement process of capital equity investment creation in
company’s growth framework or operation stopped (Burgstahler and Dichev, 1997).
Zhang’s equity appraisal model (2000) simplified company’s growth framework or
operating stopped.
Fakultas Ekonomi Universitas Syiah Kuala
Banda Aceh, 21-22 Juli 2011
7
Hypothesis Development
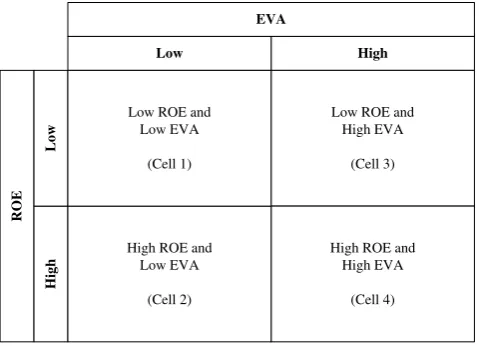
Using the return association model, this study examines the harmony and contradiction between ROE and EVA. ROE and EVA should consistent in various return association model clusters. This study divided ROE and ROA by ranked, high level and low level. Therefore, the cluster is divided into four cells, High-ROE and High-EVA, High-ROE and Low-EVA, Low-ROE and High-EVA, and Low-ROE and Low-EVA. Meanwhile, the standardized return association model that earnings yield, equity capital, profitability, growth opportunities associate positively to stock return. If ROE and EVA have high validity as company internal accounting performance and stockholder wealth performance measurer, ROE and EVA should consistent in explaining the four related cash flow factors in relation with stock return. In other words, ROE and EVA could explain association degree model return in the combination from both of them. If ROE and EVA could show those things, High-ROE and High-EVA have the highest association degree in explaining four-related cash flow relates to return. Thereby, this study hypothesized as follows.
HA: ROE and EVA level combination could shows association degree the four related cash flows factors synchronous or concurrent in four stock return association cluster model, and furthermore High-ROE and High-EVA combination has higher association degree than the others.
3. Research Method
Data and Sampling Method
Fakultas Ekonomi Universitas Syiah Kuala
Banda Aceh, 21-22 Juli 2011
8 (Hang Seng, Hong Kong Monetary Authority), Australia (ASX 200, Reserve Bank of Australia), Pakistan (Karachi 100, State Bank of Pakistan), Sri Langka (Colombo SE, Sri
Langka’s Central Bank), Thailand (SET, Bank of Thailand), Philippines (PSEi, Bangko Sentral ng Pilipinas), Vietnam (Ho Chi Minh SE, The State Bank of Vietnam), Bangladesh (DSE, Central Bank of Bangladesh), Mongolia (MSE, Bank of Mongolia), and USA (NYSE, Federal Reserve Bank).
From all factors which determines return model in this study using financial statement data. These data generally have been presented in OSIRIS database. Specifically, equity interest rate growth was obtained from each countries central bank, although every company financial statement presented its long term debt interest rate or obligations. Discount rate growth proxy with long term obligation interest rate based on each central bank. Then, this study has extracted stock price and return for each companies from each
country’s capital markets directly.
Sampling has been done with fulfillment of some criteria as follows. In accounting scope, first, sampling selection is for manufacturing and merchandising companies or by eliminating financing companies and banks. Second, sampling selection is for companies that have complete data. This data completeness mainly is time to time stock price. Third, this study eliminates negative earnings, negative ROE and negative EVA. The elimination is intended to keep fundamental accounting information association stable to stock return.
Variables Measurement and Examination
EVA is calculated using earning after tax reduced by specific year discount rate which is
multiplied by stock’s book value and numbers of outstanding stocks. Whereas, ROE is
calculated by earnings after tax divided by stock’s book value multiplied by number of outstanding stocks. Then, this study rides Chen and Zhang return association model (2007) which has done linear regression examination as follows:
it it it
it it
it x g b g e
Fakultas Ekonomi Universitas Syiah Kuala
Banda Aceh, 21-22 Juli 2011
9 in explanation, Rit is yearly company stock return i in period t, it is measured since the first
day of beginning year period t-1 until one day after financial statement publication or, if any, earnings announcement period t; xit is earnings that generated by company i in period
t, calculated with earnings that generated by common stockholder in period t(Xit) divided by
capital equity market value in the beginning current period (Vit-1); gˆit= (qit-qit-1)Bit-1/Vit-1 is the changes of company’s profitability i in period t, which is deflated with book value in the beginning of current period and profitability that calculated with formula qit = Xit/bit-1;
Chen and Zhang return model (2007) is used to examine each combination groups between ROE and EVA. Groups is divided into four clusters, that is dividing sample into two using median value as cutoff. Next, this study has done sensitivity test based on ratio market to book value (M/B ratio) which divided in low, medium, and high category. The examination of those four clusters is in Picture 1 as follows.
--- Insert Picture 1 about here ---
4. Analysis, Discussion and Findings
Fakultas Ekonomi Universitas Syiah Kuala
Banda Aceh, 21-22 Juli 2011
10
Descriptive Statistics
This study obtained sample data 3,958 (5,48%) of 72.285 (100,00%) exist population target. The data population is obtained from all capital markets that established in Asia, Australia, and USA. Sample data for the years 2007-2009. Reducing some data out of population based is caused by such factors as follows. First, the data incompleteness of stock price or stock return 40,655 (56,24%). Second, elimination of loss companies 27,672 (38,28%). The decrease of data amount is caused of those two factors 68,327 (94,52%). So do the elimination for companies for negative book value or there was decreasing negative book value has been done based on two previous criteria. Complete data is presented in table 1 as follows.
---
Insert Table 1 about here and its notes ---
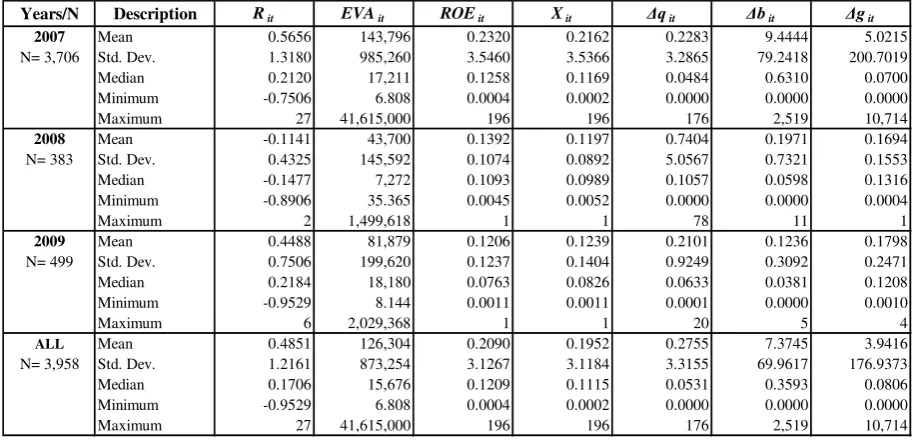
The descriptive statistics result showed in Table 3. Descriptive data processing interpretation shows things as follows. Because of this study bounds for positive earnings, ROE and EVA, descriptive statistics for entire data have positive value except for stock return. One year period return (Rit) which is shown the mean value 0,4851 (total sample).
For data earnings that use earnings after tax (xit), this study bounds for profitable companies
only. As a result, ROE, EVA and earnings value (in total sample) always greater than zero, and minimum value for earnings is marked with magnitude closed to 0,0000. The mean value is 0,2090 and standard deviation is 3,1267. The others variables conditions, changes in profitable ability (Δqit), changes in book value (Δbit), and changes in growth
opportunities (Δgit) relatively shown movements as same as earnings movement.
Fakultas Ekonomi Universitas Syiah Kuala
Banda Aceh, 21-22 Juli 2011
11 ---
Insert Table 2 about here and its notes ---
Analysis Results
The four factors that associated to return in Chen and Zhang model (2007) are earnings (xit), changes in company’s book value (Δbit), changes in profitable ability (Δqit), and
changes in growth opportunities (Δgit). Moreover, ROE and EVA which is used as clusters
sharing basis and each rides the return association model. Partitioning value basis is median value for each ROE and EVA. This based model analysis results is presented in Table 3 as follows.
---
Insert Table 3 about here and its notes ---
Table 3 analysis result shows that the four type of cash flow were not able fully explain stock return. However, only one related cash flow could explain stock price variance. This study is reasonable because it is using at least one out of four type of related cash flow as the ROE and EVA synchronous or concurrency determiner in association model return. Low ROE and low EVA cluster, change in earnings power (Δqit) and change
in growth opportunities (Δgit) positively associates to return and significant at 1% level. So
do high ROE and high EVA cluster positively associates to return and significant at 1% level. Meanwhile, at low ROE and high EVA cluster, only change in growth opportunities (Δgit) which shows the association at 1% level. Even there is no related cash flow that
Fakultas Ekonomi Universitas Syiah Kuala
Banda Aceh, 21-22 Juli 2011
12 Using all of four cells for examination is becoming so complex, if it is simplified with using only two clusters, high ROE and high EVA is able to explain higher association degree than low ROE and low EVA cluster, with 3.30% (adj-R2) as compared to 2.41%. In a condition which only comparing two cells, ROE and ROA have a concurrent result in riding association model return. Therefore, the initial hypothesis is supported and it follows on that the ending hypothesis is distinctly could be examined and HA is able to be
supported.
Sensitivity Tests
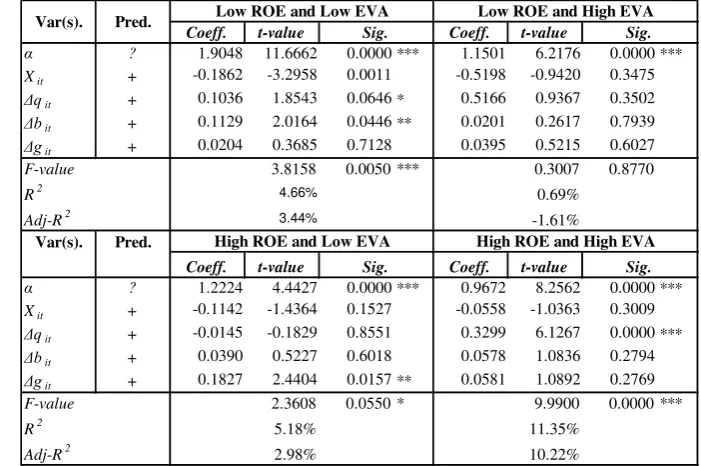
Table 4 analysis result shows portioning P/B ratio based result. Panel A as the low P/B ratio result shows relatively the same result as compared to a whole sample examination as the previous examination did. It means, ROE and EVA combination is not a concurrent result in riding association model return. Therefore, the initial hypothesis is not supported and it follows on that the ending hypothesis is distinctly could not be examined and HA is not
supported as a whole. Further, in a condition which compares two cells only, low ROE and low EVA as compared to high ROE and high EVA, the initial hypothesis is supported and it follows on that the ending hypothesis is distinctly could be examined and HA is able to be
supported.
Panel B for low-medium P/B ratio, the measurement indicates that the difference result. Both low ROE and EVA clusters only change in growth opportunities (Δgit)
positively associates on return and the significant level is 10%. Another that, both high ROE and EVA clusters Meanwhile, in the high ROE and high EVA cluster, earnings (Xit)
and change in growth opportunities (Δgit) positively associates on return and the significant
level is 1% and 10%. Temporarily, in the low ROE and high EVA clusters only change in growth opportunities (Δqit) that indicates associates with the significant level 1%. Even
Fakultas Ekonomi Universitas Syiah Kuala
Banda Aceh, 21-22 Juli 2011
13 first hypothesis is not supported and all subsequent then the ending hypothesis is not tested and alternatives hypothesis as a whole is not supported clearly.
If the testing is simplified using two clusters only are high ROE and high EVA, it can be explained higher degree of association with their competitor both low ROE and EVA that 8.28% (adj-R2) compared with 2.98%. Therefore, in the partition of this P/B ratio, both ROE and ROA produce a concurrent result on riding association return model. After all, the first hypothesis is not supported and all subsequent then the ending hypothesis is not tested and alternatives hypothesis as a whole is not supported clearly.
---
Insert Table 4 about here and its notes ---
Panel C for medium-high P/B ratio, the testing indicates that the result is vice versa with two other preceding testing. Combination between ROE and ROA is not concurrent about the result into be convey of association return model for explaining related cash flow factor on stock return. However, both low ROE and EVA clusters have higher degree of association compared with high ROE and high EVA is 21.93% (adj-R2) is compared with 5.22%. Therefore, first hypothesis is not supported and after that the ending hypothesis clearly cannot be tested and alternative hypothesis as a whole is not supported.
Panel D for high P/B ratio, the testing indicates the similar result relatively with both Panel A and B. Result that non concurrent from combination between ROE and ROA be convey that association return model for explaining related cash flow factors on stock return. Therefore, the first hypothesis is not supported and subsequently the ending hypothesis is also not tested and the last, alternative hypothesis is not tested clearly. Otherwise, the result only compares both low ROE and EVA on high ROE and high EVA indicates supporting on alternatives hypothesis.
Fakultas Ekonomi Universitas Syiah Kuala
Banda Aceh, 21-22 Juli 2011
14 and high P/B ratios. The comparative between degrees of association is 3.44%, 2.19%, 21.93% and 2.43% respectively. This result is not concurrent to be conveying association model return that it was matched by market level base P/B ratio because of the low ROE and high EVA clusters have highest degree of association. Therefore, the first hypothesis is not supported and all subsequent then the ending hypothesis is not tested and alternatives hypothesis as a whole is not supported clearly.
The subsequent association analysis compares both high ROE and EVA clusters into each P/B ratio level. Both high ROE and EVA into low P/B ratio should have lower degree of association into their competitor low-medium, medium-high, and high P/B ratios. The testing result is 10.22%, 8.28%, 5.22%, and 4.17% respectively. This result is vice versa with both low ROE and EVA that they are able to explain with highest degree of association and then the result is not concurrent into be convey of association return model which it is matched with market level base P/B ratio. Therefore, the first hypothesis is not supported and all subsequent then the ending hypothesis is not tested and alternatives hypothesis as a whole is not supported clearly.
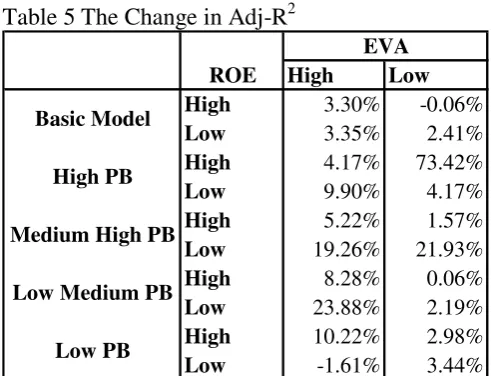
The change in adj-R2 after sensitivity test is summerized in Table 5 as follows. Table 5 indicates that combinations of ROE and EVA shows better adj-R2 except for High EVA-Low ROE under low level PB which shows a decline in adj-R2. Therefore, it can noted that combination of ROE and EVA did not able to show consistent results.
---
Insert Table 5 about here and its notes ---
Findings
This study finds some research’s findings that it different with other research’s findings
Fakultas Ekonomi Universitas Syiah Kuala
Banda Aceh, 21-22 Juli 2011
15 concurrent result in explaining the relationship between four related cash flow factors and stock price variation. Second, combination between ROE and EVA are tested by consider market level into each P/B ratio basic that indicates the similar preceding findings.
Third, testing that compares between P/B ratio levels with another indicates vice versa result. The result indicates that both low ROE and EVA on low level P/B ratio
doesn’t have lower degree of association in its comparative other P/B ratio level. However,
the result on both high ROE and EVA give highest degree of association return model is compared with other P/B ratio level. Therefore, combination between ROE and EVA is not able to concurrently or synchronously explain association of four related cash flow factors on stock price variation.
Fourth, from three preceding findings, these findings can be used to conclude that this research does not support the excellence of EVA that EVA can be able to indicates the wealth creation for stockholders as well as it is required by Jensen and Meckling (1999), Stewart III (2003), and de Wet and du Toit (2007). Therefore, this research does not support on the excellence of ROE that can be called the most common measurement to indicate capital market performance for stockholders (Rappaport, 1986, Firer, Ross, Westerfield and Jordan, 2004, and Monteiro, 2006). In addition, both the measurer of capital market performance internally using ROE and EVA actually is not able to indicate value creation to stockholders. This inability specifically can be indicated when it was investigated using association return model associates with four related cash flow on stock return does not concurrent.
5. Conclusions and Limitations
Conclusions
Fakultas Ekonomi Universitas Syiah Kuala
Banda Aceh, 21-22 Juli 2011
16 describe higher degree of association in the return model compared with both low clusters ROE and EVA. However, test using P/B ratio level shows that similar result for each P/B ratio from low, low-medium, medium-high and high levels. This continuing research compares ROE cluster with EVA to P/B levels basic ratio. Result’s testing indicates that both low ROE and EVA in the P/B low ratio does not have degree of association lower than other level of P/B ratios. Another that, both high ROE and high EVA in the level low of P/B ratio does not give highest degree of association return model comparing with other levels of P/B. Therefore, this study concludes that combination between ROE and EVA is not able to concurrently or synchronously explain stock price variations.
The conclusion above impact consequently that excellence of EVA is able to indicate wealth creation for stockholders is debatable. In addition, the excellence of ROE as
of the most measurement, indicates that firm’s capital market performance is not as well as
to stockholders. Both, ROE and EVA in fact, they are unable to indicate value creation of
wealth stockholder’s when it is investigated by using association return model of four
related cash flow on stock return is not concurrent. In other words, both measurements above are weak and there is no difference when they are used to indicate wealth creation to stockholders.
Limitations
Fakultas Ekonomi Universitas Syiah Kuala
Banda Aceh, 21-22 Juli 2011
17
Third, it has bias about capital market unification in a form of intermediate efficiency to weak efficiency. Although its boundary can be avoided with large market regime concept, but advanced factors in economy, laws, trade and cultural, in sample countries are ignored in this research. In fact, these factors at the preceding sentence can affect return model. At the end, this research has a weakness in using earnings or EAT. Specifically, the weakness does not pay attention on earnings quality. Earnings quality is able to affect degree of association return model. In addition, this issue can be avoided by P/B ratio which is lower tends to firms with good quality earnings.
References
Biddle, G.C., Bowen, R.M. & Wallace, J.S. 1999. ‘Evidence on EVA’, Journal of Applied Company Finance, 12(2):69–79.
Black, A., Wright, P., and Davies, J. 2001. In search of shareholder value. 2nd Edition. London: Pearson.
Burgstahler, D., and Dichev, I. 1997. Earnings, Adaptation, and Equity Value. The Accounting Review, Vol.: 73, pp. 187–215.
Chen, Peter, and Guochang Zhang. 2007. How Do Accounting Variables Explain Stock Price Movements? Theory and Evidence. Journal of Accounting and Economics, Vol.: 43, pp. 219-244.
Copeland, T.E., Koller, T., and Murrin, J. 1996. Valuation: measuring and managing the value of companies. 2nd Edition. New York: Wiley & Sons.
de Wet, J.H.v.H., and E. du Toit. 2007. Return on equity: A popular, but flawed measure of company financial performance. South African Journal of Business Management, Vol.: 38 (1), pp. 59-69.
Dodd, J.L. & Chen, S. 1996. ‘EVA: A new panacea?’, B & E Review, July – September: 26–28.
Feltham, G., and Ohlson, J. 1995. Valuation and Clean Surplus Accounting for Operating and Financing Activities. Contemporary Accounting Research, Vol.: 11, pp. 689–731. Feltham, G., and Ohlson, J. 1996. Uncertain Resolution and The Theory of Depreciation
Measurement. Journal of Accounting Research, Vol.: 34, pp. 209–234.
Finegan, P.T. 1991. ‘Maximizing shareholder value at the private company’, Journal of Applied Company Finance, 4 (1):30-45.
Fakultas Ekonomi Universitas Syiah Kuala
Banda Aceh, 21-22 Juli 2011
18 Jensen, M.C., and Meckling, W.H. 1999. ‘Specific knowledge and divisional performance
measurement’, Journal of Applied Company Finance, 12(2):8-17.
O’Byrne, S.F. 1996. ‘EVA and market value’, Journal of Applied Company Finance,
9(1):116–125.
Ohlson, J. 1995. Earnings, Book Values, and Dividends in Equity Valuation. Contemporary Accounting Research, Vol.: 11, pp. 661–687.
Rappaport, A. 1986. Creating shareholder value. New York: The Free Press.
Reimann, B.C. 1989. Managing for value: a guide to value based strategic management. Oxford: Basil Blackwell.
Stern, J. 1993. ‘Value and people management’, Company Finance, July:35–37.
Stewart III, G.B. 2003. ‘How to fix accounting – measure and report economic profit’,
Journal of Applied Company Finance, 15(3):63-82.
Fakultas Ekonomi Universitas Syiah Kuala
Banda Aceh, 21-22 Juli 2011
19
Picture and Tables:
Picture 1: ROE and EVA Cluster in the Return Association Model Examination
R
O
E
EVA
High Low
H
igh
Low
Low ROE and High EVA
(Cell 3)
High ROE and High EVA
(Cell 4) High ROE and
Low EVA
(Cell 2) Low ROE and
Low EVA
(Cell 1)
Table 1 Data Sample
Number % Number %
1 Population targets 72,285 100.00%
2 Return data unavailable 40,655 56.24% 31,630 43.76%
3 Elimination of negative earnings, ROE and EVA 27,672 38.28% 3,958 5.48%
Total reductions 68,327 94.52%
No Description Decrease Sample
Fakultas Ekonomi Universitas Syiah Kuala
Banda Aceh, 21-22 Juli 2011
20
Table 2 Descriptive Statistics
Years/N Description Rit EVAit ROEit Xit Δqit Δbit Δgit
2007 Mean 0.5656 143,796 0.2320 0.2162 0.2283 9.4444 5.0215
N= 3,706 Std. Dev. 1.3180 985,260 3.5460 3.5366 3.2865 79.2418 200.7019
Median 0.2120 17,211 0.1258 0.1169 0.0484 0.6310 0.0700
Minimum -0.7506 6.808 0.0004 0.0002 0.0000 0.0000 0.0000
Maximum 27 41,615,000 196 196 176 2,519 10,714
2008 Mean -0.1141 43,700 0.1392 0.1197 0.7404 0.1971 0.1694
N= 383 Std. Dev. 0.4325 145,592 0.1074 0.0892 5.0567 0.7321 0.1553
Median -0.1477 7,272 0.1093 0.0989 0.1057 0.0598 0.1316
Minimum -0.8906 35.365 0.0045 0.0052 0.0000 0.0000 0.0004
Maximum 2 1,499,618 1 1 78 11 1
2009 Mean 0.4488 81,879 0.1206 0.1239 0.2101 0.1236 0.1798
N= 499 Std. Dev. 0.7506 199,620 0.1237 0.1404 0.9249 0.3092 0.2471
Median 0.2184 18,180 0.0763 0.0826 0.0633 0.0381 0.1208
Minimum -0.9529 8.144 0.0011 0.0011 0.0001 0.0000 0.0010
Maximum 6 2,029,368 1 1 20 5 4
ALL Mean 0.4851 126,304 0.2090 0.1952 0.2755 7.3745 3.9416
N= 3,958 Std. Dev. 1.2161 873,254 3.1267 3.1184 3.3155 69.9617 176.9373
Median 0.1706 15,676 0.1209 0.1115 0.0531 0.3593 0.0806
Minimum -0.9529 6.808 0.0004 0.0002 0.0000 0.0000 0.0000
Maximum 27 41,615,000 196 196 176 2,519 10,714
Table 3 Results of ROE and EVA Cluster Analysis
Coeff. t-value Coeff. t-value
α ? 0.3255 6.7753 0.0000 *** 0.1687 2.7333 0.0064 ***
Xit + 0.5666 0.8864 0.3756 0.7631 1.1147 0.2653 Δqit + 0.1151 4.1804 0.0000 *** -0.0112 -1.5337 0.1255 Δbit + -0.0002 -0.4734 0.6360 -0.0002 -0.3119 0.7552 Δgit + 0.1499 2.9946 0.0028 *** 0.4691 4.9086 0.0000 ***
8.7100 0.0000 *** 7.3169 0.0000 ***
2.72% 3.88%
2.41% 3.35%
Var(s). Pred.
Coeff. t-value Coeff. t-value
α ? 0.5671 8.6923 0.0000 *** 0.5126 11.0536 0.0000 ***
Xit + -0.0771 -1.3806 0.1678 0.1820 1.5047 0.1326 Δqit + 0.0900 1.4652 0.1433 0.1956 5.6439 0.0000 *** Δbit + 0.0000 0.0230 0.9817 0.0005 1.3068 0.1915 Δgit + 0.0002 1.1184 0.2638 0.1222 2.6516 0.0081 ***
F-value 0.8869 0.4710 11.6459 0.0000 ***
0.49% 3.61%
-0.06% 3.30%
High ROE and High EVA
Sig.
Var(s). Pred. Low ROE and Low EVA
Fakultas Ekonomi Universitas Syiah Kuala
Banda Aceh, 21-22 Juli 2011
21
Table 4 Results of Sensitivity Test with P/B Ratio Portioning
Panel A: Low P/B Ratio
Coeff. t-value Coeff. t-value
α ? 1.9048 11.6662 0.0000 *** 1.1501 6.2176 0.0000 ***
Xit + -0.1862 -3.2958 0.0011 -0.5198 -0.9420 0.3475
α ? 1.2224 4.4427 0.0000 *** 0.9672 8.2562 0.0000 ***
Xit + -0.1142 -1.4364 0.1527 -0.0558 -1.0363 0.3009 Δqit + -0.0145 -0.1829 0.8551 0.3299 6.1267 0.0000 *** Δbit + 0.0390 0.5227 0.6018 0.0578 1.0836 0.2794 Δgit + 0.1827 2.4404 0.0157 ** 0.0581 1.0892 0.2769
F-value 2.3608 0.0550 * 9.9900 0.0000 ***
5.18% 11.35%
Var(s). Pred. Low ROE and Low EVA
R2 Adj-R2
High ROE and Low EVA
Note: N for low ROE and low EVA: 317; low ROE and high EVA: 178; high ROE and low EVA: 178; and high ROE and high EVA: 317.
Panel B: Low-Medium P/B Ratio
Coeff. t-value Coeff. t-value
F-value 1.0332 0.3910 7.2706 0.0000 ***
1.92% 9.60%
Var(s). Pred. Low ROE and Low EVA
R2 Adj-R2
High ROE and Low EVA
Fakultas Ekonomi Universitas Syiah Kuala
Banda Aceh, 21-22 Juli 2011
22
Panel C: Medium-High P/B Ratio
Coeff. t-value Coeff. t-value
α ? 0.0449 0.6425 0.5211 0.1086 1.2552 0.2106
Xit + 0.1419 1.7924 0.0743 * -0.1155 -1.9253 0.0554 Δqit + 0.2359 2.4092 0.0167 ** 0.1976 3.3613 0.0009 *** Δbit + 0.0583 1.0440 0.2975 -0.0057 -0.0968 0.9229 Δgit + 0.1595 1.9145 0.0567 * 0.4139 6.9573 0.0000 ***
18.8358 0.0000 *** 15.2530 0.0000 ***
Xit + 0.1709 2.5627 0.0110 ** 0.1190 1.6814 0.0939 * Δqit + 0.0476 0.7418 0.4589 -0.0794 -1.2974 0.1957 Δbit + 0.0049 0.0763 0.9392 0.0183 0.2986 0.7655 Δgit + 0.0025 0.0379 0.9698 0.1640 2.3135 0.0215 **
F-value 1.9527 0.1030 * 4.4838 0.0020 ***
3.22% 6.72%
Var(s). Pred. Low ROE and Low EVA Low ROE and High EVA
Sig. Sig.
α ? -0.0834 -1.9462 0.0526 * -0.2051 -4.5154 0.0000 ***
Xit + 0.2002 3.2874 0.0011 *** 0.2905 4.0423 0.0001 *** Δqit + -0.0441 -0.7417 0.4589 -0.1525 -2.2632 0.0247
F-value 138.3974 0.0000 *** 4.1853 0.0030 ***
73.95% 5.48%
Var(s). Pred. Low ROE and Low EVA Low ROE and High EVA
Sig. Sig.
Fakultas Ekonomi Universitas Syiah Kuala
Banda Aceh, 21-22 Juli 2011
23 Table 5 The Change in Adj-R2
ROE High Low High 3.30% -0.06%
Low 3.35% 2.41%
High 4.17% 73.42%
Low 9.90% 4.17%
High 5.22% 1.57%
Low 19.26% 21.93%
High 8.28% 0.06%
Low 23.88% 2.19%
High 10.22% 2.98%
Low -1.61% 3.44%
EVA
Basic Model
High PB
Medium High PB
Low Medium PB