Lampiran 1 : Kuesioner Penelitian
KUESIONER PENELITIAN
PENGARUH FAKTOR DEMOGRAFI DAN PERAWATAN ANTENATAL
TERHADAP KEJADIAN BAYI BERAT LAHIR RENDAH
DI KELURAHAN LAU CIH
TAHUN 2012
No. Kuisioner
:
Tanggal wawancara :
Jawablah seluruh pertanyaan dibawah ini dengan sebenarnya:
1. Nama responden
:
2. Alamat tempat responden berdomisili sekarang
:
4. Apakah pendidikan terakhir responden: ...
5. Berapakah jarak kelahiran antara anak terakhir dengan anak sebelumnya: ... Bulan
6. Berapakah jumlah anak yang hidup yang pernah dilahirkan Ibu ... orang
7. Penghasilan / pendapatan keluarga perbulan adalah Rp ...
8. Kapankah pertama kali ibu datang ketenaga kesehatan untuk memeriksakan
kehamilannya:
a. Segera setelah tidak datang haid
b. Sebelum kehamilan 3 bulan
c. Kehamilan 4 – 6 bulan
d. Kehamilan 7 – 9 bulan
9. Isilah pertanyaan dibawah ini sesuai dengan tindakan yang anda lakukan selama
kehamilan.
Berapa kalikah selama kehamilan ibu memeriksakan kehamilan:
a. Kehamilan 0 bulan - 3 bulan (... kali)
b. Kehamilan 4 bulan – 6 bulan ( ... kali )
10. Cek list pilihan dibawah ini terhadap tindakan yang anda terima setiap
memeriksakan kehamilan.
Setiap kali anda datang ketenaga kesehatan ( Klinik bersalin, balai Pengobatan,
Rumah Sakit) untuk memeriksakan kehamilan tindakan apa yang selalu diterima:
NO
TINDAKAN
TRIMESTER I
(Kehamilan
1–12 minggu)
Trimester II
(Kehamilan
13-24 minggu)
Trimester III
(Kehamilan
> 24 minggu
01
Timbang berat badan
02
Ukur tekanan darah
03
Imunisasi Tetanus toksoid
04
Diukur tinggi fundusuteri
05
Diberi tablet zat besi
10. Chek List (
√)
jawaban dibawah ini sesuai dengan keadaan yang pernah dialami
Ibu selama hamil:
No
Komplikasi Kehamilan
Ya
Tidak
01
Mules sebelum 9 bulan
03
demam yang tinggi
04
Keputihan
05
kejang-kejang
06
Pingsan
12. Berapakah berat lahir bayi anda yang dilahirkan terakhir ... gram
13. Ukuran LLA ( Lingkar lengan atas ) sesuai dengan data yang ada pada KMS
(diisi oleh petugas) ... cm
Lampiran 3 : Uji Validitas dan Reliabilitas
Reliability
Ca se P rocessing Sum ma ry
30 100,0
0 ,0
30 100,0
Valid Ex cludeda
Total Cases
N %
Lis twis e deletion based on all variables in the procedure. a.
Reliability Statistics
,906 13
Cronbach's
Alpha N of Items
Item Statistics
Mean Std. Deviation N
Item-Total Statistics
8,67 14,299 ,507 ,904
8,53 14,051 ,705 ,895
8,57 13,633 ,803 ,891
8,70 13,803 ,638 ,898
8,60 14,179 ,586 ,900
8,60 13,697 ,742 ,893
8,63 13,826 ,671 ,896
8,63 14,309 ,522 ,903
8,53 14,533 ,538 ,902
8,70 13,872 ,618 ,899
8,67 13,540 ,736 ,893
8,60 14,524 ,479 ,905
8,57 14,461 ,526 ,902
p1
Scale Mean if Item Deleted Alpha if Item Deleted
Scale Sta tisti cs
9,33 16,368 4,046 13
Lampiran 4 : Hasil Statistik
Lampiran 4.1 : Analisis Univariat
Umur Ibu
Frequency
Percent
Valid Percent
Cumulative
Frequency
Percent
Valid Percent
Cumulative
Frequency
Percent
Valid Percent
Cumulative
Frequency Percent Valid Percent
Valid segera setelah tidak datang
Frequency
Percent
Valid Percent
Cumulative
Percent
Valid
melakukan
56
82.4
82.4
82.4
tidak melakukan
12
17.6
17.6
100.0
Total
68
100.0
100.0
usia keha mila n
19 86,4 86,4 86,4
2 9,1 9,1 95,5
1 4,5 4,5 100,0
22 100,0 100,0
keham ilan 0 bulan -3 bulan keham ilan 4 bulan - 6 bulan keham ilan 7 bulan - 9 bulan Total
Valid
Frequency Percent Valid P erc ent
usia keha mila n
41 89,1 89,1 89,1
3 6,5 6,5 95,7
2 4,3 4,3 100,0
46 100,0 100,0
keham ilan 0 bulan -3 bulan keham ilan 4 bulan - 6 bulan keham ilan 7 bulan - 9 bulan Total
Valid
Frequency Percent Valid P erc ent
Cumul ative Percent
Jumlah Kunjungan
Frequency
Percent
Valid Percent
Cumulative Percent
Valid
>= 4 kali
46
67.6
67.6
67.6
< 4 kali
22
32.4
32.4
100.0
Total
68
100.0
100.0
Timbang berat badan
2 9,1 9,1 9,1
20 90,9 90,9 100,0
22 100,0 100,0
Tidak Ya Total Valid
Frequency Percent Valid Percent
ukur tekanan darah
4 18,2 18,2 18,2
18 81,8 81,8 100,0
22 100,0 100,0
Tidak Ya Total Valid
Frequency Percent Valid Percent
Cumulative Percent
imunisasi tetanus toksoid
20 90,9 90,9 90,9
2 9,1 9,1 100,0
22 100,0 100,0
Tidak Ya Total Valid
Frequency Percent Valid Percent
Cumulative Percent
diukur tinggi fundusuteri
21 95,5 95,5 95,5
1 4,5 4,5 100,0
22 100,0 100,0
Tidak Ya Total Valid
Frequency Percent Valid Percent
Cumulative Percent
diberi tablet zat besi
3 13,6 13,6 13,6
19 86,4 86,4 100,0
22 100,0 100,0
Tidak Ya Total Valid
Frequency Percent Valid Percent
Cumulative Percent
Kualitas Antenatal
Frequency
Percent
Valid Percent
Frequency
Percent
Valid Percent
Cumulative Percent
Valid
LILA >= 23,5
43
63.2
63.2
63.2
LILA < 23,5
25
36.8
36.8
100.0
Total
68
100.0
100.0
Jarak Kehamilan
Frequency
Percent
Valid Percent
Cumulative Percent
Valid
>= 24 bulan
47
69.1
69.1
69.1
< 24 bulan
21
30.9
30.9
100.0
Total
68
100.0
100.0
Paritas
Frequency
Percent
Valid Percent
Cumulative Percent
Valid
2-3 orang
52
76.5
76.5
76.5
> 3 orang
16
23.5
23.5
100.0
Total
68
100.0
100.0
Perdarahan
Frequency Percent Valid Percent Cumulative Percent
Valid tidak 60 88.2 88.2 88.2
ya 8 11.8 11.8 100.0
Total 68 100.0 100.0
Demam yang tinggi
Frequency Percent Valid Percent Cumulative Percent
ya 2 2.9 2.9 100.0
Total 68 100.0 100.0
Mules sebelum 9 bulan
Frequency Percent Valid Percent Cumulative Percent
Valid tidak 65 95.6 95.6 95.6
ya 3 4.4 4.4 100.0
Total 68 100.0 100.0
keputihan
Frequency Percent Valid Percent Cumulative Percent
Valid tidak 57 83.8 83.8 83.8
ya 11 16.2 16.2 100.0
Total 68 100.0 100.0
kejang-kejang
Frequency Percent Valid Percent Cumulative Percent
Valid tidak 67 98.5 98.5 98.5
ya 1 1.5 1.5 100.0
Total 68 100.0 100.0
pingsan
Valid tidak 67 98.5 98.5 98.5
ya 1 1.5 1.5 100.0
Total 68 100.0 100.0
Komplikasi
Frequency
Percent
Valid Percent Cumulative Percent
Valid
tidak ada
52
76.5
76.5
76.5
ada
16
23.5
23.5
100.0
Total
68
100.0
100.0
Bayi Berat Lahir Rendah
Frequency
Percent
Valid Percent
Cumulative Percent
Valid
>= 2500 gram
54
79.4
79.4
79.4
< 2500 gram
14
20.6
20.6
100.0
Lampiran 4.2: Hubungan Variabel Utama dengan BBLR
Umur Ibu * Bayi Berat LAhir Rendah
Crosstab
Bayi Berat LAhir Rendah
Total
>= 2500 gram < 2500 gram
Umur Ibu
20-35 tahun
Count
40
10
50
% within Umur Ibu
80.0%
20.0%
100.0%
% within Bayi Berat
LAhir Rendah
74.1%
71.4%
73.5%
% of Total
58.8%
14.7%
73.5%
< 20 tahun atau >
35 tahun
Count
14
4
18
% within Umur Ibu
77.8%
22.2%
100.0%
% within Bayi Berat
% of Total
20.6%
5.9%
26.5%
Total
Count
54
14
68
% within Umur Ibu
79.4%
20.6%
100.0%
% within Bayi Berat
LAhir Rendah
100.0%
100.0%
100.0%
% of Total
79.4%
20.6%
100.0%
Chi-Square Tests
Value df
Asymp. Sig. (2-sided)
Exact Sig.
(2-sided) Exact Sig. (1-sided)
Pearson Chi-Square .040a
1 .842
Continuity Correctionb .000 1 1.000
Likelihood Ratio .040 1 .842
Fisher's Exact Test 1.000 .542
Linear-by-Linear Association .039 1 .843
N of Valid Casesb 68
a. 1 cells (25.0%) have expected count less than 5. The minimum expected count is 3.71.
b. Computed only for a 2x2 table
Pendidikan * Bayi Berat Lahir Rendah
Crosstab
Bayi Berat LAhir Rendah
Total
>= 2500 gram < 2500 gram
Pendidikan
Tinggi
(SMA/Diploma/PT)
Count
41
9
50
% within Bayi Berat
LAhir Rendah
75.9%
64.3%
73.5%
% of Total
60.3%
13.2%
73.5%
Rendah (SD dan SMP) Count
13
5
18
% within Pendidikan
72.2%
27.8%
100.0%
% within Bayi Berat
LAhir Rendah
24.1%
35.7%
26.5%
% of Total
19.1%
7.4%
26.5%
Total
Count
54
14
68
% within Pendidikan
79.4%
20.6%
100.0%
% within Bayi Berat
LAhir Rendah
100.0%
100.0%
100.0%
% of Total
79.4%
20.6%
100.0%
Chi-Square Tests
Value
Df
Asymp. Sig.
(2-sided)
Exact Sig.
(2-sided)
Exact Sig. (1-sided)
Pearson Chi-Square
.774
a1
.379
a. 1 cells (25.0%) have expected count less than 5. The minimum expected count is 3.71.
Penghasilan * Bayi Berat Lahir Rendah
Crosstab
Bayi Berat LAhir Rendah
Total
>= 2500 gram < 2500 gram
Penghasilan
> = Rp. 1.250.000,- Count
45
5
50
% within Penghasilan
90.0%
10.0%
100.0%
% within Bayi Berat
LAhir Rendah
83.3%
35.7%
73.5%
% of Total
66.2%
7.4%
73.5%
< Rp. 1.250.000,-
Count
9
9
18
% within Penghasilan
50.0%
50.0%
100.0%
% within Bayi Berat
LAhir Rendah
16.7%
64.3%
26.5%
% of Total
13.2%
13.2%
26.5%
Total
Count
54
14
68
% within Penghasilan
79.4%
20.6%
100.0%
% within Bayi Berat
LAhir Rendah
100.0%
100.0%
100.0%
% of Total
79.4%
20.6%
100.0%
Chi-Square Tests
Value
df
Asymp. Sig.
(2-sided)
Exact Sig.
(2-sided)
Exact Sig.
(1-sided)
Pearson Chi-Square
12.952
a1
.000
Continuity Correction
b10.621
1
.001
Likelihood Ratio
11.688
1
.001
Linear-by-Linear
Association
12.762
1
.000
N of Valid Cases
b68
a. 1 cells (25.0%) have expected count less than 5. The minimum expected count is 3.71.
b. Computed only for a 2x2 table
Kunjungan Pertama * Bayi Berat LAhir Rendah
Crosstab
Bayi Berat LAhir Rendah
Total >= 2500 gram < 2500 gram
Kunjungan Pertama Melakukan Count 50 6 56
% within Kunjungan
Pertama 89.3% 10.7% 100.0%
% within Bayi Berat LAhir
Rendah 92.6% 42.9% 82.4%
% of Total 73.5% 8.8% 82.4%
tidak melakukan Count 4 8 12
% within Kunjungan
Pertama 33.3% 66.7% 100.0%
% within Bayi Berat LAhir
Rendah 7.4% 57.1% 17.6%
% of Total 5.9% 11.8% 17.6%
Total Count 54 14 68
% within Kunjungan
% within Bayi Berat LAhir
Rendah 100.0% 100.0% 100.0%
% of Total 79.4% 20.6% 100.0%
Chi-Square Tests
Value
df
Asymp. Sig.
(2-sided)
Exact Sig.
(2-sided)
Exact Sig.
(1-sided)
Pearson Chi-Square
18.923
a1
.000
Continuity Correction
b15.656
1
.000
Likelihood Ratio
15.737
1
.000
Fisher's Exact Test
.000
.000
Linear-by-Linear
Association
18.645
1
.000
N of Valid Cases
b68
a. 1 cells (25.0%) have expected count less than 5. The minimum expected count is 2.47.
b. Computed only for a 2x2 table
Ju
mlah Kunjungan * Bayi Berat LAhir Rendah
Crosstab
Bayi Berat LAhir Rendah
Total
>= 2500 gram
< 2500 gram
Jumlah Kunjungan
>= 4 kali Count
41
5
46
% within Jumlah
Kunjungan
89.1%
10.9%
100.0%
% within Bayi Berat LAhir
Rendah
75.9%
35.7%
67.6%
% of Total
60.3%
7.4%
67.6%
% within Jumlah
Kunjungan
59.1%
40.9%
100.0%
% within Bayi Berat LAhir
Rendah
24.1%
64.3%
32.4%
% of Total
19.1%
13.2%
32.4%
Total
Count
54
14
68
% within Jumlah
Kunjungan
79.4%
20.6%
100.0%
% within Bayi Berat LAhir
Rendah
100.0%
100.0%
100.0%
% of Total
79.4%
20.6%
100.0%
Chi-Square Tests
Value
df
Asymp. Sig.
(2-sided)
Exact Sig.
(2-sided)
Exact Sig.
(1-sided)
a. 1 cells (25.0%) have expected count less than 5. The minimum expected count is 4.53.
b. Computed only for a 2x2 table
Kualitas Antenatal * Bayi Berat LAhir Rendah
Crosstab
Bayi Berat LAhir Rendah
Total >= 2500 gram < 2500 gram
Antenatal % within Kualitas
Antenatal 82.6% 17.4% 100.0%
% within Bayi Berat
LAhir Rendah 70.4% 57.1% 67.6%
% of Total 55.9% 11.8% 67.6%
Tidak Terima Standar 5T
Count 16 6 22
% within Kualitas
Antenatal 72.7% 27.3% 100.0%
% within Bayi Berat
LAhir Rendah 29.6% 42.9% 32.4%
% of Total 23.5% 8.8% 32.4%
Total Count 54 14 68
% within Kualitas
Antenatal 79.4% 20.6% 100.0%
% within Bayi Berat
LAhir Rendah 100.0% 100.0% 100.0%
% of Total 79.4% 20.6% 100.0%
Chi-Square Tests
Value
df
Asymp. Sig.
(2-sided)
Exact Sig.
(2-sided)
Exact Sig.
(1-sided)
a. 1 cells (25.0%) have expected count less than 5. The minimum expected count is 4.53.
Status Gizi * Bayi Berat LAhir Rendah
Crosstab
Bayi Berat LAhir Rendah
Total >= 2500 gram < 2500 gram
Status Gizi LILA >= 23,5 Count 31 12 43
% within Status Gizi 72.1% 27.9% 100.0%
% within Bayi Berat LAhir
Rendah 57.4% 85.7% 63.2%
% of Total 45.6% 17.6% 63.2%
LILA < 23,5 Count 23 2 25
% within Status Gizi 92.0% 8.0% 100.0%
% within Bayi Berat LAhir
Rendah 42.6% 14.3% 36.8%
% of Total 33.8% 2.9% 36.8%
Total Count 54 14 68
% within Status Gizi 79.4% 20.6% 100.0%
% within Bayi Berat LAhir
Rendah 100.0% 100.0% 100.0%
% of Total 79.4% 20.6% 100.0%
Chi-Square Tests
Value
df
Asymp. Sig.
(2-sided)
Exact Sig.
(2-sided)
Exact Sig.
(1-sided)
Pearson Chi-Square
3.832
a1
.050
Continuity Correction
b2.711
1
.100
Fisher's Exact Test
.065
.045
Linear-by-Linear
Association
3.775
1
.052
N of Valid Cases
b68
a. 0 cells (.0%) have expected count less than 5. The minimum expected count is 5.15.
b. Computed only for a 2x2 table
Jarak Kehamilan * Bayi Berat LAhir Rendah
Crosstab
Bayi Berat LAhir Rendah
Total
>= 2500 gram < 2500 gram
Jarak Kehamilan >= 24 bulan Count
40
7
47
% within Jarak Kehamilan
85.1%
14.9%
100.0%
% within Bayi Berat LAhir
Rendah
74.1%
50.0%
69.1%
% of Total
58.8%
10.3%
69.1%
< 24 bulan
Count
14
7
21
% within Jarak Kehamilan
66.7%
33.3%
100.0%
% within Bayi Berat LAhir
Rendah
25.9%
50.0%
30.9%
% of Total
20.6%
10.3%
30.9%
Total
Count
54
14
68
% within Bayi Berat LAhir
Rendah
100.0%
100.0%
100.0%
% of Total
79.4%
20.6%
100.0%
Chi-Square Tests
Value
df
Asymp. Sig.
(2-sided)
Exact Sig.
(2-sided)
Exact Sig.
(1-sided)
a. 1 cells (25.0%) have expected count less than 5. The minimum expected count is 4.32.
b. Computed only for a 2x2 table
Paritas * Bayi Berat LAhir Rendah
Crosstab
Bayi Berat LAhir Rendah
Total
>= 2500 gram
< 2500 gram
Paritas
2-3 orang
Count
40
12
52
% within Paritas
76.9%
23.1%
100.0%
% within Bayi Berat LAhir
Rendah
74.1%
85.7%
76.5%
% of Total
58.8%
17.6%
76.5%
% within Paritas
87.5%
12.5%
100.0%
% within Bayi Berat LAhir
Rendah
25.9%
14.3%
23.5%
% of Total
20.6%
2.9%
23.5%
Total
Count
54
14
68
% within Paritas
79.4%
20.6%
100.0%
% within Bayi Berat LAhir
Rendah
100.0%
100.0%
100.0%
% of Total
79.4%
20.6%
100.0%
Chi-Square Tests
Value
df
Asymp. Sig.
(2-sided)
Exact Sig.
(2-sided)
Exact Sig.
(1-sided)
a. 1 cells (25.0%) have expected count less than 5. The minimum expected count is 3.29.
b. Computed only for a 2x2 table
Komplikasi * Bayi Berat LAhir Rendah
Value
df
Asymp. Sig.
(2-sided)
Exact Sig.
(2-sided)
Exact Sig.
(1-sided)
Pearson Chi-Square
22.480
a1
.000
Continuity Correction
b19.253
1
.000
Likelihood Ratio
19.775
1
.000
Fisher's Exact Test
.000
.000
Linear-by-Linear
Association
22.149
1
.000
Bayi Berat LAhir Rendah
Total
>= 2500 gram
< 2500 gram
Komplikasi tidak ada
Count
48
4
52
% within Komplikasi
92.3%
7.7%
100.0%
% within Bayi Berat LAhir
Rendah
88.9%
28.6%
76.5%
% of Total
70.6%
5.9%
76.5%
ada
Count
6
10
16
% within Komplikasi
37.5%
62.5%
100.0%
% within Bayi Berat LAhir
Rendah
11.1%
71.4%
23.5%
% of Total
8.8%
14.7%
23.5%
Total
Count
54
14
68
% within Komplikasi
79.4%
20.6%
100.0%
% within Bayi Berat LAhir
Rendah
100.0%
100.0%
100.0%
N of Valid Cases
b68
a. 1 cells (25.0%) have expected count less than 5. The minimum expected count is 3.29.
b. Computed only for a 2x2 table
Lampiran 4.3 : Hubungan Variabel independent utama dengan variabel
Confonding
Kunjungan Pertama * Penghasilan
Kunjungan Antenatal Pertama * Penghasilan Crosstabulation
Penghasilan
Total >= Rp 1.250.000 < Rp 1.250.000
Kunjungan Antenatal Pertama
Ya Count 43 13 56
% within Kunjungan
Antenatal Pertama 76.8% 23.2% 100.0%
% within Penghasilan 86.0% 72.2% 82.4%
% of Total 63.2% 19.1% 82.4%
Tidak Count 7 5 12
% within Kunjungan
Antenatal Pertama 58.3% 41.7% 100.0%
% within Penghasilan 14.0% 27.8% 17.6%
% of Total 10.3% 7.4% 17.6%
Total Count 50 18 68
% within Kunjungan
Antenatal Pertama 73.5% 26.5% 100.0%
% within Penghasilan 100.0% 100.0% 100.0%
Chi-Square Tests
Value df
Asymp. Sig. (2-sided)
Exact Sig. (2-sided)
Exact Sig. (1-sided)
Pearson Chi-Square 1.729a 1 .189
Continuity Correctionb .911 1 .340
Likelihood Ratio 1.609 1 .205
Fisher's Exact Test .278 .169
Linear-by-Linear Association 1.703 1 .192
N of Valid Casesb 68
a. 1 cells (25.0%) have expected count less than 5. The minimum expected count is 3.18.
b. Computed only for a 2x2 table
Jumlah Kunjungan * Penghasilan
Jumlah Kunjungan * Penghasilan Crosstabulation
Total Count 50 18 68
Asymp. Sig. (2-sided)
Exact Sig. (2-sided)
Exact Sig. (1-sided)
Pearson Chi-Square .011a
1 .917
Continuity Correctionb .000 1 1.000
Likelihood Ratio .011 1 .918
Fisher's Exact Test 1.000 .569
Linear-by-Linear
Association .011 1 .918
N of Valid Casesb 68
a. 0 cells (.0%) have expected count less than 5. The minimum expected count is 5.82.
b. Computed only for a 2x2 table
Status Gizi * Penghasilan
Penghasilan
Asymp. Sig. (2-sided)
Exact Sig. (2-sided)
Exact Sig. (1-sided)
Pearson Chi-Square 2.227a 1 .136
Continuity Correctionb 1.457 1 .227
Likelihood Ratio 2.347 1 .125
Fisher's Exact Test .164 .112
Linear-by-Linear
Association 2.194 1 .139
N of Valid Casesb 68
a. 0 cells (.0%) have expected count less than 5. The minimum expected count is 6.62.
Jarak Kehamilan * Penghasilan
Jarak Kehamilan * Penghasilan Crosstabulation
Penghasilan
Asymp. Sig. (2-sided)
Exact Sig. (2-sided)
Pearson Chi-Square .735a 1 .391
Continuity Correctionb .314 1 .576
Likelihood Ratio .717 1 .397
Fisher's Exact Test .392 .284
Linear-by-Linear
Association .724 1 .395
N of Valid Casesb 68
a. 0 cells (.0%) have expected count less than 5. The minimum expected count is 5.56.
b. Computed only for a 2x2 table
Komplikasi * Penghasilan
Komplikasi kehamilan * Penghasilan Crosstabulation
Penghasilan
Total >= Rp 1.250.000 < Rp 1.250.000
Komplikasi kehamilan Tidak ada Count 42 10 52
% within Komplikasi
kehamilan 80.8% 19.2% 100.0%
% within Penghasilan 84.0% 55.6% 76.5%
komplikasi Count 8 8 16
% within Komplikasi
kehamilan 50.0% 50.0% 100.0%
% within Penghasilan 16.0% 44.4% 23.5%
% of Total 11.8% 11.8% 23.5%
Total Count 50 18 68
% within Komplikasi
kehamilan 73.5% 26.5% 100.0%
Exact Sig. (2-sided)
Exact Sig. (1-sided)
Pearson Chi-Square 5.951a 1 .055
Continuity Correctionb 4.476 1 .034
Likelihood Ratio 5.503 1 .019
Fisher's Exact Test .073 .080
Linear-by-Linear
Association 5.864 1 .015
N of Valid Casesb 68
a. 1 cells (25.0%) have expected count less than 5. The minimum expected count is 4.24.
Jumlah Kunjungan * Kunjungan Pertama
Jumlah Kunjungan * Kunjungan Antenatal Pertama Crosstabulation
Kunjungan Antenatal Pertama
Total
Ya Tidak
Jumlah Kunjungan >= 4 kali Count 40 6 46
% within Jumlah Kunjungan 87.0% 13.0% 100.0%
% within Kunjungan
Antenatal Pertama 71.4% 50.0% 67.6%
% of Total 58.8% 8.8% 67.6%
< 4 kali Count 16 6 22
% within Jumlah Kunjungan 72.7% 27.3% 100.0%
% within Kunjungan
Antenatal Pertama 28.6% 50.0% 32.4%
% of Total 23.5% 8.8% 32.4%
Total Count 56 12 68
% within Jumlah Kunjungan 82.4% 17.6% 100.0%
% within Kunjungan
Antenatal Pertama 100.0% 100.0% 100.0%
% of Total 82.4% 17.6% 100.0%
Chi-Square Tests
Value df
Asymp. Sig. (2-sided)
Exact Sig. (2-sided)
Exact Sig. (1-sided)
Pearson Chi-Square 2.073a 1 .150
Continuity Correctionb 1.210 1 .271
Likelihood Ratio 1.970 1 .160
Linear-by-Linear
Association 2.043 1 .153
N of Valid Casesb 68
a. 1 cells (25.0%) have expected count less than 5. The minimum expected count is 3.88.
b. Computed only for a 2x2 table
Status Gizi * Kunjungan Pertama
Status Gizi * Kunjungan Antenatal Pertama Crosstabulation
Kunjungan Antenatal Pertama
Total
Ya Tidak
Status Gizi Lila >= 23,5 cm Count 32 11 43
% within Status Gizi 74.4% 25.6% 100.0%
% within Kunjungan
Antenatal Pertama 57.1% 91.7% 63.2%
% of Total 47.1% 16.2% 63.2%
Lila < 23,5 cm Count 24 1 25
% within Status Gizi 96.0% 4.0% 100.0%
% within Kunjungan
Antenatal Pertama 42.9% 8.3% 36.8%
% of Total 35.3% 1.5% 36.8%
Total Count 56 12 68
% within Kunjungan
Antenatal Pertama 100.0% 100.0% 100.0%
% of Total 82.4% 17.6% 100.0%
Chi-Square Tests
Value df
Asymp. Sig. (2-sided)
Exact Sig. (2-sided)
Exact Sig. (1-sided)
Pearson Chi-Square 5.066a 1 .124
Continuity Correctionb 3.690 1 .155
Likelihood Ratio 6.076 1 .114
Fisher's Exact Test .144 .122
Linear-by-Linear
Association 4.992 1 .225
N of Valid Casesb 68
a. 1 cells (25.0%) have expected count less than 5. The minimum expected count is 4.41.
b. Computed only for a 2x2 table
Jarak Kehamilan * Kunjungan Pertama
Jarak Kehamilan * Kunjungan Antenatal Pertama Crosstabulation
Kunjungan Antenatal Pertama
Total
Ya Tidak
% within Jarak Kehamilan 87.2% 12.8% 100.0%
% within Kunjungan
Antenatal Pertama 73.2% 50.0% 69.1%
% of Total 60.3% 8.8% 69.1%
< 24 bulan Count 15 6 21
% within Jarak Kehamilan 71.4% 28.6% 100.0%
% within Kunjungan
Antenatal Pertama 26.8% 50.0% 30.9%
% of Total 22.1% 8.8% 30.9%
Total Count 56 12 68
% within Jarak Kehamilan 82.4% 17.6% 100.0%
% within Kunjungan
Antenatal Pertama 100.0% 100.0% 100.0%
% of Total 82.4% 17.6% 100.0%
Chi-Square Tests
Value df
Asymp. Sig. (2-sided)
Exact Sig. (2-sided)
Exact Sig. (1-sided)
Pearson Chi-Square 2.495a 1 .114
Continuity Correctionb 1.526 1 .217
Likelihood Ratio 2.349 1 .125
Fisher's Exact Test .168 .110
Linear-by-Linear
Association 2.458 1 .117
N of Valid Casesb 68
a. 1 cells (25.0%) have expected count less than 5. The minimum expected count is 3.71.
Komplikasi * Kunjungan Pertama
Komplikasi kehamilan * Kunjungan Antenatal Pertama Crosstabulation
Kunjungan Antenatal Pertama
Total
Ya Tidak
Komplikasi kehamilan Tidak ada Count 47 5 52
% within Komplikasi
kehamilan 90.4% 9.6% 100.0%
% within Kunjungan
Antenatal Pertama 83.9% 41.7% 76.5%
% of Total 69.1% 7.4% 76.5%
komplikasi Count 9 7 16
% within Komplikasi
kehamilan 56.2% 43.8% 100.0%
% within Kunjungan
Antenatal Pertama 16.1% 58.3% 23.5%
% of Total 13.2% 10.3% 23.5%
Total Count 56 12 68
% within Komplikasi
kehamilan 82.4% 17.6% 100.0%
% within Kunjungan
Antenatal Pertama 100.0% 100.0% 100.0%
% of Total 82.4% 17.6% 100.0%
Chi-Square Tests
Value df
Asymp. Sig. (2-sided)
Exact Sig. (2-sided)
Pearson Chi-Square 9.810a 1 .052
Continuity Correctionb 7.601 1 .046
Likelihood Ratio 8.525 1 .074
Fisher's Exact Test .055 .065
Linear-by-Linear Association 9.665 1 .092
N of Valid Casesb 68
a. 1 cells (25.0%) have expected count less than 5. The minimum expected count is 2.82.
b. Computed only for a 2x2 table
Status Gizi * Jumlah Kunjungan
Status Gizi * Jumlah Kunjungan Crosstabulation
Jumlah Kunjungan
Total
Status Gizi * Jumlah Kunjungan Crosstabulation
Jumlah Kunjungan
Total
% within Jumlah Kunjungan 100.0% 100.0% 100.0%
% of Total 67.6% 32.4% 100.0%
Chi-Square Tests
Value df
Asymp. Sig. (2-sided)
Exact Sig. (2-sided)
Exact Sig. (1-sided)
Pearson Chi-Square 2.757a
1 .097
Continuity Correctionb 1.936 1 .164
Likelihood Ratio 2.879 1 .090
Fisher's Exact Test .114 .080
Linear-by-Linear Association 2.716 1 .099
N of Valid Casesb 68
Chi-Square Tests
Value df
Asymp. Sig. (2-sided)
Exact Sig. (2-sided)
Exact Sig. (1-sided)
Pearson Chi-Square 2.757a 1 .097
Continuity Correctionb 1.936 1 .164
Likelihood Ratio 2.879 1 .090
Fisher's Exact Test .114 .080
Linear-by-Linear Association 2.716 1 .099
N of Valid Casesb 68
a. 0 cells (.0%) have expected count less than 5. The minimum expected count is 8.09.
b. Computed only for a 2x2 table
Jarak Kehamilan * Jumlah Kunjungan
Jarak Kehamilan * Jumlah Kunjungan Crosstabulation
Jumlah Kunjungan
Total >= 4 kali < 4 kali
Jarak Kehamilan >= 24 bulan Count 34 13 47
% within Jarak Kehamilan 72.3% 27.7% 100.0%
% of Total 50.0% 19.1% 69.1%
% within Jumlah Kunjungan 100.0% 100.0% 100.0%
% of Total 67.6% 32.4% 100.0%
Chi-Square Tests
Value df
Asymp. Sig. (2-sided)
Exact Sig. (2-sided)
Exact Sig. (1-sided)
Pearson Chi-Square 1.532a 1 .216
Continuity Correctionb .916 1 .339
Likelihood Ratio 1.497 1 .221
Fisher's Exact Test .266 .169
Linear-by-Linear Association 1.509 1 .219
N of Valid Casesb 68
a. 0 cells (.0%) have expected count less than 5. The minimum expected count is 6.79.
Komplikasi * Jumlah Kunjungan
Komplikasi kehamilan * Jumlah Kunjungan Crosstabulation
Jumlah Kunjungan
Total >= 4 kali < 4 kali
Komplikasi kehamilan Tidak ada Count 37 15 52
% within Komplikasi
kehamilan 71.2% 28.8% 100.0%
% within Jumlah Kunjungan 80.4% 68.2% 76.5%
% of Total 54.4% 22.1% 76.5%
komplikasi Count 9 7 16
% within Komplikasi
kehamilan 56.2% 43.8% 100.0%
% within Jumlah Kunjungan 19.6% 31.8% 23.5%
% of Total 13.2% 10.3% 23.5%
Total Count 46 22 68
% within Komplikasi
kehamilan 67.6% 32.4% 100.0%
% within Jumlah Kunjungan 100.0% 100.0% 100.0%
% of Total 67.6% 32.4% 100.0%
Chi-Square Tests
Value df
Asymp. Sig. (2-sided)
Exact Sig. (2-sided)
Exact Sig. (1-sided)
Pearson Chi-Square 1.242a 1 .265
Likelihood Ratio 1.202 1 .273
Fisher's Exact Test .360 .208
Linear-by-Linear Association 1.224 1 .269
N of Valid Casesb 68
a. 0 cells (.0%) have expected count less than 5. The minimum expected count is 5.18.
b. Computed only for a 2x2 table
Jarak Kehamilan * Status Gizi
Jarak Kehamilan * Status Gizi Crosstabulation
Status Gizi
Chi-Square Tests
Value df
Asymp. Sig. (2-sided)
Exact Sig. (2-sided)
Exact Sig. (1-sided)
Pearson Chi-Square 4.102a
1 .053
Continuity Correctionb 3.074 1 .080
Likelihood Ratio 4.373 1 .067
Fisher's Exact Test .058 .067
Linear-by-Linear
Association 4.042 1 .054
N of Valid Casesb 68
a. 0 cells (.0%) have expected count less than 5. The minimum expected count is 7.72.
b. Computed only for a 2x2 table
Komplikasi * Status Gizi
Komplikasi kehamilan * Status Gizi Crosstabulation
Status Gizi
Total Lila >= 23,5 cm Lila < 23,5 cm
% within Komplikasi
kehamilan 59.6% 40.4% 100.0%
% within Status Gizi 72.1% 84.0% 76.5%
% of Total 45.6% 30.9% 76.5%
komplikasi Count 12 4 16
% within Komplikasi
kehamilan 75.0% 25.0% 100.0%
% within Status Gizi 27.9% 16.0% 23.5%
% of Total 17.6% 5.9% 23.5%
Total Count 43 25 68
% within Komplikasi
kehamilan 63.2% 36.8% 100.0%
% within Status Gizi 100.0% 100.0% 100.0%
% of Total 63.2% 36.8% 100.0%
Chi-Square Tests
Value df
Asymp. Sig. (2-sided)
Exact Sig. (2-sided)
Exact Sig. (1-sided)
Pearson Chi-Square 1.246a
1 .264
Continuity Correctionb .672 1 .412
Likelihood Ratio 1.299 1 .254
Fisher's Exact Test .377 .208
Linear-by-Linear
Association 1.227 1 .268
N of Valid Casesb 68
a. 0 cells (.0%) have expected count less than 5. The minimum expected count is 5.88.
Jarak kehamilan * komplikasi
Komplikasi kehamilan * Jarak Kehamilan Crosstabulation
Jarak Kehamilan
Total >= 24 bulan < 24 bulan
Komplikasi kehamilan Tidak ada Count 37 15 52
% within Komplikasi
kehamilan 71.2% 28.8% 100.0%
% within Jarak Kehamilan 78.7% 71.4% 76.5%
% of Total 54.4% 22.1% 76.5%
komplikasi Count 10 6 16
% within Komplikasi
kehamilan 62.5% 37.5% 100.0%
% within Jarak Kehamilan 21.3% 28.6% 23.5%
% of Total 14.7% 8.8% 23.5%
Total Count 47 21 68
% within Komplikasi
kehamilan 69.1% 30.9% 100.0%
Exact Sig. (2-sided)
Pearson Chi-Square .429a 1 .512
Continuity Correctionb .120 1 .729
Likelihood Ratio .419 1 .517
Fisher's Exact Test .546 .358
Linear-by-Linear
Association .423 1 .515
N of Valid Casesb 68
a. 1 cells (25.0%) have expected count less than 5. The minimum expected count is 4.94.
b. Computed only for a 2x2 table
Lampiran 4.4 : PEMERIKSAAN INTERAKSI
Logistic Regression
Case Processing Summary
Unweighted Casesa N Percent
Selected Cases Included in Analysis 68 100.0
Missing Cases 0 .0
Total 68 100.0
Unselected Cases 0 .0
Total 68 100.0
a. If weight is in effect, see classification table for the total number of cases.
Original
Value Internal Value
>= 2500 0
< 2500 1
Block 0: Beginning Block
Classification Tablea,b
Observed
Predicted
Bayi Berat Lahir Rendah
Percentage Correct >= 2500 < 2500
Step 0 Bayi Berat Lahir Rendah >= 2500 54 0 100.0
< 2500 14 0 .0
Overall Percentage 79.4
a. Constant is included in the model.
b. The cut value is ,500
Variables in the Equation
B S.E. Wald df Sig. Exp(B)
Step 0 Constant -1.350 .300 20.260 1 .000 .259
Variables not in the Equation
Score df Sig.
Step 0 Variables Penghasilan 12.952 1 .000
J_kunjung 8.214 1 .004
Status 3.832 1 .050
Jarak 3.019 1 .082
Komplikasi 22.480 1 .000
K1 by Penghasilan 20.816 1 .000
J_kunjung by Penghasilan 15.846 1 .000
Penghasilan by Status .051 1 .822
Jarak by Penghasilan 6.378 1 .012
Komplikasi by Penghasilan 24.828 1 .000
J_kunjung by K1 15.846 1 .000
K1 by Status .263 1 .608
Jarak by K1 8.546 1 .003
K1 by Komplikasi 30.098 1 .000
J_kunjung by Status .001 1 .973
J_kunjung by Jarak 7.757 1 .005
J_kunjung by Komplikasi 20.243 1 .000
Jarak by Status .051 1 .822
Komplikasi by Status .051 1 .822
Jarak by Komplikasi 8.546 1 .003
Block 1: Method = Enter
Omnibus Tests of Model Coefficients
Chi-square df Sig.
Step 1 Step 56.333 21 .000
Block 56.333 21 .000
Model 56.333 21 .000
Model Summary
Step -2 Log likelihood
Cox & Snell R Square
Nagelkerke R Square
1 12.816a .563 .882
a. Estimation terminated at iteration number 20 because maximum iterations has been reached. Final solution cannot be found.
Classification Tablea
Observed
Predicted
Bayi Berat Lahir Rendah
Percentage Correct >= 2500 < 2500
Step 1 Bayi Berat Lahir Rendah >= 2500 53 1 98.1
< 2500 3 11 78.6
Model Summary
Step -2 Log likelihood
Cox & Snell R Square
Nagelkerke R Square
1 12.816a .563 .882
a. The cut value is ,500
Variables in the Equation
B S.E. Wald df Sig. Exp(B)
95,0% C.I.for EXP(B)
Lower Upper
Step 1a Penghasilan 20.209 1.331E4 .000 1 .999 5.982E8 .000 .
K1 .921 2.986E4 .000 1 1.000 2.512 .000 .
J_kunjung -18.259 2.653E4 .000 1 .999 .000 .000 .
Jarak -36.222 2.918E4 .000 1 .999 .000 .000 .
Komplikasi 2.032 2.020E4 .000 1 1.000 7.631 .000 .
K1 by Penghasilan -57.931 8.838E4 .000 1 .999 .000 .000 .
J_kunjung by
Penghasilan .456 2.368E4 .000 1 1.000 1.577 .000 .
Penghasilan by Status -22.030 5.115E4 .000 1 1.000 .000 .000 .
Jarak by Penghasilan 17.414 2.853E4 .000 1 1.000 3.653E7 .000 .
Komplikasi by
Penghasilan 21.499 5.530E4 .000 1 1.000 2.173E9 .000 .
J_kunjung by
Komplikasi 37.535 2.679E4 .000 1 .999 2.000E16 .000 .
Jarak by Status 22.046 4.549E4 .000 1 1.000 3.753E9 .000 .
Komplikasi by Status -.506 2.992E4 .000 1 1.000 .603 .000 .
Jarak by Komplikasi -16.132 6.780E4 .000 1 1.000 .000 .000 .
Constant -21.308 1.331E4 .000 1 .999 .000
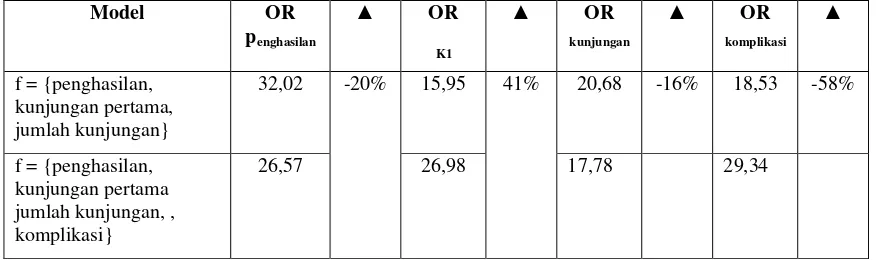
Tabel 4.7 Pemeriksaan
Confounding
Model
OR
p
▲
enghasilan
OR
▲
K1
OR
▲
kunjungan
OR
▲
komplikasi