1
DESIGNING A SUPPLY CHAIN SYSTEM DYNAMIC MODEL FOR
PALM OIL AGRO-INDUSTRIES
Hoetomo Lembito
Doctoral Candidate in Management and Business, Bogor Agricultural Institute (IPB)1
Kudang Boro Seminar: First Supervisor, Lecturer of Bogor Agricultural Institute (IPB) Nunung Kusnadi: Second Supervisor, Lecturer of Bogor Agricultural Institute (IPB)
Yandra Arkeman: Third Supervisor, Lecturer of Bogor Agricultural Institute (IPB)
Abstract
World palm oil consumption has significantly increased over the years. Indonesia has scored a significant achievement on oil palm development by becoming the biggest palm-oil-producing country in the world, both in terms of plantation area and in total national production of palm oil. Crude Palm Oil (CPO) is a commodity which has a strategic value to be developed for Indonesian economy. This fast-paced growth of the CPO production and the increase of world CPO demand have necessitated extensive supply chains across the country to facilitate sourcing and distribution of production. The purpose of this research is to design, construct and simulate model to capture the structure of CPO supply chain system in order to predict some aspects of its behavior, with the ultimate purpose of analyzing the potential growth CPO agro-industries in Indonesia. The initial of system dynamic model consists of production sub-model, supply and demand sub-model, along with and revenue and cost sub-model. The system dynamic model can be deployed to simulate some pattern of selected components. Model validations were done to improve fitness of the model.
Keywords: supply chain, system dynamic, crude palm oil
1. INTRODUCTION
The world is in the era of supply chain competition, where organization no longer acts in isolation as an independent entity, but as a part of a supply chain to create value delivery systems that are more responsive to fast-changing markets, more consistent and reliable (Christopher, 2005: Pandey and Gaug, 2009:). The core capabilities of a company lie in its ability to design and manage its supply chain in order to gain maximum advantage in the market where competitive forces are changing.
Supply chain is a typical complex, adaptive, and dynamic system with nonlinearities, delays, and networked feedback loops. So it is very difficult for supply chain professionals to clearly understand
supply chain operational mechanisms and thus make appropriate decisions within the limited time to adapt to the ever-changing, competitive, and turbulent business environment.
Agriculture sector produces food, feedstock, fiber, fuel and other goods, and creates big influence to essential ecosystem, services like water supply and carbon release. Agriculture is the main development component in the economic, social, ecology, culture, and food resilience, either at local, national and also global level. Agriculture sector in
Indonesia‟s economic development contributed
15% to national GDP and 40.3% employment in the year 2009 (Pahan, 2012).
2
agribusiness system (Pahan, 2012). Agribusiness system was an approach which integrated raw material purchasing (upstream agro-industry), the activity of primary production (on farm), manufacturing process (downstream agro-industry), marketing, and supporting institutions such as financing, land agency, research and development within one system. Oil palm plantation produces raw material in the form of fresh fruit bunches (FFB) that were processed in the palm oil mill to become semi-goods namely crude palm oil (CPO) and palm kernel oil (PKO). Semi-goods are further processed to become finished goods (edible and non-edible) at downstream manufacturing industry to give financial added value. Palm oil export‟s contribution to Indonesia economy in the year 2010 was USD 16.4 billions.
The oil palms mostly are planted in Sumatra, with recent expansions move into forested parts of Riau, Jambi, and South Sumatra, as well as into West Kalimantan and South Sulawesi. Most oil palm plantations are owned by Indonesian interests, although by 2002, there were over 600,000 ha of private estates owned by foreign and largely Malaysian companies. (Colin, 2003)
Over the past 10 years total global edible oil demand has increased at a rate of 5.5 million tons per annum (6.25 percent), while palm oil demand on its own has grown by 2.5 million tons or at 9.5 percent annually. The escalating increase in worldwide demand for palm oil has largely been satisfied in recent years through equally rapid
growth in the world‟s two largest producing
nations, Indonesia and Malaysia. (USDA, 2010)
Figure 1. World CPO Demand
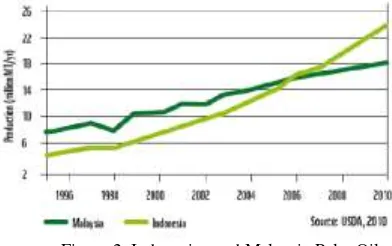
A significant change in the oil palm industry has taken place during the past season, as Indonesia
surpassed Malaysia in the production of palm oil to become the current world leader. Indonesia is the biggest CPO producer in the world, accounting for 47 percent of world production. The countries produced 18 million tons of CPO from 7.9 million hectares of plantations in 2008, and produced 22 million tons in 2009 and produced 23.6 million tons in 2010. Malaysia, currently the second-biggest CPO producer, may see its production from 17.7 million tons in 2009 to 18.2 millions in year 2010.
Figure 2. Indonesian and Malaysia Palm Oil Production
The Indonesian palm oil Industry has grown very fast and significantly recently. By 2007, planted area and production had increased to 23 and 24.5 times compared to their level in 1980 respectively, and planted area‟s growth rate on average 11% from 1980 to 2007, while the production growth on average is 13% per annum. Seventy percent of palm oil production in Indonesia is exported. As a result, the export market contributes important role in the growth of the palm oil industry. By 2007, palm oil export had increased to 23.6 times compare to its level in 1980, with an average growth rate of 28% in terms of quantity and 27% in terms of value annually. (James, 2007)
2. METHODOLOGY
3
company Kotzab (1999) and is characterized by highly competitive interactions among a large number of entities trying to achieve a multiplicity of objectives. System dynamics modeling is the technique of constructing and running a model of an abstract system in order to study its behavior without disrupting the environment of the real
system.
The application of system dynamics modeling to supply chain management has its roots in industrial dynamics Forrester (1961) System Dynamics (SD) is a methodology for understanding the behavior of complex, dynamic social-technological-economic-political systems to show how system structures and the policies used in decision making govern the behavior of the system. SD focuses on the structure and behavior of systems composed of interacting feedback loops. Sterman (2000) used industrial dynamics for analyzing business systems depending upon changing information and time. Thus system dynamics is very useful to craft future policies for running businesses in a complex environment.
The research stages are of (1) Identifying the supply chain system for CPO Agro-Industry (2) Analyzing the dynamic systems with causal loop diagram and stock flow diagram (3) Developing a computer simulation model of the system (4) Validating the model.
Figure 3. Crude Palm Oil Process
2.1. Identifying Supply Chain System
The supply chain system for CPO is very complex. Palm oil industry supply chain as agribusiness system consists of supplier (seed, agrochemicals, equipment and agricultural machineries producer), plantation (private, government, and public small holders), processor (edible and non edible), marketer (trader and consumer goods companies), and supporting subsystem such as land, financial, and R&D (Pahan, 2012). The company in palm oil industry which is expecting to increase performance through service effectiveness and cost efficiency can do it in two ways, namely (1) Reducing the barrier of supply chain integration, and (2) Increasing facilitation of supply chain integration (Richey et. al, 2010). The objective of supply chain integration (of key business processes among a network of interdependent suppliers, plantation, processor , and marketers in order to improve the flow of goods, services, and information from original suppliers to final customers), is reducing system-wide costs while maintaining the required service levels. The supply chain systems in this research focus on 3 sub-model. Production Sub-model (Plantation and Mill). Demand and Supply Sub-model (Domestic and Export Market) and Revenue and Cost Sub-Model (Sales Revenue, Production Cost, Logistics Cost). By understanding the supply chain system in CPO Agro-industry we can analyze the system by using Causal Loop Diagram (CLD) and Stock Flow Diagram (SFD) Diagram.
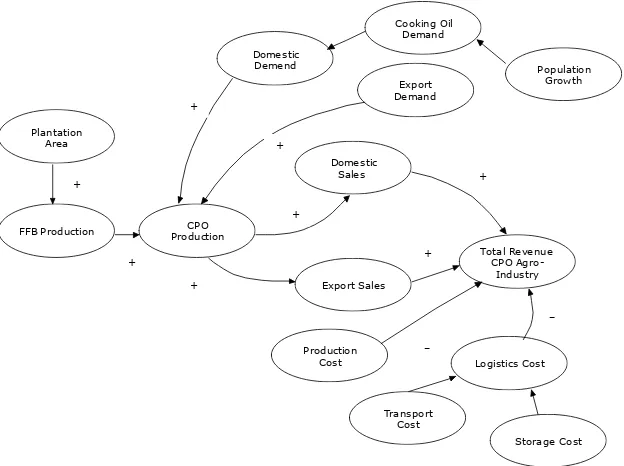
2.2. Analyzing with CLD and SFD
There are two structural ways to analyze any system dynamics: CLD and stock and flow diagram SFD. CLD diagrams can be used to show the governing inter-relations among a number of different variables using feedback loops. A positive feedback loop means the dependent variable moves in the same direction as that of the independent variable; as such, the polarities are assigned as a plus (+) sign on the arrowhead of feedback loops. In the case of negative feedback loops, if the independent variable increases, the dependent variable decreases and vice versa. Thus a minus (–) sign is assigned to the arrowhead of the feedback loop.
4
a SFD which is used to explain both variables, i.e. the stocks and flows. Stocks refer to the status of variables at a point/moment of time while flows exist during a period of time. Stocks are accumulated over time through inflows and outflows. Apart from stock and flow variables, another kind of variable called an „auxiliary
variable‟ has been used here. Auxiliary variables
are used to connect between stocks and flows as well as among themselves. By using all these three
kinds of variables, we can explain dynamic systems more appropriately. Many researchers and authors have used stock and flow diagrams to model and describe supply chain performance variables (Agarwal and Shankar 2005, Campuzano and Mula 2011).
CPO Production Plantation
Area
Logistics Cost Production
Cost Export Sales
Domestic Sales
Total Revenue CPO
Agro-Industry Domestic
Demend
Export Demand
FFB Production
+
+
+
+
+ +
+
-+
Cooking Oil Demand
Population Grow th
Transport Cost
Storage Cost
5
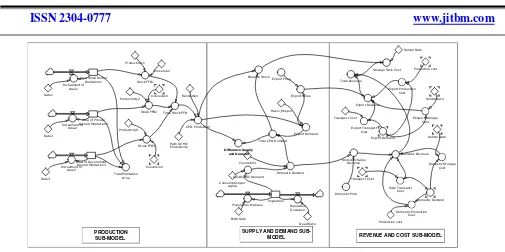
Figure 5. Stock Flow Diagram
2.3. Developing Computer Simulation Model
System dynamics software is useful to model and simulate dynamic behaviors of a wide variety of systems such as business, economic market, team dynamics, electrical engineering, natural environment, and scientific systems. We adopted Powersim Studio 2005 because it allows us to model the major variables – stocks, rates, auxiliaries, flows and constant of CPO business processs – in the workspace, and connected with arrows. For each variable a number or equation has to be defined. Powersim is a flow-diagram-based modeling tool, which is able to show multiple models simultaneously and connecr separate models to each other.
2.4. Validating the Model
Model validation was undertaken by using the Mean Absolute Error (MAE) technique is applied
magnitudes of the error give any indication of how large the error is, therefore, this error can be assessed only by comparing it with the average size of the variable in question. However, the main advantage of MAE is that it can be decomposed into various components, which show the deviation between the simulated and actual values.
The mean absolute error is an average of the absolute errors ei = | fi – yi |, where fi is the prediction and yi is the true value
2.5. Data Sources and Descriptions
6
3. RESULTS
3.1.CPO Production Sub-model
We capture the growth of plantation area from 3 plantation owner (small holder, private owned and government owned) from the year 2000 to 2010. From the data we analyze the annual growth rate of small holders, private owned and government owned to be is 12%, 8% and 2% (BPS, 2010). And from computer simulation we can predict the growth will continue for another 20 years, with the assumption there is no barrier in preparing the plantation area. In year 2030 the total area will be around 42 millions hectares around 5 times of total compare to area in year 2010.
Figure 6. Growth of Plantation Area
The production of Fresh Fruit Bunches (FFB) with the fraction of production around 15-17 tons per hectare will also grown significantly. The production of FFB in small holders in year 2010 was 7 millions tons, private owned was 12 millions tons and government owned was 1.5 millions tons. From computer simulation we can predict that the FFB production from small holder in year 2030 is around 61 millions tons, private owned is around 34 millions tons and government is around 1.7 tons millions. Total FFB production is around 97 millions ton. We assumed oil extraction rate of CPO is 20% and palm oil mill productivity rate is 90%.
Figure 7. Growth of FFB Production
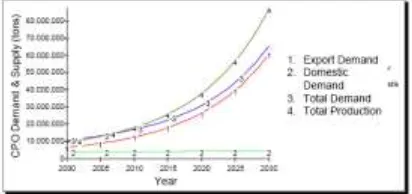
3.2.CPO Demand and Supply Sub-model
From the data we analyzed from year 2000-2010, we calculate the total demand domestic demand and export demand. The computation the domestic demand mainly come from the assumption of cooking oil with an average 9 kgs/capita/year cooking oil or equal to 13.5 kgs CPO capita/year. From BPS we find the Indonesan population around 237 millions in year 2010 with the birth rate is 0.011 and dead rate is 0.007 (Kuncoro, 2011). The export demand on year 2010 around 12.8 millions tons of CPO and domestic demand around 3.2 millions tons. With the computer simulation we can predict the demand in year 2030. The Export demand will be around 60 millions tons and domestic will be around 5 millions tons, and the estimated production will be around 80 millions ton . This means that Indonesia can increase the export market since there will be enough stock to sell. And Indonesia will have to handle competition from other country producers especially that of Malaysia.
7
3.3.CPO Revenue and Cost Sub-model
From the yearly price both in Domestic Market price and export market (CIF Rotterdam), the CPO price per ton in year 2000 was Rp. 2 millions domestically, while the CIF Rotterdam price was USD 311. In year 2010 the export price was around US$ 900, slightly going down compared to the price in year 2008 which was US$ 948. (USDA, 2010). The price drop is due to world economic crisis in year 2008. The production cost was estimated USD 400 per ton and we assumed the logistics cost of USD 60- USD 80 per ton. From the computer simulation we can predict the total revenue for Indonesia Palm Oil Industry is around in year 2030 to be around USD 53 billions or more than 3 times larger than that of the year 2010. And the gross profit excluding export tax seems promising still.
Figure 9. Growth of FFB Production
3.4.Model Validation
For model validation we use data Total Growth Area and Total CPO production from year 2000-2010. The actual data taken from statistics and computation were compared with data simulation computed by Powersim Software studio 2005. From the analysis data we find that the forecast error is 3% and 3.4 %. And the range of accepted errors in MAE is 5 %. Model validations were done to prove the fitness of the model.
Figure 10. Model Validation for Area Growth
Figure 11. Model Validation for Production Growth
4. CONCLUSION
A supply chain is the connected series of value activities concerned with the planning and controlling of raw materials, components and finished products from suppliers to the final customers. Supply chain management provides an opportunity to the firms to look beyond their own organization and collaborate with the value chain partners for the mutual benefits. System dynamics considers the causal relationships among variables and through simulation permits the evaluation of such impact on the operating performance of whole supply chain.
8
The growth CPO Agro-industries product yet faces two main risks that may hinder it. First, the unstable economic condition in Europe and USA may impact to world economy, and may reduce the growth of CPO demand. Second, it may come from a worsened environmental issue as an effect of the opening new palm plantations and affect the deforestation.
This research in CPO in Indonesia describes the complex supply chain for Agro-industrial products. By designing and constructing system dynamic model it will help the agribusiness sector
to predict some aspects of its behavior, such as plantations area growth, CPO production growth, demand and price fluctuations, with the purpose of analyzing the potential growth and challenges faced by of CPO agro-industries in Indonesia.
References
1. Agarwal A, Shankar R. .2005. “Modeling
supply chain performance variables”, Asian
Academy of Management Journal 10(2): 47-68.
2. Statistik Indonesia. 2010. Badan Pusat Statistik.
3. Campuzano F, Mula J. 2011. Supply chain simulation: A system dynamics approach for improving performance, Springer.
4. Christopher M. 2005. Logistics and Supply Chain Management: Strategies for Reducing Cost and Improving Service, Prentice-Hall, London.
5. Colin B, Zachary Z, RIA G. 2003. The Indonesian Oil Palm Industry
6. Forrester JW. 1961. Industrial Dynamics. Portland (OR): Productivity Press.
7. Hyndman R, Koehler A. 2006. Another look at measures of forecast accuracy. International Journal of Forecasting 22(4), 679–688
8. James C. 2007 Indonesia Palm Oil Productions Prospect Continue to grow, Commodity Inteligence Report, USDA Foreign Agricultural Service
9. Kuncoro HW, Kharies P, Aang A. 2011. Supply Chain Management Agro Industri yang Berkelanjutan. Lubuk Agung. Bandung
10. Kotzab, H. 1999, Improving supply chain performance by Efficient Consumer Response .A critical comparison of existing ECR-approaches, Journal of Business and Industrial Marketing, Vol. 14, No. 5/6, pp. 364-377.
11. Outlook Komoditas Pertanian. 2010. Pusat Data dan Informasi Pertanian. Kementerian Pertanian
12. Pahan I. 2005. Panduan Lengkap Kelapa Sawit, Manajemen Agribisnis dari Hulu hingga Hilir, Jakarta, Penebar Swadaya
13. Pahan I. 2012. Development of Palm Oil Industrial Cluster in Indonesia, An Analytical Network Process Study, Saarbrucken. Deutschland. Lambert Academic Publishing
14. Pandey V.C, Garg S. 2009. Analysis of interaction among the anablers of agility in supply chain. Journal of advances in management research, 16:1, pp.99-114.
15. Richey Jr. RG, Roath AS. Whipple JN, Fawcett SE. 2010. Exploring a governance theory of supply chain management: Barriers and facilitators to integration. J Bus Log.31 (1): 237-256.
16. USDA Foreign Agricultural Service. 2010. Commodity Intelligence Report