A Distribution Planning Model for Subzided-Fertilizer Supply Chain Planning
Considering Quota Allocation: A Case Study
Wahyudi Sutopo1, Yuniaristanto2, Wakit Pramono3
1,2Research Group in Logistics System and Business
3An adjunct researcher of Laboratory of Logistics System and Business
Department of Industrial Engineering, Sebelas Maret University Jalan Ir. Sutami No. 36ª, Kentingan, Surakarta, 57126, INDONESIA E-mail: 1 [email protected]; 2 [email protected]; 3 [email protected]
Abstrak
Makalah ini membahas studi dunia nyata masalah perencanaan distribusi pupuk bersubsidi. Salah satu perusahaan pupuk nasional bahasa Indonesia memiliki kewajiban mendistribusikan pupuk bersubsidi-menjadi 15 kabupaten/kota di Propinsi Jawa Tengah. Perusahaan harus memenuhi permintaan pupuk bersubsidi-melalui saluran distribusi terkendal tingkat ketiga seperti lini I (pabrik), lini II (gudang provinsi), dan lini III (gudang kabupaten/kota). Lini I memasok lini II dan III dengan jumlah lebih besar dari pasokan dibandingkan dengan alokasi kuota yang sebenarnya berdasarkan keputusan gubernur. Pada kebijakan sebelumnya lini I mensuplai lini II dan III dengan stock pengaman untuk mengantisipasi permintaan selama 2 minggu dari distributor. Karena perubahan musim panen dan fluktuasi permintaan, lini II tidak dapat memenuhi permintaan dengan jumlah yang tepat, tempat, dan waktu. Kinerja pada tahun sebelumnya lebih dari 10% dari deviasi standar antara keputusan gubernur dan realisasinya. Fenomena ini menyebabkan meningkatnya biaya logistik seperti pemesanan, biaya transportasi, dan biaya simpan. Tujuan dari penelitian ini adalah untuk mengembangkan model untuk mendukung perusahaan untuk menentukan ukuran lot optimal dari lini II untuk berbaris I, dan safety stock pada Garis II dan III untuk
meminimalkan biaya logistik. Sebuah model non-linear programming (MINLP) diusulkan untuk memecahkan masalah ini dengan mempertimbangkan metode peramalan baru untuk menghitung alokasi kuota. Ada lima kelompok kendala termasuk kapasitas gudang, kapasitas kendaraan, kuota, persediaan, dan variabel biner. Studi ini memberikan manfaat lebih dari 9% dari biaya logistik.
Kata kunci: perencanaan distribusi, biaya logistik, ukuran lot, mixed integer non-linear programming, safety stock,
subsidi-pupuk.
Abstract
This paper investigates a real-world case study of a subsidized-fertilizer distribution planning. One of Indonesian national fertilizer company has an obligation distributing subsidized-fertilizer to 15 regency/municipality in Central Java Province. The company has to fulfill the demand of subsidized-fertilizer through a third-level controlled-distribution channels such as line I (factory), line II (province’s warehouse), and line III (regency/municipality warehouse). Line I supplies line II and line III with higher amount of supply compare to the actual quota allocation based on the governor’s decree. In the previous policy, line I supplied line II and line III with safety stocks to anticipate the demand for 2 weeks of distributors. Due to the changing of harvest season and demand fluctuation, line II cannot fulfill the demand with exact amount, place, and time. The performance at previous year is more than 10% of standard deviation between the governor’s decree and the realization. This phenomenon causes the increasing of logistic costs such as ordering cost, transportation cost, and holding cost. The objective of this research is to develop a model for supporting company to decide the optimal lot size from line II to line I, and safety stock at Line II and III in order to minimize logistic costs. A mixed integer non-linear programming
(MINLP) was proposed to solve this problem by considering a new forecasting method to calculate the quota allocation.
There are five groups of constraints including warehouse capacity, vehicle capacity, quota, inventory, and binary variable. This study gives more than 9% benefit of logistic costs.
Wahyudi Sutopo, et al., A Distribution Planning Model 43
Introduction
The government of Indonesia provided heavy subsidies for fertilizer in order to ensure rational price for farmer/farmer groups and to support foodstuff production [1]. In 2006, according to the Trading Minister Policy No. 03/M-Dag/Per/2/2006, the Government made a regulation regarding procurement and distribution of subsidized fertilizer for agriculture sector. The government assigned respective producers to fulfill fertilizer’s demand in each responsible region. The producer obligate to perform procurement and distribution of Subsidized Fertilizer in their responsible regions accord with necessary plan which stipulated by Minister of Agriculture. The Supply Chain of Subsidized-Fertilizer from producer to farmers is according to the Six Exactly Principle, namely exact kind, amount, price, place, time and quality. The company has to fulfi l the demand of subsidized- fertilizer through a third-level controlled-distribution channels such as line I (factory), line II (province’s warehouse), and line III (regency/municipality warehouse) to retailers at line IV. The producer, distributor and retailer have terraced responsibilities as follows [2]: a) the producer obligate to perform procurement and distribution of Subsidized Fertilizer from Line I up to and including Line III in their responsible regions; b) the distributor obligate to perform procurement and distribution of Subsidized Fertilizer according to its utilization from Line III up to and including Line IV in their responsible regions; and c) The retailer obligates to perform procurement and distribution of Subsidized Fertilizer in Line IV.
PT. Pupuk Kaltim (PKT), one of fertilizer producer, has obligation to fulfill farmer’s demand in 15 Regency/Municipality at Region II of Central Java Province. This obligation was organized by PKT Central Java Province Marketing Office (PKT-PJT). The company has to fulfill the demand of subsidized- fertilizer based on the Governor’s Decree [4]. In the previous policy, line I supplied line II and line III with safety stocks to anticipate the demand for 2 weeks of distributors. Due to the changing of harvest season and
demand fl PKT-PJT cannot fulfi the demand
with exact amount, place, and time. The performance at previous year is more than 10% of standard deviation between the Governor’s Decree and the realization. The Governor’s Degree was allocated Subsidized- Fertilizer based on definitive plan groups organized by Agency of Agricultural in Regency/Municipality and in Province. This phenomenon causes the increasing
of logistic costs such as ordering cost, transportation cost, and holding cost.
Based on above explanations, it is important to integrate key business processes including third-level controlled-distribution channels in order to minimize logistics costs. The integration of key business processes is required to achieve the suitable economic results and to leverage benefits [5,6]. Two strategic Supply Chain problems were addressed in this works especially for matching supply with demand [7]. The efficiency of a proposed supply chain was be assessed using the total logistics cost [8]. The objective of this research is to develop a model for supporting company to decide the optimal lot size from line II to line I, and safety stock at Line II and III in order to minimize logistic costs.
Problem Description
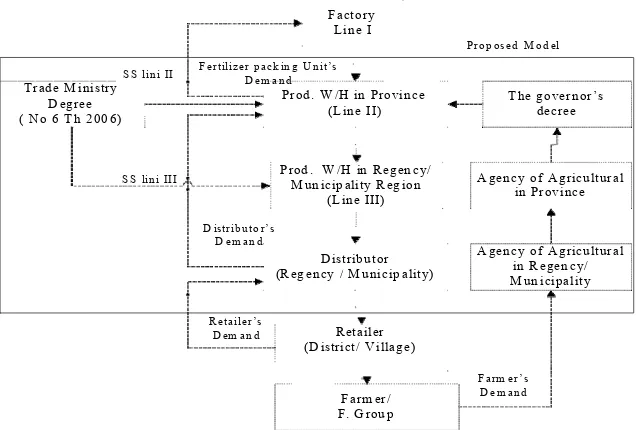
This work is not only for solving the real problem of Subsidized Fertilizer distribution problems in PKT- PJT but also trying to fill the research gaps in the area of lot sizing. We investigated the real condition to determine the relevant system then we studied several researches available regarding this issue performed before. The relevant system of the problem is illustrated in Fig. 1. It consists of four stages namely factory side (line I), PKT-PJT side (line II and III), demand side (distributor and retailer), and quota allocation decided by the Governor’s Decree (the farmer’s demand were calculated by Agency of Agricultural in Regency/Municipality and in Province). PKT-PJT has an obligation distributing subsidized-fertilizer to 15 Regency/Municipality in Central Java Province (Boyolali, Klaten, Sukoharjo, Wonogiri, Karanganyar, Sragen, Grobogan, Blora, Rembang, Kudus, Pati, Jepara, Demak Semarang/Salatiga and Surakarta).
Many contributors, for instant [3,9,10,11,12,13] have dealt with the quota allocation and the lot sizing
problems. Rizk and Martel [14] and Robinson et al.,
[15] were reviewing some of the work which has contributed to the current state-of-the-art of lot sizing models. Based on lot sizing problem, this work could be classifi as a Multi Level Lot-Sizing Problem (MLLP). Kilger and Wagner [10] proposed a demand planning framework that can be adapted as a method
to determine quota allocation. Jeng, et al., [12]
44 Rekayasa, Volume 4, Nomor 1, April 2011
Figure 1. An overview of relevant system
regionalization system and subsidized cost in order to
reach urea fertilizer’s maximum price. Yuniaristanto, et
al., [13] developed 2 stages model of material planning
and control to minimize the total inventory cost. As in the papers cited above, none of the models is appropriate to solve the case study of 3 stages – 3 echelons distribution planning by minimizing total logistic costs. The quota allocation, safety stocks and lot sizing model from PKT-PJT to factory must be developed. The lot size and safety stock decision must be taken prior to the point in time when the quota allocation becomes known. In this work, a strategic level of supply chain distribution planning problem is addressed, that is the decision on quota allocation, safety stocks and economic lot sizing to ensure the distribution of subsidized-fertilizer in Central Java Province II region with exact amount, place, and time.
Model Formulation
There are three basic models in this research: quota allocation, safety stocks and economic lot sizing model. The quota allocation model contains demand planning structures, demand planning process and demand planning controlling. The quota model considers planting season, planting area, fertilizer doses and time per planting type. There is significant difference of planting season in each regency/municipality areas. This situation was forced to determine a specific fertilizer doses and time per planting type. For this
reason, it is important to calculate safety stocks considering demand aggregation adopted from Chopra and Meindl [5]. A Mixed Integer Linear Programming (MILP) model is used to determine lot size including line II and III The in-hand stock of subsidized-fertilizer. Figure 2 shows a framework of three stages – three echelons distribution planning of this paper.
The model developed in this paper use the following notations:
Subscript symbols:
j
Monthly planned time unit( j = 1,2,3,…, n),
Figure 2. A framework of three stages – three echelons distribution planning
Inputs:
Fertilizer doses and tim e per planting type; planting area and num ber of planting season
O bjectives:
to ensure the distribution of subsidized-fertilizer not only exact am ount, place, and tim e but also
Procurem ent control (Lot Size M odel)
(Line II) The governor’s decree
S S lin i III Prod . W /H in R egen cy/M un icip ality R eg ion (L in e III)
A gency of A gricultural in Province
D istrib uto r’s D em an d
D istribu tor (R eg ency / M unicip ality)
A gency of A gricultural in R egen cy/ (D istrict/ V illag e)
F arm er/ F. G rou p
Wahyudi Sutopo, et al., A Distribution Planning Model 45
and (9) green beans. This formulation will promote a quota allocation (S) which decided by the Governor’s Decree.
The following formulation is used in the formulation of safety stocks:
Q3jj Lot size of subsidized-fertilizer that is allocated
from line II to line III no. i in month j (sacks), Lli
LT
li
J (3)
Q2j lot size of subsidized-fertilizer that is ordered by
line II to line I in month j (sacks),
bj Indicate 1 if line II orders subsidized-fertilizer
to line I and 0 otherwise,
I3jj The in-hand stock at line III no. i in month j
O Ordering cost per unit of time (Rp),
H3j Variable-holding cost at line III no. i per mmoonnth
(Rp./sacks),
Hf3j Fixed-holding cost at line III no. i per planned time
(Rp./sacks),
H2 Variable-holding cost at line II per month
(Rp./sacks),
Hf2 Fixed-holding cost at line II per planned ttiimmee
(Rp./sacks),
K3i Maximum-capacity of W/H line III nnnooo... iii (((sacks),
Norm sin v(CSL)x C
The following formulation is used in the formulation of lot size and stock in three echelons distribution planning with objective to minimize ordering cost, transportation cost, and inventory holding cost using a MILP.
The following objectives function is used in the formulation of minimal logistic costs:
n n m
municipality areas no. i per season (hectare),
LTli Planting area for plant type no. l at regency/
i1 i1
Hf 2 HF3
Subject to:
i1 i1
municipality areas no. i per year (hectare),
Jl Number of planting season for plant type no. l per
year.
The following formulation is used in the formulation of quota allocation:
The plant types to be analyzed in the formulation of quota allocation which has: (1) wet rice; (2) unirrigated agricultural rice; (3) dry rice; (4) corn/maize;
(5)cassava; (6) sweet potato., (7) peanuts; (8) soybean;
46 Rekayasa, Volume 4, Nomor 1, April 2011
The constraint set (9)–(11) ensures that each W/H is store the in-hand stock of subsidized-fertilizer under their maximum capacity. The constraint set (12) represents the capacity restriction of transportation modal. The constraint set (13) ensures that the total of subsidized-fertilizer allocated from line II to line III is under their quota. Equation (14–17) guarantees that each W/H in three echelons has optimal in-hand stocks. Constraint set (18–19) enforces the binary number of the decision variables and constraint.
Model Formulation
The optimal solution can be obtained by solving the pre-emptive of the A mixed integer non-linear programming (MILP) above. The methodology to solve the proposed problem is described as follow:
(i) set the parameters of the a distribution planning
model; (ii) formulate the objectives function in the MILP; (iii) formulate all the constraints of the solution model; and (iv) solve this model by using Microsoft Excel Solver 9.0.
In order to illustrate the capabilities of the proposed-model, a numerical example has been
studied. Data input was obtained from Agency of Agricultural in Regency/Municipality and in Province and Central Statistic Board of Republic of Indonesia. We were calculated decision variables for 1 year planning horizon. The results above are summarized as below:
1) The total quota allocation in current system is
8,980,600 sacks while proposed system will suggest 10,028,670 sacks.
2) Based on safety stocks analyis, the proposed system
will reduce to 78% in inventory (Table 1).
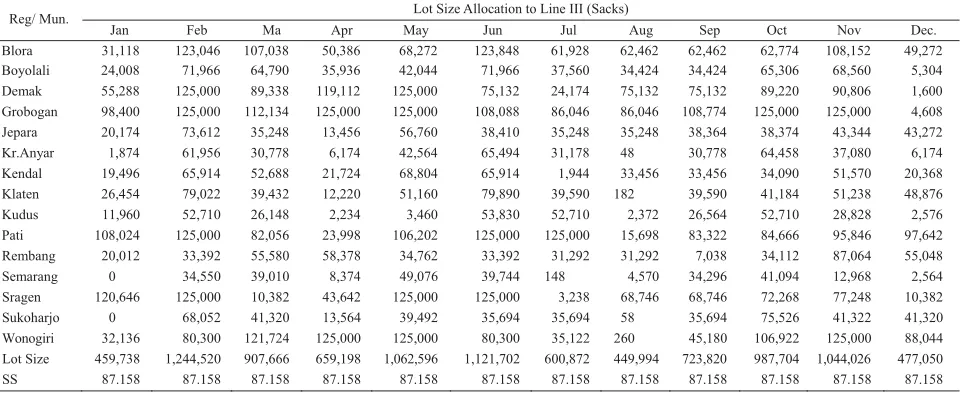
3) The Lot size allocation to Line III, Lot Size Ordered
by Line II and Safety Stocks are presented in Table 2.
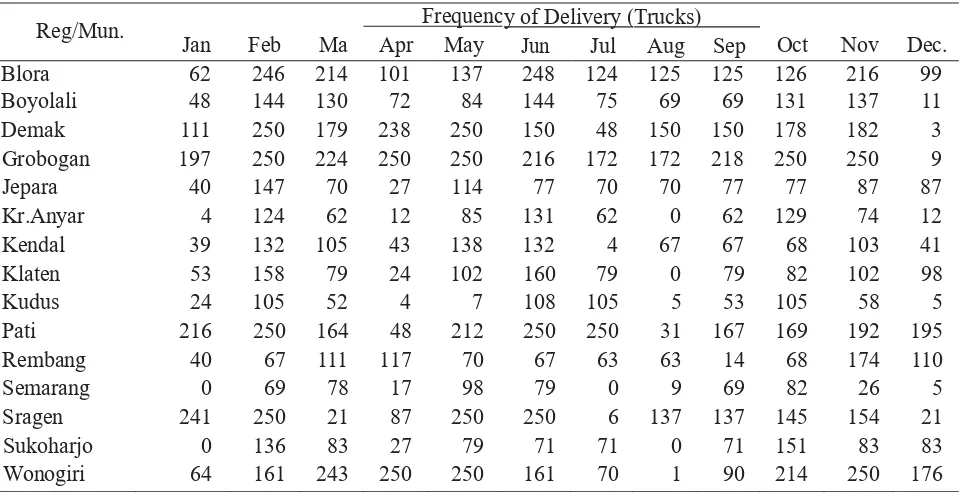
4) The frequency of delivery is presented in Table 3.
5) The total logistic costs in current system is Rp.
Rp. 42,717.67 billion while proposed system will only expend Rp. 38, 821.16 billions. The proposed system will reduce costs up to 9%.
6) The Agency of Agricultural can propose a new
system of quota allocation using this model.
7) The PKT-PJT can improve their procurement and
distribution system using a proposed distribution planning model.
Table 1. Safety stocks analysis
No. Echelon Real System (Sacks) Proposed System (sacks) Saving (%)
1 SS Line II 3,593,856 1,045,896 70.9
2 SS Line III 3,652,577 515,572 85.8
3 Total 7,246,433 1,561,468 78.4
Table 2. Lot size allocation to Line III, Lot Size Ordered by Line II and Safety Stocks
Reg/ Mun. Lot Size Allocation to Line III (Sacks)
Jan Feb Ma Apr May Jun Jul Aug Sep Oct Nov Dec.
Blora 31,118 123,046 107,038 50,386 68,272 123,848 61,928 62,462 62,462 62,774 108,152 49,272
Boyolali 24,008 71,966 64,790 35,936 42,044 71,966 37,560 34,424 34,424 65,306 68,560 5,304
Demak 55,288 125,000 89,338 119,112 125,000 75,132 24,174 75,132 75,132 89,220 90,806 1,600
Grobogan 98,400 125,000 112,134 125,000 125,000 108,088 86,046 86,046 108,774 125,000 125,000 4,608
Jepara 20,174 73,612 35,248 13,456 56,760 38,410 35,248 35,248 38,364 38,374 43,344 43,272
Kr.Anyar 1,874 61,956 30,778 6,174 42,564 65,494 31,178 48 30,778 64,458 37,080 6,174
Kendal 19,496 65,914 52,688 21,724 68,804 65,914 1,944 33,456 33,456 34,090 51,570 20,368
Klaten 26,454 79,022 39,432 12,220 51,160 79,890 39,590 182 39,590 41,184 51,238 48,876
Kudus 11,960 52,710 26,148 2,234 3,460 53,830 52,710 2,372 26,564 52,710 28,828 2,576
Pati 108,024 125,000 82,056 23,998 106,202 125,000 125,000 15,698 83,322 84,666 95,846 97,642
Rembang 20,012 33,392 55,580 58,378 34,762 33,392 31,292 31,292 7,038 34,112 87,064 55,048
Semarang 0 34,550 39,010 8,374 49,076 39,744 148 4,570 34,296 41,094 12,968 2,564
Sragen 120,646 125,000 10,382 43,642 125,000 125,000 3,238 68,746 68,746 72,268 77,248 10,382
Sukoharjo 0 68,052 41,320 13,564 39,492 35,694 35,694 58 35,694 75,526 41,322 41,320
Wonogiri 32,136 80,300 121,724 125,000 125,000 80,300 35,122 260 45,180 106,922 125,000 88,044
Lot Size 459,738 1,244,520 907,666 659,198 1,062,596 1,121,702 600,872 449,994 723,820 987,704 1,044,026 477,050
Wahyudi Sutopo, et al., A Distribution Planning Model 47
Table 3. The frequency of Delivery
Reg/Mun. Jan Feb Ma Apr MayFrequency of Delivery (Jun Jul Trucks) Aug Sep Oct Nov Dec.
Blora 62 246 214 101 137 248 124 125 125 126 216 99
Boyolali 48 144 130 72 84 144 75 69 69 131 137 11
Demak 111 250 179 238 250 150 48 150 150 178 182 3
Grobogan 197 250 224 250 250 216 172 172 218 250 250 9
Jepara 40 147 70 27 114 77 70 70 77 77 87 87
Kr.Anyar 4 124 62 12 85 131 62 0 62 129 74 12
Kendal 39 132 105 43 138 132 4 67 67 68 103 41
Klaten 53 158 79 24 102 160 79 0 79 82 102 98
Kudus 24 105 52 4 7 108 105 5 53 105 58 5
Pati 216 250 164 48 212 250 250 31 167 169 192 195
Rembang 40 67 111 117 70 67 63 63 14 68 174 110
Semarang 0 69 78 17 98 79 0 9 69 82 26 5
Sragen 241 250 21 87 250 250 6 137 137 145 154 21
Sukoharjo 0 136 83 27 79 71 71 0 71 151 83 83
Wonogiri 64 161 243 250 250 161 70 1 90 214 250 176
Summary and Extensions
A proposed distribution planning model is formulated considering 3 stages-3 echelons supply chain. The model can be used to make decision not only the lot size and safety stock including line II and
References
[1] Rachman, B., 2009. “Fertilizer Subsidy Policy: Overview on Technical, Management and
Regulation Aspects”, Analisis Kebijakan
Pertanian, 7(2), p.p 131-136.
III, but also the decision on quota allocation based on each region characteristics. A mixed integer linear programming (MILP) was proposed to solve this problem. There are five groups of constraints including warehouse capacity, vehicle capacity, quota, inventory, and binary variable. This study gives more than 9%
[2] Anonym, 2006. “Regulation MMiinniisster of
Trade of The Republic of Indonesia Number: 03/M-Dag/Per/2/2006 Regarding Procurement and Distribution of Subsidized Fertilizer for
Agriculture Sector”, Minister of Trade of The
Republic of Indonesia.
benefit of logistic costs.
However, the actual work situation which can be changed all the time for all parameters. It is important to develop decision support system (DSS) for helping model application. This paper also has a certain limitation due to some assumptions to simplify the model. It is clear that the relaxation of these assumptions will provide additional challenges in future research.
Acknowledgment
The authors are grateful to the anonymous referees for the comments and recommendations that improve the paper. This work was partially supported by
Research Group of Logistic System and Business,
Department of Industrial Engineering, Faculty of Engineering, Sebelas Maret University.
[3] Agustina, Y and Nur Bahagia, S., 2007. “Integrated Model of Distribution Regionalization System and Subsidized Cost in Order to Reach Urea Fertilizer’s Maximum Price in Indonesia”,
Proceedings of the 2nd International Conference on Operations and Supply Chain Management,
p.p. 78-93. (May 18-20, Bangkok, Thailand). [4] Pramono, W., 2008. “ Distribution Planning
of Subsidized Urea Fertilizer’s at PT. Pupuk Kalimantan Timur - Central Java Province Marketing Office Using Model Mixed Integer
Linear Programming”, Final Project Report,
Department of Industrial Engineering, Sebelas Maret University.
[5] Chopra, S. and Meindl, P., 2004. “Supply
Chain Management: Strategy, Planning, and Operations”, 2nd Edition. Prentice Hall, Upper
48 Rekayasa, Volume 4, Nomor 1, April 2011
[6] Simchi-Levi, D,. Kaminsky, P. & Simchi-Levi,
E., 2003. “Designing and Managing the Supply
Chain : Concept, Strategies, and Case Studies”,
McGraw-Hill Higher Education, Singapore.
[7] Cachon, G. and Terwiesch, C., 2006. “Matching
Supply with Demand: An Introduction to Operations Management”. The McGraw-Hill
Companies, Inc., New York.
[8] Gunasekarana, A., Patel, C., and McGaughey, R.E., 2004. “A framework for supply chain
[12]
Proceedings of the 19th International Conference on Production Research (July 29 – August 02,
2007, Valparaiso, Chile).
JJeenngg,, W-D., Tzeng, JJ--SS,, Cheng, SS--LL..,, 2009. “LP Based Programming Model for the Demand Management and Capacity Planning of TFT-
LCD Manufacturing”, Proceedings of the the
10th Asia Pacifi Industrial Engineering and Management Systems Conference, (Dec. 14 – 16,
Kitakhyushu, Japan).
performance measurement”, Int. J. Production
Economics, 87, p.p. 333–347.
[9] Lee, Y.H., Kim, S.H., 2000. “Optimal Production- Distribution Planning In Supply Chain Management Using Hybrid Simulation-Analytic
Approach”, Proceedings of the 2000 Winter
Simulation Conference, p.p. 1252-1259.
[10] Kilger, C. and Wagner, M., 2006. “Demand Planning”. In Stadtler, H. and Kilger, C. (ed),
Supply Chain Management and Advanced Planning: Concepts, Models, Software, and Case Studies, 4th Edition (Berlin: Springer), chapter
12, 442-456.
[11] Kengpol, A. and Kaoien, P., 2007. “A Procurement Planning Improvement by Using Linear Programming and Forecasting Models”,
[13] Yuniaristanto, Sutopo, W., and Asmorowati, A., 2008. “Material Planning and Control To Minimize The Total Inventory Cost In Djitoe
Itc, Inc.,” Proceedings of National Seminar
on Industrial System Planning 2008 (SNPSI 2008), p.p. 414-421. (March 27-28, Bandung,
Indonesia).
[14] Rizk, N. and Martel, A., 2001. “Supply Chain Flow Planning Methods: A Review of The Lot-
Sizing Literature”, Working paper DT-2001-AM-
1, Centre de Recherche Sur Les Technologies de
L’organisation Reseau (CENTOR), Université Laval, QC, Canada.
[15] Robinsona, P., Narayanan, A., and Sahin, F., 2009. “ Coordinated deterministic dynamic demand lot-sizing problem: A review of models