150
NUTRITIONAL STATUS OF POOR FAMILIES IN NORTH JAKARTA
Sandjaja1; Moesijanti Soekatri2; Yulianti Wibowo3; Basuki Budiman1 dan Sudikno1
1Puslitbang Gizi dan Makanan, Bogor 2Jurusan Gizi, Poltekkes Kemenkes, Jakarta II 3SEAMEO Tropmed RCCN Universitas Indonesia
ABSTRAK
STATUS GIZI PADA KELUARGA MISKIN DI JAKARTA UTARA
Dari berbagai masalah kekurangan zat gizi mikro di Indonesia, hanya kurang vitamin A (KVA), anemia khususnya akibat kurang zat besi, dan gangguan akibat kurang iodium (GAKI) saja yang sudah banyak diteliti. Prevalensi kekurangan zat gizi mikro tersebut masih tinggi sehingga menjadi masalah kesehatan masyarakat. Akan tetapi penelitian kekurangan zat gizi mikro yang lain masih terbatas. Selain itu kekurangan zat gizi mikro khususnya pada keluarga miskin masih belum banyak diteliti. Penelitian ini bertujuan mengetahui besaran masalah kekurangan zat gizi mikro di Jakarta Utara pada 300 keluarga miskin dan 100 keluarga hampir miskin di 4 kelurahan yang mempunyai anak balita. Semua anak balita menjadi sampel penelitian, sedangkan untuk kelompok umur lain yaitu anak usia sekolah, remaja, dan dewasa hanya diambil sub-sampel. Data yang dikumpulkan adalah konsumsi makanan dan darah vena untuk dianalisis kadar hemoglobin, serum ferritin, zat seng (zinc), dan asam folat, dan data morbiditas. Hasil penelitian menunjukkan konsumsi energi antara 1018 – 1702 kkal dan protein antara 26.7– 44.3 gram per hari. Konsumsi energi dan protein masih defisit terutama pada kelompok remaja dan dewasa. Menurut sosial ekonomi, konsumsi tersebut lebih rendah pada keluarga miskin dibanding keluarga hampir miskin. Prevalensi anemia pada keluarga miskin terendah pada remaja laki-laki (5,1%) dan tertinggi pada remaja perempuan (37,0%), sedangkan pada keluarga hampir miskin pada anak usia sekolah perempuan (13,3%) dan tertinggi pada wanita dewasa (27,8%). Prevalensi defisiensi besi pada keluarga miskin dan keluarga hampir miskin terendah pada dewasa laki-laki (0%) dan tertinggi pada remaja perempuan (37,0%). Defisiensi zinc terendah pada anak usia sekolah laki-laki (14,6%) dan tertinggi pada anak sekolah laki-laki (30,8%) dan wanita dewasa (38,9%).
Kata kunci: anemia, iron deficiency, zinc deficiency, poor family
BACKGROUND
ron, iodine and vitamin A deficiencies are still the most prevalent micronutrient deficiency problems in Indonesia. Currently, more than 100 millions of Indonesian are at risk of IDA. The available information for IDA based on the National Health and Household Surveys (NHHS) from 1995 and 2001 shows that the trend in the prevalence of IDA for pregnant women from 50.9% (1995) to 40% (2001). For women aged 15-44 years, the prevalence reduced from 39.5% (1995) to 7.9% (2001).1 This reduction is assumed to have been primarily due to iron supplementation activities which are aimed for pregnant and lactating women. IDA is also common among pre-school children, with a prevalence of 40% observed in 1992. Data collected in 1995 indicated no change in the prevalence, while more recent evidence indicated that the situation was deteriorating with almost half of all preschool children surveyed in 2001 having anemia
(48.1%). The problem is particularly high among younger children, under two years of age (>55%). These levels of anemia are higher than many countries in East Asia and the Pacific, except for Myanmar, Lao PDR, and Cambodia.2 Among school-aged children, the prevalence of IDA in 1992 was 31% and increased to around 50% in 1995.3 Data from Central and East Java in 1998 indicated that the prevalence of IDA among secondary and high school girls was 57.4% and 80.2% respectively. The prevalence was even higher among girls at reproductive age who registered to marry.4,5 Although the prevalence is high, there is no supplementation program for school girls.
The prevalence of iodine deficiency based on nationwide surveys among school children in 1980, 1998, and 2003 was 30.0, 9.8, and 11.0 percent.5,6
151 was 1.19% and 9.8% respectively. In 1992/93 the prevalence of VAD revealed a dramatic decrease of VAD. The prevalence of XN, X1B, X2/X3 was 0.13%, 0.33%, and 0.5% respectively. In 2007, a survey of children 6-59 months old in 46 districts showed the prevalence of xerophthalmia was 0.13 percent, and low serum retinol below 20 µg/dL was 14.6 percent.7
There is no information on micronutrient deficiencies among poor and near-poor families and the high risk in nutritional deficiencies. The purpose of the study is to assess dietary intakes and micronutrient deficiencies particularly iron, zinc, and folic acid among poor and near-poor families in North Jakarta.
METHODS
The study was a cross-sectional study directed to be able to provide information on nutritional status of poor and near-poor families in North Jakarta. The reference population of the study is poor and near-poor families. The study population is poor and near-poor families who have children under five year old living in North Jakarta. Samples of the study are all members of selected poor families, particularly those with high risk of anemia (children under five years old, school teenagers, and women of reproductive age).
Two sub-districts out of six sub-districts in North Jakarta were selected based on the highest proportion of poor families. In each sub-district, two villages with high proportion of poor families were selected. A member of the study team got a list of all poor and near-poor families having children below five years old in 4 selected villages from sub-district officer, health centers, statistics office, or village staff. Verification of the list of poor families was performed by using poor family ID card. A total of 300 poor families were randomly selected by using ENA software for the study. For every three poor families selected, a near-poor family living next to the poor families was selected. In each of poor and near-poor family, the youngest children 12-59 months old were selected, while only sub-samples were selected for school children, teenagers, and adult.8
Data collected were socio-economic status of the samples, family and individual dietary pattern using 24-hour dietary food intake, and
blood specimen analysis (hemoglobin, ferritin, folic acid, and zinc). All data were collected by trained enumerators for socio-economic status and dietary recall, and trained phlebotomist for cooling elements to appointed laboratory for analysis. Zinc assessment was done in the laboratory of SEAMEO Tropmed RCCN UI, while ferritin and folic acid were analyzed in the laboratory of PMI/Indonesian redcross. Before analysis, the sample of serum (for zinc) was stored in a frozen at – 20o Centrigrade or less (in the plastic tubes only). Hemoglobin status to measure anemia status using Hemocue was
Wheat flour based foods found frequently in the field were instant noodle, fresh noodle, bread, biscuits and snacks. Besides, wheat flour is also used for covering snacks such as molen banana, fried banana and fried tempeh (fermented soybean).
Instant noodles consist of 2 different types, the noodle that prepared with ingredients available in the pack with dried noodle and fried noodles. For fresh noodles, mostly it is consumed in the meals like meat ball noodle, chicken noodles, boiled noodles prepared by food vendors. A variety of bread is available including steam cake, were the kind of bread preferred by poor families especially sweet bread and filled bread. Pukis cake and ca-kue are grouped as snacks.
152 frequent than fresh noodle and bread. Wheat flour based food frequently eaten is biscuits (17 days per months). For fried products, even it is frequently consumed, but the amount of wheat
flour is low because it is used just for covering the main foodstuff. In general, wheat flour based food frequency pattern is slightly higher in poor families than that in near-poor families.
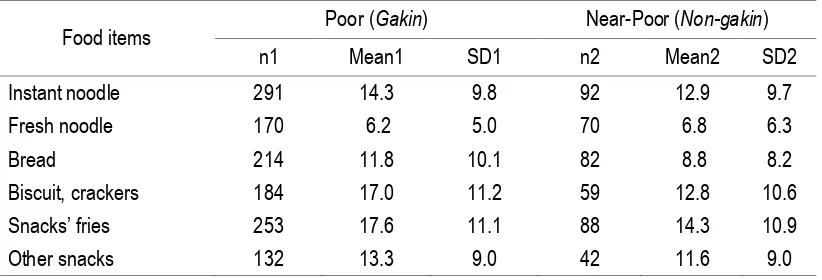
Table 1
The Frequency Score of Wheat Flour based Food Consumed per Month among The Poor and Near-Poor Families
Food items Poor (Gakin) Near-Poor (Non-gakin)
n1 Mean1 SD1 n2 Mean2 SD2
Instant noodle 291 14.3 9.8 92 12.9 9.7
Fresh noodle 170 6.2 5.0 70 6.8 6.3
Bread 214 11.8 10.1 82 8.8 8.2
Biscuit, crackers 184 17.0 11.2 59 12.8 10.6
Snacks’ fries 253 17.6 11.1 88 14.3 10.9
Other snacks 132 13.3 9.0 42 11.6 9.0
Table 1 above shows food frequency questionnaires asking wheat flour based food. Among food items listed above, only noodles which contribute significantly to dietary intakes. Table 2 shows average weight of noodles consumed by the poor is 25.5 gram per capita
per day, slightly higher compared to that in near-poor families. The frequency of instant noodle among poor is 14.3 days every month compared to near poor which is 12.9 days per months.
Table 2
The Average of Instant Noodle Consumption among The Poor (gram/capita)
Consumption of noodles Poor/ Near-poor n Mean SD SE
Consumption of instant noodle (gram/cap/day)
Poor 282 25.5 20.4 1.2
Near-poor 85 22.7 24.8 2.7
The frequency score of instant noodles (times/ month)
Poor 282 14.3 9.8 .6
Near-poor 85 12.9 9.7 1.04
Note: t (95%:365) = 0.281 (ns); mean difference =2.87 + 2.658 Among member of the family, the most
frequent in noodle consumption is teenage girls in poor families as shown in Table 3. On the other hand, among near-poor families, not only teenage girls who like instant noodle, but also school-age boy and children under-five year old (Table 4). Instant noodle is usually consumed
with rice and possibly to be eaten three times a day.
153 Table 3
The Average of Frequency Score of Instant Noodle Consumption among Poor Family Members
Age group Mean Std. Deviation
Men 15.1 10.39
Women 13.4 9.37
Teenage boy 13.9 11.51
Teenage girl 21.7 11.21
School-age boy 16.8 10.49
School-age girl 13.3 9.11
Under-five children 13.9 9.33
Table 4
The Average of Frequency Score of Instant Noodle Consumption among Near-Poor Family Members
Age group Mean Std. Deviation
Men 11.6 9.73
Women 10.6 8.31
Teenage boy 8.7 .
Teenage girl 18.0 14.55
School-age boy 20.3 10.92
School-age girl 13.9 11.51
Under-five children 22.8 10.26
Individual wheat flour consumption
In wheat flour consumption, it seems that there is no different between poor and near-poor families in term of the existence of wheat flour in the meals.
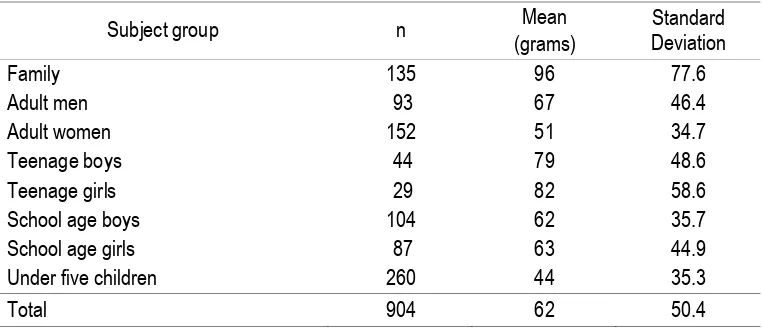
The average consumption of wheat flour as shown in Table 5 varies among subject groups
from 44–82 grams per day. In relation to wheat flour consumption, the highest number of wheat flour consumption is found in teenagers aged 13-17 years old both in boys (79 grams/day) and girls (82 grams/day).
Table 5
The Amount (grams) of Wheat Flour Consumption among Subject Groups
Subject group n Mean
(grams)
Standard Deviation
Family 135 96 77.6
Adult men 93 67 46.4
Adult women 152 51 34.7
Teenage boys 44 79 48.6
Teenage girls 29 82 58.6
School age boys 104 62 35.7
School age girls 87 63 44.9
Under five children 260 44 35.3
154 The Table indicates that among other age groups, teenagers consumed more wheat flour than other groups.
Individual dietary intakes
Dietary intake collected based on the 1 x 24 hour recall individually in all family members i.e. adult man, adult woman, teenage boy, teenage girl, school child-boy and school child-girls, and all children aged below 5 years. It is possible that in one family there was no teenager but there is school age child in the family or probably found teenager but no school child. But, for child under five years old (no matter whether boy or girls), all families must have at least one child since the criteria of selected
family was the existence of “balita”. The result on individual dietary intake both in poor families and near-poor families described as follow.
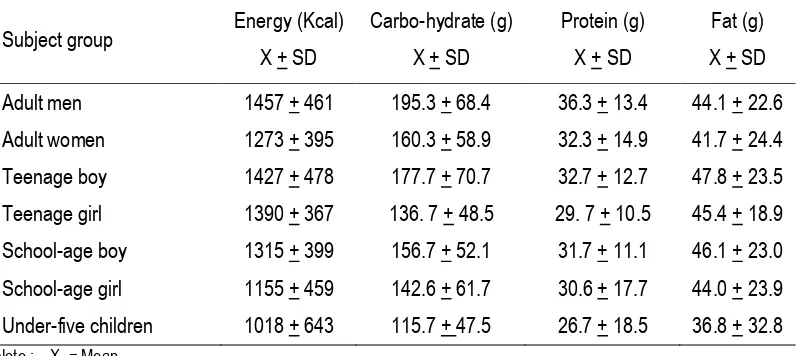
Macro-nutrients
Table 6 shows mean daily intake of energy, carbohydrate, protein and fat among different
age groups of poor families. Mean energy consumption of adult men was below (57-62%) recommended dietary allowances (RDA) of 2350-2550 kilocalorie (kcal), and adult women was also below (62-71%) RDA 1800-1900 kcal per day. Mean energy consumption of teenage boys was also below (54-55%) RDA of 2400-2600 kcal and teenage girls (59-63%) RDA of 2200-2350 kcal per day. Mean energy consumption of school-age boys and girls was also below (56-64%) RDA of 2050 kcal per day. Mean deficit in energy consumption in children below 5 years old was lower (65-101%) compared to other age groups. Mean protein consumption of adult men was below (60%) RDA of 60 grams, and adult women was also below (65%) RDA 50 grams per day. Mean protein consumption of teenage boys was also below (54%). RDA of 60 grams and teenage girls (59%) RDA of 50 grams per day. Mean protein consumption of school-age boys and girls was also below (61-70%) RDA of 45-50 grams per day.
Table 6
The Distribution of Macro-Nutrients Consumption among Studied Subject Group of Poor Family
Subject group Energy (Kcal) X + SD
Carbo-hydrate (g)
X + SD
Protein (g)
X + SD
Fat (g)
X + SD
Adult men 1457 + 461 195.3 + 68.4 36.3 + 13.4 44.1 + 22.6
Adult women 1273 + 395 160.3 + 58.9 32.3 + 14.9 41.7 + 24.4
Teenage boy 1427 + 478 177.7 + 70.7 32.7 + 12.7 47.8 + 23.5
Teenage girl 1390 + 367 136. 7 + 48.5 29. 7 + 10.5 45.4 + 18.9
School-age boy 1315 + 399 156.7 + 52.1 31.7 + 11.1 46.1 + 23.0
School-age girl 1155 + 459 142.6 + 61.7 30.6 + 17.7 44.0 + 23.9
Under-five children 1018 + 643 115.7 + 47.5 26.7 + 18.5 36.8 + 32.8 Note : X = Mean
SD = Standard deviation
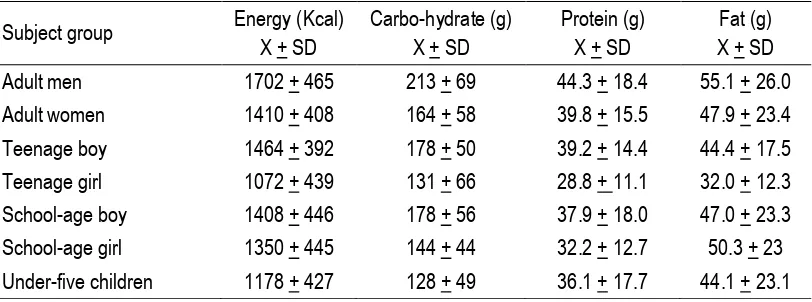
Table 7 shows the same figure in Table 1 of mean daily intake of energy, carbohydrate, protein and fat among different age groups of near-poor families. Mean daily dietary intakes in
155 Table 7
The Distribution of Macro-Nutrients Consumption among Studied Subject Group of Near-Poor Family
Subject group Energy (Kcal) X + SD
Carbo-hydrate (g) X + SD
Protein (g) X + SD
Fat (g) X + SD
Adult men 1702 + 465 213 + 69 44.3 + 18.4 55.1 + 26.0
Adult women 1410 + 408 164 + 58 39.8 + 15.5 47.9 + 23.4
Teenage boy 1464 + 392 178 + 50 39.2 + 14.4 44.4 + 17.5
Teenage girl 1072 + 439 131 + 66 28.8 + 11.1 32.0 + 12.3
School-age boy 1408 + 446 178 + 56 37.9 + 18.0 47.0 + 23.3
School-age girl 1350 + 445 144 + 44 32.2 + 12.7 50.3 + 23
Under-five children 1178 + 427 128 + 49 36.1 + 17.7 44.1 + 23.1 Note : X = Mean
SD = Standard deviation
Vitamins and minerals
Table 8 below shows mean daily dietary intakes of vitamin A and C, and minerals of calcium, iron and phosphor of different age groups of poor families. The lowest and highest mean intake of vitamin A was found in school-age girls and adult women. However, vitamin A intakes in all age groups was lower than the RDA. Mean intake of vitamin C was found between 8.6-27.2 milligrams per day, where the intakes were still lower than RDA of vitamin C of
40-90 milligrams per day. Mean intake of calcium was found between 157-249 milligrams per day, where the intakes were still lower than RDA of calcium of 500-1000 milligrams per day. Deficit was also found in mean daily consumption of iron ranging from 6.5-8.9 milligrams per day while the RDA was between 8-26 milligrams per day. Deficit was also found in mean daily consumption of phospor ranging from 332-401 milligrams per day while the RDA was between 400-1000 milligrams per day.
Table 8
The Distribution of Micro-Nutrients Consumption among Studied Subject Group of Poor Family
Subject group
Vitamin A total (SI)
X + SD
Calcium (mg) X + SD
Vitamin C (mg) X + SD
Iron (mg) X + SD
Phospor (mg) X + SD Adult men 2698 + 3902 195 + 105 23.4 + 25.8 8.9 + 4.0 401 + 169 Adult women 2885 + 4291 203 + 197 27.2 + 49.8 8.5 + 5.5 367 + 166 Teenage boy 1940 + 2794 157 + 82 13.1 + 23.6 7.8 + 3.5 367 + 156 Teenage girl 1790 + 1841 181 + 236 15.4 + 18.1 7.1 + 3.7 332 + 183 School-age boy 1648 + 2941 178 + 112 8.6 + 12.3 7.5 + 3.9 368 + 126 School-age girl 1607 + 2441 189 + 313 12.7 + 31.7 8.2 + 13.6 359 + 264 Under-five children 1937 + 3150 249 + 280 15.3 + 25.8 6.5 + 17.8 338 + 261 Note : X = Mean
SD = Standard deviation
Table 9 below shows the same figure of mean daily dietary intakes of vitamin A and C, and minerals of calcium, iron and phosphor of different age groups of near-poor families. Mean
156 Table 9
The Distribution of Micro-Nutrients Consumption among Studied Subject Group of Near-Poor Family
Subject group
Vitamin A total (SI)
X + SD
Calcium (mg) X + SD
Vitamin C (mg) X + SD
Iron (mg) X + SD
Phospor (mg) X + SD Adult men 2764 + 2409 256 + 179 34.6 + 38.0 10.2 + 5.6 520 + 216 Adult women 2890 + 2110 252 + 157 34.5 + 41.4 9.3 + 5.6 485 + 206 Teenage boy 1494 + 1458 217 + 103 11.9 + 11.3 8.3 + 4.0 478 + 169 Teenage girl 1831 + 947 208 + 63 14.8 + 17.3 5.5 + 3.3 402 + 138 School-age boy 2082 + 2052 247 + 163 9.0 + 8.3 6.9 + 2.4 455 + 242 School-age girl 1641 + 1508 183 + 128 9.7 + 13.7 6.7 + 3.7 404 + 173 Under-five children 2893 + 6827 408 + 535 25.1 + 58.6 6.9 + 20.6 454 + 1016 Note : X = Mean
SD = Standard deviation
Micronutrient status of poor family members Analysis of blood specimen taken is for determination of hemoglobin concentration, ferritin, zinc, and folic acid status of the subjects. Only sub-samples of each subject group were taken their blood specimen.
Hemoglobin level
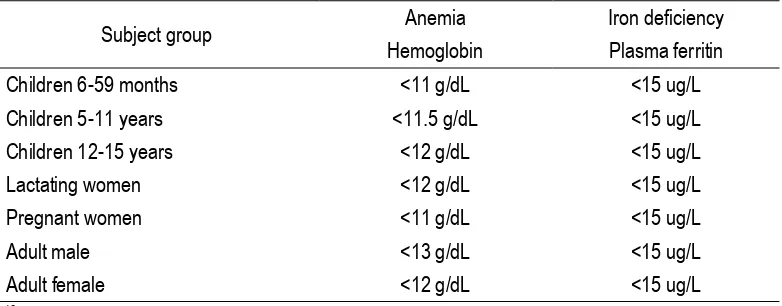
For hemoglobin assessment venous blood was used to measure hemoglobin concentration. Table 10 shows the cut-off point in determining anemia and iron deficiency among subject groups.
Table 10
Cut-off Point for Determination of Anemia and Iron Deficiency10
Subject group Anemia Iron deficiency
Hemoglobin Plasma ferritin
Children 6-59 months <11 g/dL <15 ug/L
Children 5-11 years <11.5 g/dL <15 ug/L
Children 12-15 years <12 g/dL <15 ug/L
Lactating women <12 g/dL <15 ug/L
Pregnant women <11 g/dL <15 ug/L
Adult male <13 g/dL <15 ug/L
Adult female <12 g/dL <15 ug/L
10Ref: WHO, 2001
Table 11 shows that the prevalence of anemia in general is higher in poor families than in near-poor families in almost all subject groups except adult women. The highest difference in
157 Table 11
Prevalence of Anemia by Subject Group and Economic Status
Subject group Prevalence of anemia
Poor Near-poor
Adult men 8.2 *
Adult women 13.5 27.8
Teenage boys 5.1 *
Teenage girls 37.0 *
School age boys 16.3 15.4
School age girls 18.8 13.3
Under five children 36.4 13.8
Note: * not enough sample size
Ferritin
Plasma ferritin was analyzed using sandwich ELISA. The value of plasma ferritin was categorized following the guideline as shown in Table 5. As shown in Table 12 below, the prevalence of iron deficiency as measured
by low ferritin concentration varies between 0 to 27.5 percent. The highest prevalence of low ferritin was found in children below 5 years old (27.5%). In general, the prevalence of low ferritin level is slightly lower in subject of near-poor families.
Table 12
Prevalence of Iron Deficiency by Subject Group and Economic Status
Subject group
Prevalence of iron-deficiency (ferritin <15 ug/L)
Poor Near-poor
Adult men 0.0 0.0
Adult women 9.0 16.7
Teenage boys 10.3 11.1
Teenage girls 37.0 *
School age boys 14.0 7.7
School age girls 22.9 20.0
Under five children 27.5 23.3
Note: * not enough sample size (< 20)
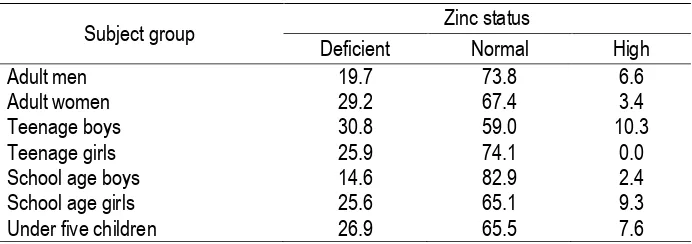
Zinc
Zinc status was classified into three categories, namely deficient for <10.7 umol/l,
normal for 10.7-20 umol/l, and high for >20 umol/l.11,12 Result of zinc analysis was presented in Table 13 below.
Table 13
Zinc Status by Subject Group in Poor Families
Subject group Zinc status
Deficient Normal High
Adult men 19.7 73.8 6.6
Adult women 29.2 67.4 3.4
Teenage boys 30.8 59.0 10.3
Teenage girls 25.9 74.1 0.0
School age boys 14.6 82.9 2.4
School age girls 25.6 65.1 9.3
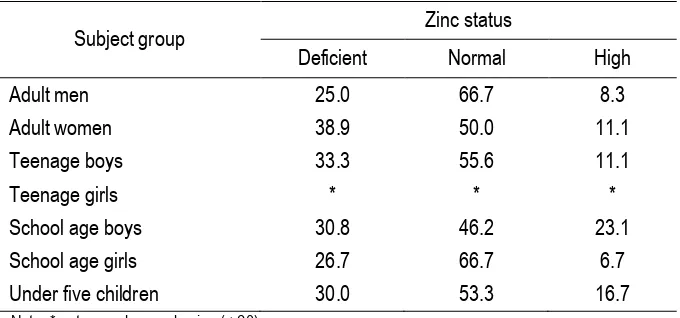
158 Result of zinc status showed that most of the subjects had zinc in their blood in normal range. Table 14 shows that the prevalence of zinc deficiency among subjects in poor families varies form 14.6 percent in school-age boys and 30.8 percent in teenage boys. Table 9 below shows the prevalence of zinc deficiency among
subjects in near-poor families which varies between 26.7 percent in school-age girls to 38.9 percent in adult women. Comparing Table 8 and 9, the finding shows that in general, the prevalence of zinc deficiency tends to be higher in subjects of near-poor families.
Table 14
Zinc Status by Subject Group in Near-Poor Families
Subject group Zinc status
Deficient Normal High
Adult men 25.0 66.7 8.3
Adult women 38.9 50.0 11.1
Teenage boys 33.3 55.6 11.1
Teenage girls * * *
School age boys 30.8 46.2 23.1
School age girls 26.7 66.7 6.7
Under five children 30.0 53.3 16.7
Note: * not enough sample size (< 20)
High prevalence of zinc deficiency in both poor and near-poor families may be caused by factors influencing zinc absoption including other minerals and trace elements, proteins, vitamins, phytic acid, physiological factors, and disease process. Some dietary minerals may alter zinc absorption. Many studies found that iron has been shown to interfere with zinc absorption. Inhibitory factors for zinc absorption are also found in soy protein (high phitate content) such as coffee, tea, various bean etc.
Folic acid
For folic acid assessment venous blood was used to measure folic acid concentration. Table 15 shows the mean of folic acid concentration in adult women and children under five years old living in poor and near-poor families. It shows that there is similarity of folic acid in poor and non-poor families. No deficient was found both groups. The deficient status of folic acid is less than 7 nmol/L.13
Table 15
Distribution of Folic Acid Status by Subject Group and Economic Status
Subject group Folic acid status nmol/L (X + SD)
Poor Near-poor
Adult women 13.2 + 3.84 -
Under five children 14.0 + 4.62 13.7 + 4.20
Clinical assessment
Clinical assessment was applied to the selected target prior to blood taken. It is primarily intended to assess the general physical condition of the subject as well as to
159 Table 16
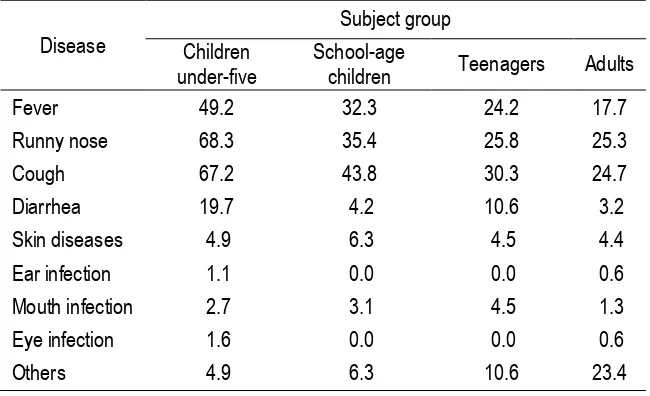
Morbidity Status by Subject Group of Poor Families in The Last One Month*
Disease
Subject group Children
under-five
School-age
children Teenagers Adults
Fever 49.2 32.3 24.2 17.7
Runny nose 68.3 35.4 25.8 25.3
Cough 67.2 43.8 30.3 24.7
Diarrhea 19.7 4.2 10.6 3.2
Skin diseases 4.9 6.3 4.5 4.4
Ear infection 1.1 0.0 0.0 0.6
Mouth infection 2.7 3.1 4.5 1.3
Eye infection 1.6 0.0 0.0 0.6
Others 4.9 6.3 10.6 23.4
Table 17
Morbidity Status by Subject Group of Near-Poor Families in The Last One Month*
Disease
Subject group Children
under-five
School-age
children Teenagers Adults
Fever 51.4 32.1 45.5 6.7
Runny nose 51.4 35.7 36.4 20.0
Cough 51.4 42.9 36.4 23.3
Diarrhea 8.6 7.1 0.0 6.7
Skin diseases 2.9 3.6 0.0 3.3
Ear infection 0.0 0.0 0.0 0.0
Mouth infection 2.9 3.6 0.0 0.0
Eye infection 0.0 0.0 0.0 3.3
Others 5.7 3.6 18.2 20.0
* Multiple answers
Table 16 and 17 shows the morbidity status during one month period preceding clinical examination in poor and near-poor families. The Table shows that most commonly symptoms of diseases of children aged below five years is fever (49.2-51.4%), running nose (51.4-68.3%), and cough (51.4-67.2%).
About 27 percent of them having the diseases had not yet been treated. Some people just bought medicine from nearby small kiosk. Among subject screened, about 91% were eligible to be taken their blood. Among
groups, under five years old children, who consider as group at health risk, were found to have higher proportion (p<0.05) of having those diseases compared to other groups.
DISCUSSION
160 The persistent problem of anemia for all age groups might be related to several issues, such as low compliance on iron supplementation; problem of interaction between macro and micronutrients, and within micronutrients; insignificant effect of iron fortification just started in 1999/2000; as well as poverty problem.
Social sector including preventive-promotive health and nutrition in general is put as a low priority by a local government. Some local government may set nutrition as priority program, however with wrong policy due to misconception of nutrition. This problem affects strategy of micronutrient program at local level.
The strategy for controlling micronutrient deficiencies is the same as other countries: food diversification, supplementation, and fortification14. The food diversification strategy comprising nutrition education, food production, supply and consumption. Since better food consumption (food diversification) mostly dependent on income, efforts to diversify food consumption will be hampered by the fact that the incidence of poverty increased during and after economic crisis (30-40%).
The second program in fortification is iron and zinc fortification in wheat, which was started in 1999. Recent data indicates increasing trend of wheat consumption (mostly in the form of noodle), in all economic strata of the Indonesian people in the form of noodle.15
In the context of micronutrient program, data collection capability should be directed towards relevant issues of food-based (dietary guidelines), fortification and supplementation. For example for fortification program, collection of food consumption pattern data of various economic strata, culture and areas is a prerequisite.9,14
This study shows that between near poor and poor families, the consumption of almost all macronutrients is slightly higher among near poor compared to poor families except in teenage girls and in teenage boys on fat intake, but this difference is not significant statistically. Among poor and near poor family, the food pattern and the quantity are similar but all is under the Recommended Dietary Allowances (RDA) for Indonesians.
The average consumption of wheat flour among subject groups was varied from 44 – 82 grams per day, with mean of 62
gram/capita/day. These data were a bit different to the figure reported by Flour Fortification Initiative.16 In that report, Indonesia as one of the mandatory flour fortification countries in the South East Asia had wheat flour consumption close to 50 gram/capita/day, whereas Philippines had wheat flour consumption more than Indonesia, about 80 gram/capita/day. Comparing 5 countries that have mandatory fortification (added iron or/and folic acid) in wheat flour, namely Canada, USA, Australia, Philippines and Indonesia, the consumption of wheat flour in Indonesia is the lowest.16 With the mean intake of 51 gram, it may contribute about 0.102 mg of folic acid (mandatory is 2 ppm for folic acid17). Since Indonesia has not have Folic Acid Recommended Dietary Allowance (RDA), we use folic acid US RDA. The RDA for adult women was about 400 microgram or 0.4 mg. This means, about 1/4 of folic acid RDA had been contributed by fortified wheat flour. In addition, for children under five, who was the highest consuming noodles among family’s member in near poor, the mean intake was 44 microgram or 0.04 mg and the US RDA was between 150-200 microgram per day or 0.15-0.2 miligram. This means about 1/4 to 1/5 of RDA was contributed from fortified wheat flour consumption. In facts, the blood assessment indicates that all subjects were in a normal range (N = 2.7-17.0 nanogram/ml). This figure is probably due to contribution of folic acid from wheat flour such as snack fries, biscuits, and noodles among poor and near poor families. According to FFI report, the trend of noodles consumption increases every year, especially in Indonesia and Vietnam. This indicates that fortified wheat flour would be giving more benefit especially for iron, zinc, vitamin B1 and B2, and folic acid.
In term of frequency, the snacks’ fried was more popular among poor and near poor due to more practice and cheaper compared to noodles. However, comparing poor and near poor families, the consumption of instant noodle was higher in poor (25.5 gram) than near poor (22.7 gram) as also the frequency of consuming noodle, higher in poor (14.3%) than near poor (12.9%).
161 mostly at teenage boys (30.8%) in poor families, whereas in near poor families, mostly found in adult women (38.9%). Since these problem are commonly found among children and women childbearing age, the mandatory fortification regulation for wheat flour is still needed. This study convinces that beneficial of mandatory with 5 selected nutrients is really valuable and goes to the all age groups, especially the poor and near poor who are vulnerable to have micronutrient deficiency.
REFERENCES
1. Ministry of Health. Survei Kesehatan Rumah tangga (National Health and Household Survey). MOH, Jakarta, 1995. 2. UNICEF and MI. Vitamin and Mineral
Deficiency. A Global Progress Report. UNICEF, 2004.
3. Matulessy, P.F., Iron Deficiency Anaemia in Indonesia. Southeast Asian J Trop Med & Pub Hlth. 1992: 23 suppl 3:3-16
4. Direktorat Gizi. Program Penanggulangan Anemia Gizi pada Wanita Usia Subur, Jakarta, Ditzi, 2003.
5. Departemen Kesehatan. Gizi dalam Angka. Jakarta, Depkes, 2003.
6. Ministry of Health, Directorate of Community Nutrition. Final Report: Technical Assistance for Evaluation on Intensified Iodine Deficiency Control Project (IBRD Loan No. 4125-IND). PPA Consultants, np, nd. 2004.
7. Herman S. et al. Studi masalah gizi mikro di Indonesia: Perhatian khusus pada kurang vitamin A (KVA), anemia, dan seng. Puslitbang Gizi dan Makanan, 2007.
8. Lemeshow S.; Hosmer D.W.; Klar J.;Lwanga S.K. Besar Sampel Dalam Penelitian Kesehatan. Yogyakarta, Gajah Mada University Press, 1997.
9. Varkeuisser C.M.; Pathmanathan I.; Brownlee A. Designing and Conducting Health Systems Research Projects. IDRC Health Systems Research Training Series, Vol. 2 Part 1, Ottawa, IDRC, 1991.
10. WHO. Iron Deficiency Anemia: assessment, prevention and control, A guide for programme managers. 2001. 11. Cornelis R, B. Heinzow, RFM Herber, J
Molin Christensen, OM Poulsen, E Sabbioni, DM Templeton, Y Thomassen, M Vahter, and O Vesterberg (1996) Sampling Collection guidelines for trace elements in blood and urine. J. Trace elements Med Biol. 1996; 10;103-127.
12. Howerde E. Souberlich. Assessment of Nutritional Status. 1999.
13. Handbook of Vitamin, CRC press, 4th edition.
14. Soekirman. Fortifikasi dalam program gizi: Apa dan mengapa. Jakarta, Koalisi Fortifikasi Indonesia, 2006.
15. Wijaya B., S. Natakusumah, D. Martianto, M. Soekatri, Soekirman. Review on the QA/QC of wheat flour fortification in Indonesia and plan of action (POA) for its improvement. Jakarta, the Micronutrient Initiative, 2005.
16. Flour Fortification Initiative. Flour Fortification in The Region, Karen Codling, FFI east Asia Secretariat, 2009.
17. Departemen Kesehatan, Surat Keputusan
Menteri Kesehatan Nomor;