A new and simple calibration-independent method for measuring the beam
energy of a cyclotron
Katherine Gagnon
a,n, Mikael Jensen
b, Helge Thisgaard
b,1, Julia Publicover
c,2, Suzanne Lapi
c,3,
Steve A. McQuarrie
a, Thomas J. Ruth
ca
Cross Cancer Institute, Edmonton PET Centre, University of Alberta, Edmonton, AB, Canada T6G 1Z2 b
Hevesy Laboratory, Risoe-DTU, Technical University of Denmark, Frederiksborgvej 399, DK-4000 Roskilde, Denmark c
TRIUMF, 4004 Wesbrook Mall, Vancouver, BC, Canada V6T 2A3
a r t i c l e
i n f o
This work recommends a new and simple-to-perform method for measuring the beam energy of an accelerator. The proposed method requires the irradiation of two monitor foils interspaced by an energy degrader. The primary advantage of the proposed method, which makes this method unique from previous energy evaluation strategies that employ the use of monitor foils, is that this method is independent of the detector efficiency calibration. This method was evaluated by performing proton activation ofnatCu foils using both a cyclotron and a tandem Van de Graaff accelerator. The monitor foil
activities were read using a dose calibrator set to an arbitrary calibration setting. Excellent agreement was noted between the nominal and measured proton energies.
&2010 Elsevier Ltd. All rights reserved.
1. Introduction
When used for medical radionuclide production, both new and old cyclotrons need to have their beam energy checked periodi-cally. This is not only part of good manufacturing practice and quality assurance but is also necessary for optimising target yields and minimising the radiation dose overhead of radionuclide production. An example where such a validation is of particular importance is when undesired by-products result from competing energy-dependent reactions (e.g. production of123I via the (p,2n)
reaction when producing 124I from 124Te). Although it is often
claimed by cyclotron operators that the energy of their machines ‘‘never change’’, were ‘‘locked at the factory’’ or were ‘‘carefully determined at acceptance testing’’, from our experience, this is not valid for the majority of present day negative ion cyclotrons. The extraction of negative ion beams by a stripper foil can give useful beam on targets even with substantial orbit centre offsets. Changes in magnet shim or in distribution of the RF field along the
deescan cause the orbital centre to drift. Furthermore, the loss of position calibration or damage to extractors and stripper foils can also substantially affect the beam energy. While cyclotrons in
nuclear physics institutions often have analysing magnets with well characterized energy definition, this diagnostic tool is not feasible for most medical cyclotron configurations as the produc-tion targets sit more or less straight on the beam port with little or no further collimation. As such, an off-line approach for evaluat-ing the beam energy of a medical cyclotron is required.
For most applications the simple method of beam range determination will not be accurate enough due to straggling. Long stacks increase straggling, and it can be difficult by conventional ‘‘burn’’ methods to discriminate the Bragg peak end from thermal damage. For this reason, we investigated a new, simple-to-perform method for evaluating the cyclotron beam energy. By using the universally available dose calibrator (a re-entrant ion chamber used in every nuclear medicine facility), the proposed method is sufficiently sensitive to achieve the necessary precision of a few tenths of an MeV. Furthermore, the proposed method requires neither energy nor efficiency calibration of the detector system being used. The method works for an arbitrary dose calibrator setting. The proposed method was extensively evalu-ated and tabulevalu-ated for protons in the 11–19 MeV energy range, but it should be straightforward to extend the general principle to protons, deuterons and alphas of other energies.
2. Theory
Although beam monitor reactions have been extensively published, evaluated and used for many years (see for example,
Contents lists available atScienceDirect
journal homepage:www.elsevier.com/locate/apradiso
Applied Radiation and Isotopes
0969-8043/$ - see front matter&2010 Elsevier Ltd. All rights reserved. doi:10.1016/j.apradiso.2010.09.012
n
Corresponding author. Tel.: + 1 780 432 8776; fax: + 1 780 432 8615.
E-mail address:[email protected] (K. Gagnon).
1
Present address: PET- and Cyclotron Unit, Nuclear Medicine Department, Odense University Hospital, DK-5000 Odense, Denmark
2
Present address: University Health Network, Toronto, Canada
3Present address: Mallinckrodt Institute of Radiology, Washington University,
http://www-nds.iaea.org/medportal/ ‘‘monitor reactions’’), the reliable use of these methods, at present, requires access to and knowledge of a well calibrated detector system (typically an HPGe gamma spectroscopy setup). When irradiating a single, thin foil, the production of a radionuclide is given by
A¼nI
s
ð1eltbÞ, ð1Þ
whereAis the activity of the nuclide at the end of bombardment
(EOB),nis the number of target nuclei per unit area,Iis the proton
current (protons/second),
s
is the energy dependentcross-section,
l
is the decay constant for the nuclide and tb is thebombardment time. Given that the cross-sections for the reaction of interest are well characterized, then the beam energy may be
determined by measuringAand having an accurate knowledge
of then,I,
l
andtbterms. Due to variations in the foil thicknessand/or beam current, an examination of the activity ratio of two isotopes produced simultaneously via competing reactions (i.e. (p,n) and (p,2n)) within a single foil can be beneficial (Blessing et al., 1995; Scholten et al., 1994):
Aj
Ak
¼
s
jð1eljtbÞ
s
kð1elktbÞ ð2ÞThe primary drawback in evaluating the beam energy using (1) or (2) is that both require absolute quantification of the produced radioisotope activity. Incorrect or offset efficiency calibration for the gamma detector in question can therefore seriously compro-mise the results.
As opposed to irradiating a single monitor foil, it has been proposed earlier to use a stack of copper foils and then analyse every single foil by high resolution gamma spectroscopy for the isotopes 62Zn and65Zn (Kim et al., 2006; Blessing et al., 1995;
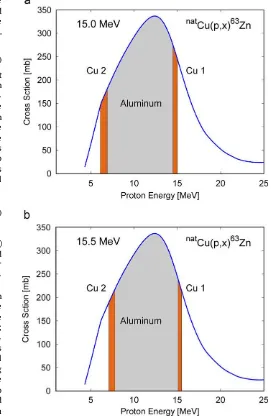
Scholten et al., 1994). To overcome the need for gamma spectro-scopy and high quality efficiency calibrations, this study suggests the irradiation of two monitor foils of the same material interspaced by an energy degrader (Fig. 1). By carefully choosing both the monitor foil material and degrader thickness, the differential activation of the two monitor foils may be used to determine the beam energy. This effect is illustrated inFig. 2a and b for proton energies of 15.0 and 15.5 MeV incident on two 25
m
mcopper foils which sandwich an 875
m
m aluminum degrader. Themajor advantage of examining the ratio of two identical isotopes produced in the two foils (i.e. 63Zn/63Zn), as opposed to, for
example, the63Zn/62Zn ratio resulting from proton irradiation of a
single copper monitor foil, is that all detector efficiency calibra-tion requirements are eliminated. Furthermore, the exponential factors in (2) will also cancel as
l
j¼l
kfor the proposed method:Aj Foil1
Aj Foil2
¼
s
j Foil1s
j Foil2 ð3ÞThrough careful selection of the energy degrader thickness, this method can be used efficiently and with high precision.
Since this activity ratio may be predicted using well known published recommended cross-section data and the SRIM
soft-ware package (Ziegler et al., 2009), we have developed and
included a simple lookup table (Table 1) which may be used
universally for monitoring the proton energy given experimental evaluation of the activity ratio.
3. Materials and methods
To evaluate the proposed method, this study measured the
63Zn activity ratio produced during the proton irradiation of two
copper foils interspaced by an aluminum energy degrader. Initial measurements were performed at the Edmonton PET Centre (EPC) using a TR 19/9 negative ion variable energy cyclotron (Advanced Cyclotron Systems Inc., Richmond, BC). A set of six additional measurements were also performed using the tandem Van de Graaff at Brookhaven National Lab (BNL) in New York. As the incident proton energy is known with greater accuracy when
Fig. 1.The configuration of the two copper foils and aluminum energy degrader irradiated in this experiment. When discussing the entrance and exit energies of the copper foils, this refers to locationsAandB, respectively, for foil #1 andCand
D, respectively, for foil #2. The above figure is not to scale—the copper foil
thicknesses have been exaggerated for the purpose of illustration.
Fig. 2.A comparison of the63
Zn activation for two 25mm copper foils and an 875mm aluminum degrader given incident proton energies of (a) 15.0 MeV and (b) 15.5 MeV. As noted, a small change in the incident energy can yield a measurable change in the 63
using an electrostatic accelerator, as compared to a cyclotron, the measurements at BNL were performed to serve as a further validation of the proposed method.
3.1. Monitor foils
Copper foils were the preferred choice for evaluating the
proton energy for this study as the natCu(p,x)63Zn excitation
function is well characterized (IAEA, 2009), and copper foils of
sufficient quality and purity (Z99.99%) can be purchased from
many commercial suppliers (i.e. Alfa Aesar&
, Goodfellows&
, etc.). As long as the monitor foils are kept relatively thin (i.e.r25
m
m), so as to minimize the finite energy loss through the foil, the actual thickness of the foils is not of great importance as it may be measured and corrected for. It should be noted however that all recommended values given in this manuscript are based on theuse of 25
m
m copper monitor foils. To minimize the foil-to-foilvariations in purity and thickness, and ensure that the two foils are of equal thickness, it is essential that the two foils are cut from the same manufactured sheet or roll. For improved accuracy over a screw micrometer, the foil thicknesses in this study (both of aluminum and copper) were found by weight determination
using a 10.0 cm10.0 cm square of foil. Although the thickness
variations across the foils were not measured, we have investi-gated the impact of small variations in the average thickness by utilizing both the measured and nominal foil thicknesses to determine the proton energy.
3.2. Degrader thickness
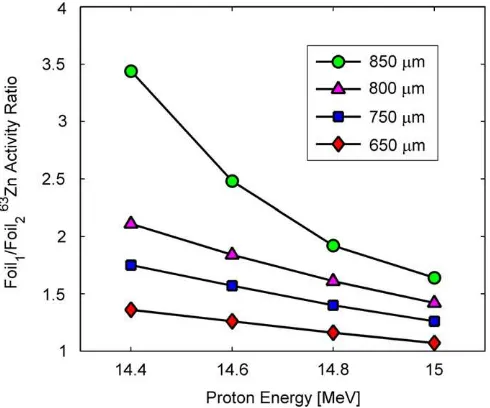
As noted inFig. 3, as the degrader thickness is increased, an
increased range in the 63Zn expected activity ratio is observed
(therefore increasing the sensitivity of the technique). Striving to achieve a reasonably thick aluminum degrader, it is immediately noted that one thickness will not be suitable for the entire 11–19 MeV energy range of interest. For example, if we consider a
degrader which is sufficiently thick to drop 10 MeV given
Ep¼17 MeV, such a degrader would certainly be too thick to allow
for activation of the second copper foil given an incident energy of 11 MeV. As such, we have proposed a set of recommended
thicknesses (Table 1) broken into nine energy windows between
the range of 11 and 19 MeV. Consequently, to use the recom-mended data ofTable 1, it is assumed that there is a rough idea (within approximately 1 MeV) of the proton energy in question.
In developing the set of recommended degrader thicknesses of
Table 1, the goal was to utilize (as noted above) a reasonably thick degrader for increased sensitivity. What makes a thickness ‘‘reasonable’’? If the degrader is too thick, there will be a large difference in the proton energy between the entrance and exit
surface of the second copper foil. Due to large non-linearities in the proton stopping power at low energies, a large difference in energy across the foil is undesired as the technique becomes increasingly susceptible to both thickness non-uniformities and errors in the thickness measurements. For this reason, the recommended degrader thicknesses were selected, so that the average proton exit energy of the second copper foil was expected to be no less than 5.2 MeV (determined using simulations in SRIM (Ziegler et al., 2009)). This value of 5.2 MeV was selected for two reasons. Firstly, this value is 1.0 MeV above the 63Cu(p,n)63Zn
reaction threshold (NNDC, 2009). Thus, despite any energy
straggling, all protons should have sufficient energy, so that the possibility exists for them to undergo a reaction within the foil.
Next, for a 25
m
m copper foil, this minimum exit energy ensuresan average energy drop of no greater than 1 MeV between the entrance and exit surface of the second copper foil. We considered this 1 MeV energy drop acceptable, as the IAEA recommended cross-sections (reported in steps of 0.1 MeV) for thenatCu(p,x)63Zn
reaction are highly linear (R2
40.98) over any floating 1 MeV
interval in the energy range of interest for the second copper foil.
3.3. Expected activity ratio
To evaluate the proton energy from the measured activity ratio, a plot of proton energy as a function of the expected activity
Table 1
The recommended aluminum degrader thicknesses and second order curve fitting terms.
Aluminum thickness (lm) Energy range (MeV) Second order termA First order termB Constant termC Expected activity ratio range
350 10.8–11.8 1.3811 6.8958 19.408 1.55–2.50 500 12.0–12.8 0.7058 4.0449 17.795 1.65–2.85 625 13.0–13.8 0.5352 3.1150 17.527 1.50–2.85 750 14.0–14.8 0.5223 2.7947 17.696 1.30–2.40 875 15.0–15.6 0.5254 2.5192 17.837 1.05–1.80 1000 15.8–16.4 0.7218 2.8021 18.380 0.80–1.50 1125 16.6–17.2 1.1060 3.3724 19.029 0.60–1.20 1250 17.4–18.0 2.1607 4.7938 19.934 0.45–0.85 1375 18.2–18.8 4.5682 7.3352 21.028 0.35–0.65
E(MeV)¼Ar2+Br+C, whereris the63Zn activity ratio between front and back copper foil.
The straggling and the energy loss of a nominal 25mm aluminum vacuum window are included in the calculations. The energy calculated is the energy incident on this vacuum foil.
Fig. 3.The expected63
ratio is required. In calculating the expected activity ratio, it is first necessary to determine the effective energy within the two copper monitor foils for a given incident energy. This was achieved by simulating 1000 ions in the TRIM module of the SRIM software package (Ziegler et al., 2009). As the copper foils were of finite thickness, the effective energy within the foil was taken as the average between the entrance and exit foil energy. These effective energies were then employed to evaluate the corresponding effective cross-sections within the two monitor foils. This was achieved using polynomial interpolation of the
IAEA recommended cross-section data for the natCu(p,x)63Zn
reaction (IAEA, 2009). Finally, the activity ratio was then
calculated from Eq. (3) using the effective 63Zn cross-sections
of the two copper foils. It should be noted that error in the magnitude of the IAEA cross-section data will not impact the results as it is the shape of the excitation function which dictates the cross-section ratio.
For purpose of comparison, the expected activity ratios were determined by simulating the proton energy both using (i) the nominal foil thicknesses reported by the manufacturer, and (ii) the measured foil thicknesses. It is important to note that in
addition to the Cu/Al/Cu foil sandwich, a 25
m
m aluminumvacuum window is employed as part of the TR 19/9 cyclotron target system. As this vacuum foil was included in all energy
simulations, the energy calculated using the data from Table 1
represents the energy incident on this vacuum foil.
3.4. Irradiation parameters
A total of twelve irradiations were performed on the TR 19/9 cyclotron. All foils were positioned normal to the incident beam and electrically isolated from the target nose-piece. Foils were
irradiated for 300 s with approximately 1
m
A of proton beamcurrent. In order to validate the proposed method in the 11 MeV
range, an aluminum degrader (375
m
m nominal thickness) wasinstalled adjacent to the vacuum window as the TR 19/9 cyclotron has a minimum proton extraction energy of 13.7 MeV. As good agreement between the nominal cyclotron energy and the
measured energy (determined via HPGe spectroscopy methods) had been noted previously for a thorough study of the extractor foil in question (Avila-Rodriguez et al., 2009), the proton energies evaluated in this experiment were compared directly with the nominal cyclotron energy.
A total of six proton irradiations were performed using the tandem at BNL. Of these, two of the irradiations energies were energy-blinded. Since the choice of the aluminum energy degrader thickness requires some idea as to the irradiation energy, it was decided prior to irradiation that one of the blind studies would be performed in the 12.0–12.8 MeV energy range while the other would be performed in the 14.0–14.8 MeV energy range. For all BNL irradiations (300 s), the foils were mounted normal to the incident beam with the current (400 nA) measured just prior to irradiation using a Faraday cup. In contrast to the cyclotron configuration at the EPC, the BNL target station did not require the use of an aluminum vacuum window. Nevertheless, to eliminate the need for applying corrections to
the data in Table 1, an additional 25
m
m aluminum foil wasinstalled prior to the Cu/Al/Cu sandwich so as to mimic the presence of a vacuum window for the BNL irradiations. The nominal proton energies along with the nominal and measured aluminum and copper thicknesses employed for both the EPC and BNL irradiations are reported inTable 2.
3.5. Foil measurements
When irradiating natural copper foils up to 19 MeV, three radionuclide products require examination:62Zn (t
1/2¼9.186 h), 63Zn (
t1/2¼38.47 min), and63Cu (t1/2¼9.67 min). Although 65Zn
(t1/2¼243.66 days) is also produced during the irradiation of
copper foil, given the irradiation conditions and assuming activity
assays are performed within3 h post-EOB, the activity of65Zn
will be negligible (o1%) with respect to the large63Zn activity
produced. Discrimination of the three isotopes only by their half-lives is possible, but somewhat time consuming. An examination of the published cross-sections for these reactions (Ghoshal, 1950; IAEA, 2009) suggests that if we allow the 9.7 min half life62Cu Table 2
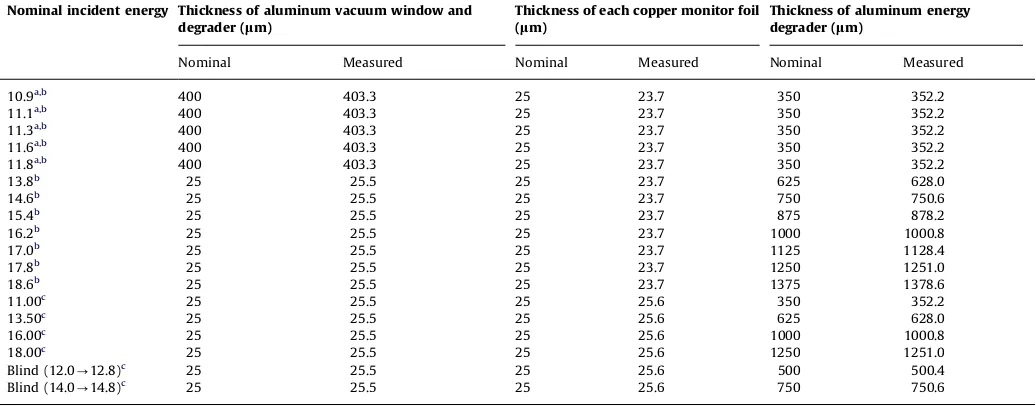
The nominal proton irradiation energies and nominal/measured foil thicknesses.
Nominal incident energy Thickness of aluminum vacuum window and degrader (lm)
Thickness of each copper monitor foil (lm)
Thickness of aluminum energy degrader (lm)
Nominal Measured Nominal Measured Nominal Measured
10.9a,b 400 403.3 25 23.7 350 352.2
11.1a,b
400 403.3 25 23.7 350 352.2
11.3a,b
400 403.3 25 23.7 350 352.2
11.6a,b
400 403.3 25 23.7 350 352.2
11.8a,b
400 403.3 25 23.7 350 352.2
13.8b
25 25.5 25 23.7 625 628.0
14.6b 25 25.5 25 23.7 750 750.6
15.4b 25 25.5 25 23.7 875 878.2
16.2b
25 25.5 25 23.7 1000 1000.8
17.0b
25 25.5 25 23.7 1125 1128.4
17.8b
25 25.5 25 23.7 1250 1251.0
18.6b
25 25.5 25 23.7 1375 1378.6
11.00c
25 25.5 25 25.6 350 352.2
13.50c 25 25.5 25 25.6 625 628.0
16.00c 25 25.5 25 25.6 1000 1000.8
18.00c
25 25.5 25 25.6 1250 1251.0
Blind (12.0-12.8)c 25 25.5 25 25.6 500 500.4
Blind (14.0-14.8)c 25 25.5 25 25.6 750 750.6
a
Energy achieved using additional aluminum degrader as minimum extractable energy in TR-19/9 is approximately 13.7 MeV.
contribution to decay, the63Zn will dominate the dose calibrator
readings for proton energies up to approximately 16 MeV. For this reason, we investigated the possibility of using a combination method whereby for lower proton energies the ratio of the dose calibrator readings at a single time point could be used, while for higher proton energies, half-life discrimination of the measured readings would be necessary.
All foil radioactivities were read out using CapintecTM
CRC-15PET and CRC-15W dose calibrators at the EPC and BNL, respectively. As the proposed method is independent of the calibration setting, an arbitrary setting of 100 was employed. All irradiated foils in this study were individually measured in the dose calibrator at approximately 20, 30, 40, 50, 60, 80, 100, 120, 150 and 180 min post-EOB, with the measurement times recorded to the nearest second.
3.6. Calculating the measured activity ratio
Although the single time point evaluation of the63Zn activity
ratio was expected to be applicable only for the lower energy
irradiations, the 63Zn activity ratio was calculated for all
irradiations by directly using the dose calibrator readings obtained at the 1 and 2 h time points. These time points were investigated, as opposed to the initial 20 min measurements, in
order to allow for 62Cu decay. As the foil readings for a given
irradiation were typically measured 1–2 min apart, a
correspond-ing 1–2 min 63Zn decay correction was applied, so that the
readings coincided with a single time point. It is not necessary to decay correct the readings back to EOB as this factor will be the same for both foils, and therefore will cancel when examining the activity ratio.
To discriminate the three isotopes by their half-lives and acquire the isotope-corrected 63Zn activity ratio, the ten serial
time point readings underwent the following described fitting procedure.
Since the proton energy within the second foil was always
expected to be below the threshold for production of 62Cu
(11.0 MeV) and 62Zn (13.5 MeV) (NNDC, 2009), the ten dose
calibrator readingsRfor this foil were fit using the Curve Fitting Toolbox in MATLAB&
and the following fitting function:
RðtÞ ¼C1e l63
Z ntþB ð4Þ
where t represents the time elapsed since EOB and
l
63Znrepresents the decay constant for 63Zn. TheC
1 coefficient was
taken to represent the 63Zn contribution at EOB, while B was
taken to represent any background activity. An original attempt at fitting the dose calibrator readings for the first foil was performed using the following double exponential:
RðtÞ ¼C1e l63Z ntþC
2e
l62C utþB ð5Þ
where C1 and C2 were fit parameters. These coefficients were
taken to represent the EOB 63Zn and 62Cu contributions,
respectively. Since the background term was not expected to
vary greatly between the two foils, theBterm in (5) was not a
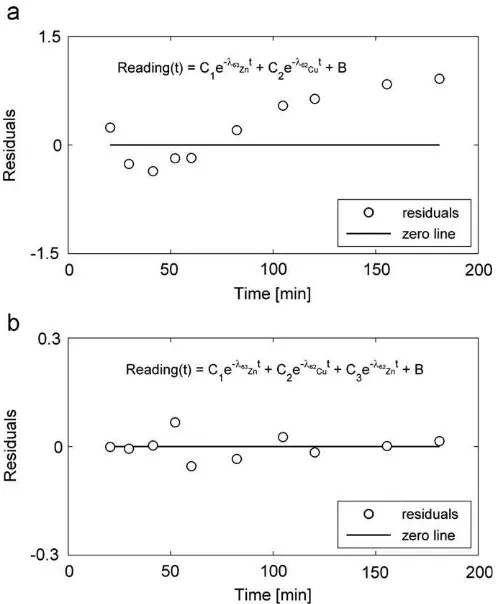
fitting parameter, but instead set to the value obtained for the second foil described by (4). As this fitting procedure led to undesired systematic trends in the residuals, the data for the first foil were instead described by
RðtÞ ¼C1e l63Z ntþC
2e l62C utþC
3e
l62Z ntþB ð6Þ
whereC1,C2andC3were fit parameters used to describe the63Zn,
62Cu and 62Zn contribution at EOB, respectively. As before,
the background B term was taken as the value obtained by
fitting the activity readings of the second foil. By adopting this latter fitting procedure, the systematic trends observed in the
residuals were eliminated (Fig. 4). Using this fitting method,
the ratio of the C1 coefficients obtained using (6) and (4)
was taken as the ratio of63Zn activity between first and second
copper foils.
Fig. 4.A plot of the residuals for the decay curve fitting of the ten dose-calibrator readings for the first copper foil for the 18.6 MeV cyclotron irradiation. Plot A was obtained using the fitting function described in (5), while B was obtained from the fitting function of (6).
Fig. 5.A sample plot of the proton energy,E, as a function of the expected63
4. Results and discussion
A sample plot of the proton energy as a function of the expected63Zn ratio (calculated from (3)) is given inFig. 5for a
nominal 25
m
m aluminum vacuum window, a nominal 350m
maluminum energy degrader and two nominal 25
m
m coppermonitor foils. This data was fit using a second order polynomial.
The 350
m
m aluminum degrader is the thickness recommended inthis study for evaluation of proton energies in the 10.8–11.8 MeV
range. Assuming 25
m
m copper monitor foils, and the presence ofa 25
m
m aluminum vacuum foil, a list of suggested aluminumproton degrader thicknesses for a wide range of energies is presented inTable 1. Since the plots of the expected63Zn ratios for
the other recommended aluminum foil thicknesses are similar in
appearance to Fig. 5, we have omitted the respective figures in
this publication. The coefficients to the second order polynomial fits for each of these have however been included inTable 1. Since a second order polynomial will always have two activity ratios which give rise to a given energy—only one of which is physically
meaningful, it should be noted that Table 1 also includes the
corresponding range of activity ratios which are expected for the energy range of interest.
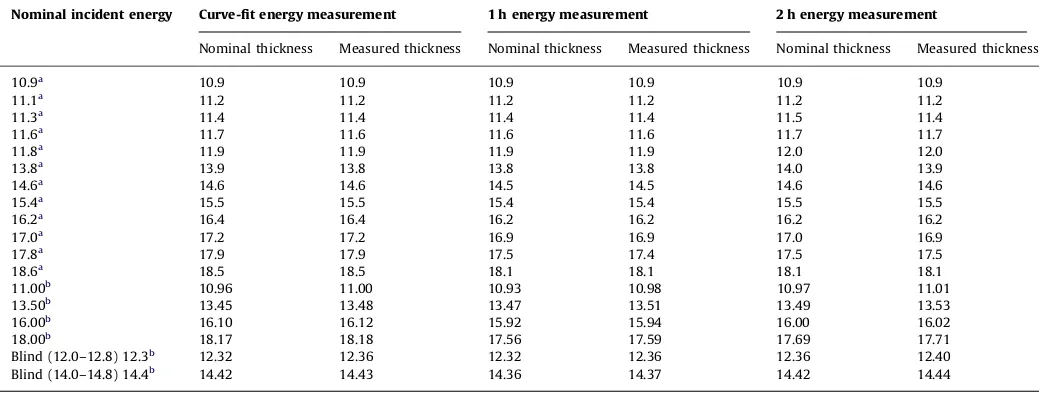
Table 3summarizes the energies evaluated using (i) the half-life discriminated curve-fit based63Zn ratio, (ii) the single 1 h time point 63Zn ratio and (iii) the single 2 h time point63Zn ratio.Table 3also
includes both the energies evaluated assuming the nominal foil thicknesses (i.e. the second order polynomial data fromTable 1), as well as the energies evaluated using the measured foil thicknesses. When examining the blinded experiments (12.3 and 14.4 MeV) all measurements agreed within 0.1 MeV of the nominal values. Excellent agreement between the measured and nominal energies was also noted regardless of the strategy employed for determining the63Zn ratio for proton energies up to 17.0 MeV. For this reason, we
conclude that the half-life discrimination using the 63Zn
curve-fitting method is only essential when the proton energy is greater than 17.0 MeV. We also note that the minor variations from the nominal foil thicknesses used in this study resulted in only minor variations (r0.1 MeV) in the evaluated energy. This suggests that
small thickness variations across a foil should similarly have a minor impact on the evaluated energy. It should be noted that caution
must be exercised when using the values from Table 1 if the
measured foil thicknesses vary by an amount greater than those employed for this work.
5. Conclusions
In this work, we have recommended and evaluated a new and simple-to-perform method for measuring the beam energy of a cyclotron. This method was developed with the cyclotron production of medical isotopes in mind, where the ability to easily verify the beam energy to an accuracy of a few tenths of a MeV is of great importance. The proposed method has been found to provide an accurate determination of proton energies in the 11–19 MeV range without the use of complex analysis methods or sophisticated equipment. To facilitate the adoption of this technique into routine evaluation of the cyclotron beam energy, we have included a list of recommended nominal aluminum degrader thicknesses as well as a list of the corresponding curve fit data for evaluation of the proton energy using the measured
63Zn activity ratio. Application of the proposed method to the
monitoring of deuteron energies is a topic we plan to explore further in the near future.
Acknowledgements
The authors wish to thank the following individuals for their assistance in the irradiations: Drs. Chuck Carlson, Michael Schueller and David Schlyer for helpful discussions and organizing the experiments at BNL. This work was supported through Grants from The Canadian Natural Sciences and Engineering Research Council (TJR, KG, JP, SL).
References
Avila-Rodriguez, M.A., Rajander, J., Lill, J.-O., Gagnon, K., Schlesinger, J., Wilson, J.S., McQuarrie, S.A., Solin, O., 2009. Proton energy determination using activated yttrium foils and ionization chambers for activity assay. Nucl. Instrum. Methods B 267, 1867–1872.
Blessing, G., Brautigam, W., Boge, H.G., Gad, N., Scholten, B., Qaim, S.M., 1995. Internal irradiation system for excitation function measurement via the stacked-foil technique. Appl. Radiat. Isot. 46, 955–960.
Table 3
The proton energies evaluated in this experiment using the63
Zn activity ratio.
Nominal incident energy Curve-fit energy measurement 1 h energy measurement 2 h energy measurement
Nominal thickness Measured thickness Nominal thickness Measured thickness Nominal thickness Measured thickness
10.9a 10.9 10.9 10.9 10.9 10.9 10.9
11.1a 11.2 11.2 11.2 11.2 11.2 11.2
11.3a
11.4 11.4 11.4 11.4 11.5 11.4
11.6a
11.7 11.6 11.6 11.6 11.7 11.7
11.8a
11.9 11.9 11.9 11.9 12.0 12.0
13.8a
13.9 13.8 13.8 13.8 14.0 13.9
14.6a
14.6 14.6 14.5 14.5 14.6 14.6
15.4a 15.5 15.5 15.4 15.4 15.5 15.5
16.2a 16.4 16.4 16.2 16.2 16.2 16.2
17.0a
17.2 17.2 16.9 16.9 17.0 16.9
17.8a
17.9 17.9 17.5 17.4 17.5 17.5
18.6a
18.5 18.5 18.1 18.1 18.1 18.1
11.00b
10.96 11.00 10.93 10.98 10.97 11.01 13.50b
13.45 13.48 13.47 13.51 13.49 13.53
16.00b 16.10 16.12 15.92 15.94 16.00 16.02
18.00b 18.17 18.18 17.56 17.59 17.69 17.71
Blind (12.0–12.8) 12.3b
12.32 12.36 12.32 12.36 12.36 12.40 Blind (14.0–14.8) 14.4b
14.42 14.43 14.36 14.37 14.42 14.44
a
Cyclotron.
b
Ghoshal, S.N., 1950. An experimental verification of the theory of compound nucleus. Phys. Rev. 80, 939–942.
IAEA, 2009. Charged-particle cross section database for medical radioisotope production, Monitor reactions./http://www-nds.iaea.org/medical/monitor_ reactions.htmlS.
Kim, J.H., Park, H., Kim, S., Lee, J.S., Chun, K.S., 2006. Proton beam energy measurement with the stacked Cu foil technique for medical radioisotope production. J. Korean Phys. Soc. 48, 755–758.
National Nuclear Decay Center, 2009. Nuclear reaction and decay Q-values (QCalc).
/http://www.nndc.bnl.gov/qcalc/S.
Scholten, B., Qaim, S.M., St ¨ocklin, G., 1994. Radiochemical studies of proton induced7
Be-emission reactions in the energy range of 40–100 MeV. Radio-chim. Acta 65, 81–86.