On: 03 Sept em ber 2013, At : 19: 23 Publisher : Rout ledge
I nfor m a Lt d Regist er ed in England and Wales Regist er ed Num ber : 1072954 Regist er ed office: Mor t im er House, 37- 41 Mor t im er St r eet , London W1T 3JH, UK
Accounting and Business Research
Publ icat ion det ail s, incl uding inst ruct ions f or aut hors and subscript ion inf ormat ion:
ht t p: / / www. t andf onl ine. com/ l oi/ rabr20
Bias in the tone of forward
‐
looking narratives
Thomas Schl eicher a & Mart in Wal ker b a
Lect urer in Account ing and Finance at t he Manchest er Account ing & Finance Group, Manchest er Business School , The Universit y of Manchest er, Boot h St reet West , Manchest er, M15 6PB, UK E-mail :
b
Prof essor of Finance and Account ing at t he Manchest er Account ing & Finance Group, Manchest er Business School , The Universit y of Manchest er, UK
Publ ished onl ine: 04 Jan 2011.
To cite this article: Thomas Schl eicher & Mart in Wal ker (2010) Bias in t he t one of f orward‐l ooking narrat ives, Account ing and Business Research, 40: 4, 371-390, DOI: 10. 1080/ 00014788. 2010. 9995318
To link to this article: ht t p: / / dx. doi. org/ 10. 1080/ 00014788. 2010. 9995318
PLEASE SCROLL DOWN FOR ARTI CLE
Taylor & Francis m akes ever y effor t t o ensur e t he accuracy of all t he infor m at ion ( t he “ Cont ent ” ) cont ained in t he publicat ions on our plat for m . How ever, Taylor & Francis, our agent s, and our licensor s m ake no r epr esent at ions or war rant ies w hat soever as t o t he accuracy, com plet eness, or suit abilit y for any pur pose of t he Cont ent . Any opinions and view s expr essed in t his publicat ion ar e t he opinions and view s of t he aut hor s, and ar e not t he view s of or endor sed by Taylor & Francis. The accuracy of t he Cont ent should not be r elied upon and should be independent ly ver ified w it h pr im ar y sour ces of infor m at ion. Taylor and Francis shall not be liable for any losses, act ions, claim s, pr oceedings, dem ands, cost s, expenses, dam ages, and ot her liabilit ies w hat soever or how soever caused ar ising dir ect ly or indir ect ly in connect ion w it h, in r elat ion t o or ar ising out of t he use of t he Cont ent .
Bias in the tone of forward-looking narratives
Thomas Schleicher and Martin Walker
*Abstract–We extend the prior literature on biased disclosure decisions by examining whether, when and how managers bias the tone of forward-looking narratives. In order to measure tone we employ techniques of manual content analysis and we aggregate positive, neutral and negative statements into an overall measure of tone. We then analyse the frequency of positive and negative statements forfirms with large impending year-on-year changes in sales and operating profit margin, and we regress tone cross-sectionally on four managerial incentive variables that are unrelated to the private signal about future trading, namely loss status, sign of earnings change, business risk, and the existence of an analyst earnings forecast.
Wefind thatfirms with large impending performance declines bias the tone in the outlook section upwards. Also, wefind that lossfirms, riskyfirms andfirms with an analyst earnings forecast provide a more positive tone, whilefirms with an earnings decline provide a more negative tone. Finally, we observe that for a majority of our managerial incentive variables the main vehicle of biasing the tone is to change the number of negative statements, not the number of positive statements. Overall, ourfindings are difficult to reconcile with predictions from signalling models, but they are consistent with the alternative view of impression management. Our results have policy implications. In particular, they suggest that there is a need to reconsider the current largely unregulated nature of forward-looking narratives.
Keywords:forward-looking; narratives; tone; bias; impression management; content analysis
1. Introduction
We extend the prior literature on biased disclosure decisions by focusing on the tone of forward-looking narratives. We focus on forward-forward-looking narratives because the existing evidence on the usefulness, predictive value, and value-relevance is stronger for forward-looking narratives than for backward-looking narratives (e.g. Bryan, 1997; Schleicher and Walker, 1999; Clarkson et al., 1999). This suggests that managers with a willing-ness to engage in impression management are likely to target forward-looking statements. Thus, our study differs from prior research on impression management in narratives in that we focus exclu-sively on forward-looking disclosures.
At the same time we define forward-looking
disclosures more widely than management earnings forecast studies (e.g. McNichols, 1989; Jelic et al., 1998; McConomy, 1998; Rogers and Stocken, 2005). In particular, we include all types of forward-looking statements, including qualitative and non-earnings-related statements. We believe
such a focus is justified for two reasons. First, in the UK information on current and future trading is typically made through qualitative narratives, not through quantitative management earnings fore-casts. For example, Brennan (1999: 884) observes
that‘forecasts are rarely disclosed by UK
manage-ment except in new share issue prospectuses and
during takeover bids’. Given the dominance of
qualitative trading statements over hard earnings forecasts it is surprising how little research has been done on these statements. Second, the qualitative nature of forward-looking narratives and their frequent focus on soft and non-earnings-related topics makes it much harder for outsiders to effectively monitor the accuracy of these state-ments. Evidence in Rogers and Stocken (2005) suggests that an inability to monitor ex post increases the likelihood of ex ante manipulation.
We investigate whether, when and how managers bias the tone of forward-looking narratives. For that we use techniques of manual content analysis and we focus on the annual report outlook section, a paragraph of forward-looking statements that is
typically located at the end of the Chairman’s
Statement. For each forward-looking statement we determine the tone of the underlying message and we aggregate positive, neutral and negative state-ments into an overall measure of tone. The tone of forward-looking narratives is our proxy for forecast news.
We make the following observations when analysing a sample of annual reports with large impending year-on-year changes in sales growth rate and operating profit margin. First, firms with *Thomas Schleicher and Martin Walker are, respectively,
Lecturer in Accounting and Finance and Professor of Finance and Accounting at the Manchester Accounting & Finance Group, Manchester Business School, The University of Manchester, UK. They are grateful to Pauline Weetman, the editor, and two anonymous referees for helpful comments on earlier versions. They gratefully acknowledge the financial support from the ESRC (Grant Number RES–000–22–1089). Correspondence should be addressed to Dr Thomas Schleicher, Manchester Accounting & Finance Group, Manchester Business School, The University of Manchester, Booth Street West, Manchester, M15 6PB, UK.
E-mail: [email protected].
This paper was accepted for publication in October 2009.
large impending decreases use positive statements significantly more than negative statements. This is
consistent with firms biasing the tone of outlook
statements upwards. Second, when we estimate the
determinants of tone we find that managerial
incentives unrelated to future trading dominate our findings. In particular, wefind that managers lower the tone if previous year’s earnings decline and they
increase the tone if previous year’s earnings are
negative. Also, we find that risky firms and firms
with an analyst earnings forecast significantly
increase the tone in the outlook section. These
four observations are difficult to reconcile with
predictions from signalling models, but they are consistent with the alternative view of impression management.
Investigating whether, when and how managers bias the tone of forward-looking annual report narratives is an important research issue as prior studies demonstrate that such narratives are
con-sidered useful by professional analysts
(e.g. Clarkson et al., 1999) and that they are used by investors in setting market prices (e.g. Bryan, 1997; Hussainey et al., 2003). Thus, manipulating the news content of forward-looking annual report narratives has the potential to affect analyst views and market values.
Our findings have implications for accounting
policy-makers. In particular, our results question the rationale of leaving forward-looking annual report narratives largely unregulated and unaudited. For example, while the Accounting Standards Board
(ASB) (1993, 2006) is encouragingfirms to include
forward-looking narrative information in the
Operating and Financial Review, the Reporting Statement is a formulation of best practice and not an enforceable accounting standard. Also, the UK
Auditing Practices Board (APB) applies
International Standards on Auditing in requiring the auditor to read other information to identify
material inconsistencies with the audited financial
statements. If the auditor becomes aware of any
apparent misstatements or identifies any material
inconsistencies, the auditor should seek to resolve them (APB, 2004, para. 2 and 2-1). This require-ment is vague and difficult to act upon asfinancial statements and forward-looking narratives relate to
different time periods. Our findings of biased
disclosure decisions suggest that there is a need to reconsider the current regulatory regime for forward-looking narratives.
The remainder of the paper is organised as follows. The next section reviews the literature and derives hypotheses. Section 3 describes our research design, including sample selection, content
analysis, and hypotheses testing. Our results are reported in Section 4. Section 5 concludes.
2. Literature review and hypothesis
development
A large number of theoretical papers examine incentives for managers to disclose private infor-mation to outside parties. Early studies like
Grossman (1981) and Milgrom (1981), for
example, assume that managers face incentives that induce them to act in the best interest of the
firm’s current owners and that such managers
cannot pre-commit to disclose all value-relevant information, regardless of whether this information is good or bad. In other words, managers decide whether or not to disclose the value-relevant information only after they have learned the value of the signal and in making their disclosure decision they bear in mind the effect of the disclosure on the wealth of current shareholders (Walker, 1997). Grossman (1981) and Milgrom (1981) then predict that managers truthfully disclose all value-relevant information except in a situation where the manager receives the worst possible signal.
Since the above‘full disclosure’principle is often
viewed as not being empirically descriptive subse-quent analytical papers have added to the model a cost of disclosure (where this cost of disclosure is generally viewed as a proprietary cost of providing sensitive information to competitors) (Verrecchia, 1983). Other models have added uncertainty regarding whether or not managers have private information to disclose (Dye, 1985; Jung and Kwon, 1988). Both‘costly disclosure’and‘lack of
information’ models predict a separating
equilib-rium: firms with relatively good news disclose
while all otherfirms remain silent (Miller, 2002). Another stream of the analytical literature studies the effect of litigation liability by imposing a cost for non-disclosure of bad news as well as for good news disclosures that turn out ex post to be overly optimistic (Trueman, 1997; Hughes and Sankar, 1997). The resulting models predict that the value of the disclosed signal varies with the magnitude of the expected cost of litigation. When expected litigation costs are large managers have an incentive to err on the side of caution and hence they will tend to withhold good news while also disclosing bad news.
While US-style disclosure-related litigation is virtually non-existent in a UK context, the model predictions might still apply to a UK study if one interprets the cost of surprising the stock market more widely. For example, arguments and evidence in Skinner (1994) and Graham et al. (2005) suggest
that the reputational damage to the firm is by far greater for negative earnings surprises than for positive earnings surprises. This asymmetric loss in reputation can translate into a reduction in liquidity and share price and–following on from this–into a reduction in executive remuneration and managerial job security.
While the insights provided by the analytical literature are helpful, the models are generally silent on the nature of the value-relevant signal. However, a large impending year-on-year increase in sales and operating profit margin can be viewed as a‘good’
news signal while a large impending decrease can be viewed as a‘bad’news signal. Furthermore, the
fact that stock market participants express share prices in multiples of one-year-ahead sales and profit (e.g. Palepu et al., 2003) suggests that this signal is value-relevant. In the remainder of the
paper we refer to firms with large impending
increases (decreases) in sales and operating profit
margins as UP (DOWN)firms. Our UP (DOWN)
firms report, in the upcoming financial year, a
median sales growth rate of 30.8 (–12.5)% and a
median change in operating profit margin of 4.0
(–5.9) percentage points.
Below we begin our empirical investigation by analysing the number of positive and negative statements per annual report outlook section. The
above theoretical models suggest that UP firm
managers will want to disclose their positive expectations so as to maximise current market value. In particular, a large impending performance increase means that managers have little incentive to claim lack of information. Also, the sheer size of the impending performance change means that outlook statements are unlikely to turn out inaccur-ate ex post, even in cases where unforeseen events
create a negative ‘wedge’ between expected and
actual outcome. Thus, for UP firms there is little
need to err on the side of caution by withholding positive statements and disclosing negative
state-ments. These arguments yield ourfirst hypothesis:
H1: For UP firms the number of positive
ments exceeds the number of negative state-ments and the overall tone is positive.
The predictions for DOWN firms are – to some
extent–dependent on the precise theoretical model.
If we interpret our DOWNfirms as having the worst
possible news, then Grossman (1981) and Milgrom (1981) predict silence. Otherwise these models
predict that DOWN firms truthfully announce the
decline in sales and operating profit margin so as to
screen themselves out from firms that have even
worse news to report (like bankruptcy, for
example). The ‘costly disclosure’ models and the
‘lack of information’ models unambiguously
pre-dict silence, while the ‘asymmetric loss function’
argument predicts a tendency to disclose bad news. Overall, therefore, it is not clear from the signalling
literature whether DOWNfirms disclose. However,
if they do disclose, then the negative statements should clearly outnumber positive statements, especially because the sheer size of the impending decline makes it very unlikely that many DOWN
firms had indeed expected good news at the start of
the year. Taking into account that the precise prediction depends to some extent on the under-lying model we only predict that:
H2: For DOWN firms the number of positive
statements does not exceed the number of negative statements and the overall tone is not positive.
The predictions in H1 and H2 are based on signalling models. These models assume that managerial interests are perfectly aligned with the interests of current owners and that managerial disclosures are always truthful. An alternative point of view is based on agency theory which stresses the
possibility of conflicts between managers and
owners and where managers are assumed to act in their own best interest, not necessarily in the owners’best interest.
A seminal paper in the agency cost literature is that by Jensen and Meckling (1976). They model investment decisions, not disclosure decisions, but the principal idea behind their model is still relevant to our paper. In particular, Jensen and Meckling (1976) specify managers’personal utility as
increas-ing in private consumption of corporate resources and as decreasing in the level of effort that they put
into managing thefirm. Their model then predicts
that, whenever afirm’s outside ownership stake is
non-zero, managers choose an effort level that is too low and they spend too many corporate resources on activities that generate only personal utility.
While the agency model in Jensen and Meckling (1976) deals with investment, not disclosure, it is not difficult to‘translate’the model predictions into
a disclosure setting: If managers are prepared to exploit the unobservability of the managerial effort in order to ‘shirk’, then, clearly, they can also be
expected to exploit the unobservability of the private signal about future trading in order to
misrepresent a firm’s trading prospect. The
argu-ments in Jensen and Meckling (1976) suggest that they will do so whenever they personally gain from such a misrepresentation.
The idea that managers use their discretion over
corporate disclosures opportunistically to their own
personal benefit is central to the impression
man-agement literature. For example, Clatworthy and
Jones (2001: 311) define impression management
as an attempt ‘to control and manipulate the
impression conveyed to users of accounting
infor-mation’ while Yuthas et al. (2002: 142) regard
impression management as a vehicle to ‘
strategic-ally . . . manipulate the perceptions and decisions of stakeholders’. In most empirical settings impression
management would be expected to manifest itself through a positive disclosure bias as managers hope that the presentation of thefirm in the best possible light leads to increased remuneration and job security (Clatworthy and Jones, 2003).
Empirically, impression management has been documented across a wide spectrum of accounting research issues, including the management of bottom-line earnings (e.g. Roychowdhury, 2006), the selective disclosure and calculation of pro-forma earnings (e.g. Walker and Louvari, 2003; Johnson and Schwartz, 2005), the use of prior-period benchmarks (e.g. Schrand and Walther, 2000), and the presentation of graphs and pictures in the annual report (e.g. Beattie and Jones, 1992). In terms of narratives, impression management studies have focused on reading ease manipulations
(e.g. Courtis, 2004), thematic manipulations
(e.g. Clatworthy and Jones, 2003) and one-sided performance attributions (e.g. Bettman and Weitz, 1983). For example, Clatworthy and Jones (2003)
focus on the Chairman’s Statement of 100 UKfirms
with extreme changes in pre-tax profits and examine
whether firms with improving and declining
per-formance in the year under review report good and
bad news in a different way. Theirfindings suggest
that both groups tend to dwell on the positive aspects of their performance and that both groups take credit for the good news themselves while blaming external factors for the bad news. This leads to the conclusion that managers use (pre-dominately) backward-looking narratives in a biased and self-serving way. Evidence of a positive reporting bias is also documented in Rutherford (2005) for the Operating and Financial Review, in Guillamon-Saorin (2006) for press releases, and in
Lang and Lundholm (2000) for firms with an
imminent public offering of new equity. Finally, the evidence of a bias in management earnings fore-casts is mixed. For example, Rogers and Stocken
(2005) find that managers not only bias earnings
forecasts in a self-serving way, but also that they are more likely to bias their forecasts when it is more
difficult for investors to detect that they have
misrepresented their information. This contrasts
with the earlierfindings in McNichols (1989) who
obtains only weak evidence of bias in management earnings forecasts.1
It is instructive to reconsider the signalling-based predictions in H1 and H2 in the light of self-serving
behaviour. For example, as far as UP firms are
concerned, agency theory and impression manage-ment make the same prediction as signalling
models. In particular, managers personally benefit
from truthfully revealing their positive expectations about the future. This is true because the anticipated rise in market value leads to a higher stock-based compensation and a lower risk of takeover-related
dismissal. In contrast, for DOWNfirms the
predic-tions based on signalling models and self-serving behaviour differ. In particular, agency theory and impression management predict a tendency to bias the tone of forward-looking statements upwards. Not only can a positive tone delay the risk of dismissal, but there is even a small chance that managers might be able to turn things around before the end of thefinancial year.
We test H1 and H2 by calculating the difference between positive and negative statements per annual report outlook section and by testing
whether the mean and median difference is signifi
-cant. However, while such a test is a useful starting point, we also recognise that these tests might well lack the necessary power to detect biased disclo-sures decisions. In particular, comparing the pre-dictions from signalling models with those based on self-serving behaviour suggests that the scenario underlying H1 is too weak to provide a strong test of opportunistic behaviour. This is true because there
is no conflict between the managerial incentive to
disclose good news and the real underlying outlook. Thus, one could argue that there is little reason for
UPfirm managers not to report a positive tone.
In order to provide a different angle to our
analysis – especially as far as UP firms are
concerned – we subsequently make two changes
to the research design. First, we consider a number of additional disclosure incentives which are unre-lated to the value of the privately observed signal about future trading. Second, we exploit cross-sectional variations in tone within our two sub-samples so as to capture more subtle changes in the number of positive and negative statements. Such subtle changes might well go unnoticed in simple tests of means and medians.
Thus, in the second part of our paper we regress thefirm’s tone on a number of additional managerial
1See Merkl-Davies and Brennan (2007) for a comprehensive, up-to-date review of the impression management literature.
incentive variables. These are (a) loss status, (b) reduction in earnings, (c) business risk, and (d) the existence of an analyst earnings forecast. Note that none of these variables is related to the value of the private signal about future trading. Thus, in a
signalling context these four variables are not
expected to affect the tone of forward-looking narratives. However, if managers act in their own personal interest, then the correlations between tone and these four variables might well be non-zero. The following paragraphs discuss this possibility in more detail.
A characteristic feature of trading statements in the annual report outlook section is that they are released together with the result for the previous financial year. This increases the likelihood that the previous year’s trading
– in addition to future
trading – influences a manager’s disclosure
deci-sion. This is true because a disappointing trading result for the year under review is likely to impose costs on the manager that are quite similar to those associated with a negative trading outlook.
In order to mitigate these costs, managers might be tempted to bias the tone in forward-looking statements. In particular, they could issue optimistic disclosures in an attempt to offset the negative job market repercussions associated with a disappoint-ing result. In order to examine whether last year’s
financial result affects a manager’s choice of tone,
we consider two types of disappointments: the incidence of (a) a loss and (b) a decline in earnings. A large body of empirical research examines the tactics that are employed by managers to avoid the reporting of a loss (e.g. Walker and Louvari, 2003). The overall picture that emerges from these studies suggests that managers regard the reporting of a negative earnings number as a major disappoint-ment that should be avoided if at all possible. This is understandable given that a loss that is perceived by outsiders to be permanent calls into question the competence of the management team and the general viability of thefirm as a going concern.
Our third hypothesis deals with a scenario where a loss has not been avoided. We argue that in such a
situation the management team’s main concern
must be to convince investors that its strategy is still working and that investors should continue to employ managers whose strategy will yield some positive rewards in the future. Thus, we predict that
a loss firm’s emphasis is on communicating the
firm’s positive prospects so as to prevent investors
from extrapolating the current loss into the future. Note that this situation is very different from that of profit firms. For a profit firm the financial result
already shows that the firm is managed
compe-tently. Thus, a manager of a profitfirm has less need to communicate afirm’s positive prospects through
forward-looking statements. This yields our third hypothesis:
H3: Loss firms report a more positive tone than
profitfirms.
The second disappointment we consider relates to a reduction in earnings. A lower profit can lead to a decline in managerial remuneration (Matsunaga and Park, 2001), reduced job security (Puffer and Weintrop, 1991) and a loss in managerial disclosure reputation (Matsumoto, 2002). If a concern about short-term job market repercussions dominates, then one might expect disclosures to be more positive. Otherwise, if managers are more con-cerned about not negatively surprising outsiders in future years, then disclosures should be less posi-tive. We would expect the latter concern to be particularly pronounced if the tone in last year’s
outlook section was typically positive and if the costs associated with a second straight disappoint-ment are larger than usual. In particular, one might
expect the damage to a manager’s reputation to be
large if investors interpret a second straight disap-pointment as evidence that the management team is either dishonest or incompetent. Given that ex ante it is not entirely clear which concern dominates, we formulate the fourth hypothesis as a non-directional forecast:
H4: The tone reported by managers is unaffected
by the sign of previous year’s earnings change.
The impression management literature suggests that most managers will try to present thefirm in the best possible light. However, Rogers and Stocken (2005) argue that, as far as forward-looking disclo-sures are concerned, managers are constrained
because outsiders can use the subsequentfinancial
report to evaluate the truthfulness of managers’
earlier statements. In particular, if outsiders later detect the positive disclosure bias, then a manager’s
disclosure reputation might suffer. In this case one would expect a rational manager to trade off the expected benefits from overly optimistic disclosures against any expected cost from reduced reputation. In line with Rogers and Stocken (2005) we
predict that the expected damage to a manager’s
reputation increases with a financial report’s
use-fulness for evaluating the truthuse-fulness of managerial outlook statements. In particular, if thefirm operates in a stable environment with relatively stable financial results, then investors are more likely to ascribe any ex post deviation from earlier forecasts to a biased outlook section. In contrast, if thefirm
operates in a risky, unstable environment with widelyfluctuatingfinancial results, then it is more
difficult to conclude that the tone was a biased
reflection of managers’ expectations. This is true
because a large inconsistency between the ex post
financial result and the ex ante outlook statement
might well be due to unpredictable and uncontrol-lable events. We predict that this inability to accurately assess truthfulness reduces a manager’s
expected reputational costs and, as a result, leads to an increased tendency to bias the tone in
forward-looking statements upwards. This leads to ourfifth
hypothesis:
H5: The tone reported by managers is positively
associated with afirm’s business risk.
Our last hypothesis relates to the existence of an analyst earnings forecast. A possible association between disclosure and analyst following has long been acknowledged in the disclosure literature but the emphasis has traditionally been on the quality of the disclosure (e.g. Lang and Lundholm, 1996). This emphasis is consistent with the idea that
analysts are attracted by – or actively demand –
more value-relevant information. An alternative view is that the existence of an analyst earnings forecast affects the value of the disclosed signal and we predict that the relation between tone and analyst earnings forecast is positive. In particular, a predic-tion of a positive bias is consistent with the evidence
of an‘earnings-guidance-game’between managers
and analysts. This evidence suggests that analysts regularly issue optimistically biased earnings fore-casts at the start of a reporting cycle and then‘walk
down’the forecast to beatable levels (Richardson et
al., 2004). This‘walking down’from optimistic to
pessimistic levels is consistent with managers issuing positive guidance early on in a reporting
cycle and then–if necessary–providing downward
guidance as the cycle progresses. Such a ‘dual’
disclosure strategy benefits both analysts and
man-agers. Analysts benefit because it provides the
necessary ‘ammunition’ for a favourable
recom-mendation and this helps to generate transactions from clients. At the same time it also shields analysts from the embarrassment of a negative surprise on earnings announcement day. Managers,
in turn, benefit from a good relationship with
analysts and from higher liquidity and share prices. Given that annual reports are released early on in the annual reporting cycle we predict that:
H6: Firms with an analyst earnings forecast report
a more positive tone than firms without an
analyst earnings forecast.
We now turn to a discussion of our research design, including sample selection, content analysis, and estimation strategy.
3. Research design
3.1. Sample selection
We start our empirical analysis by selecting a
sample of annual reports from theDialogdatabase.
Dialog is a Thomson Financial product and it contains large cross-sections of UK annual reports in electronic format for the years 1996 to 2002.2The
population of UK firms onDialog includes
fully-listed LSEfirms andfirms listed on the AIM but no
unlistedfirms. The total number of annual reports
on Dialog for the seven years is 11,756. After
removing financial companies this reduces to
8,098.3Of those, 7,977firm-years have a matching
record on Datastream which is our source for a
firm’s accounting variables.
Next, we deletefirms with a changing year-end,
and we match each firm-year with the following
year’s change in operating profit margin and sales
growth rate (while deleting observations with missing accounting data where necessary). We use the following year’s actual realisation as a proxy for
management’s expectation at the start of thefi
nan-cial year. Thus, we take the view that any increase
(or decrease) in sales and operating profit margin
can be predicted reasonably well by inside man-agers but less so by outside investors. As a result we
use next year’s actual change in performance as a
proxy for the value of managers’ private
informa-tion.
We believe that the assumption of managers being able to forecast–albeit with some error–next year’s sales and operating profit margin is valid on
two grounds. First, at the time of making
forward-looking statements,first quarter sales and margins
are typically known to management. Second, backlog orders, production plans, and ongoing orders and enquiries for the remainder of the year should give managers a reasonably clear idea of the direction into which sales and margins are heading.
2
Dialogwas discontinued byThomson Financialin mid-2004. The year 2002 is the last year with a comprehensive coverage.
3
Removingfinancial companies is a standard procedure in the empirical literature. For example, Clatworthy and Jones (2003) removefinancial companies before selectingfirms with extreme changes in profit before tax. One argument for removing financial companies is that the formats of their financial statements are quite different from the formats of non-financial companies and that it is not clear whether the additional effort required to reconcile the two formats is justified given that the remaining sample of non-financial companies is still very large and still quite representative of the overall economy.
At the same time this kind of information is typically not available to outside investors. Thus, in the absence of forward-looking disclosures outsiders will typically rely on the previous year’s
result as a benchmark for next year’s forecast. This
is the rationale for using actual change in
perform-ance as a proxy for a firm’s private information
advantageafterthe mandatory release of the income
statement butbeforeany voluntary forward-looking
narratives.4 This approach is very similar to that
taken in Miller (2002).5
Subsequently, we rank all firm-years into
quar-tiles, and we do this once on the basis of next year’s
change in operating profit margin, and once on the
basis of next year’s sales growth rate. We define
firm-years as observations with (an expectation of)
strongly increasing (strongly declining) operating
performance if the firm-year falls into the top
(bottom) quartile of both distributions. We refer to these two groups as UP and DOWN. We use sales (in addition to profit) as a sample selection criterion because sales is often regarded as the other key
measure of afirm’sfinancial performance, and we
wish to rule out the possibility that opposite expectations for sales and profit could be the reason
for a‘mixed’ message in the outlook section. We
select only extreme observations – top versus
bottom quartile – because we wish to maximise
the likelihood that management’s private
informa-tion reflects changing trends that are material
enough to be worth reporting.
The above selection criteria lead to an initial
sample of 357 (484) firm-years with strongly
increasing (strongly declining) sales and operating
profit margins. We further reduce the number of
observations for two reasons. First, we delete a large number of observations where the change in operating performance appears to be driven mainly by acquisitions and disposals of subsidiaries and other related companies. We do this because we know from our preliminary reading of annual reports that forward-looking narratives rarely dis-cuss changes in operating performance that result from changes in the group composition. To account for this apparent‘convention’we delete suchfirms,
and for this we take into account acquisitions and disposals in the year under review and in the next
financial year.6Second, we remove a small number
of firm-years whose (undeflated) operating profit
4
Note that while in practice income statements and outlook sections are typically released together, insiders know the size of the imminent earnings number at the time of making decisions on forward-looking disclosures. Thus, with outsiders forming expectations according to a random walk process, inside managers can accurately predict the private information advan-tage they will have once the mandatory earnings announcement has been made.
5Miller (2002) examines the relation between voluntary disclosure and earnings performance. Miller (2002) selects his sample by choosingfirms with eight consecutive quarters of actual earnings increases. As far as the subindex of forward-looking disclosures is concerned Miller (2002) investigates whether the amount of forward-looking disclosures responds to future changes in actual earnings performance. Such an investigation makes sense only if managers are assumed to have foresight of future earnings realisations. Also, such an investigation is only consistent with the theory in Miller (2002) if at least part of this foresight represents private information. Note that analyst forecasts of earnings and sales – even if available for a large number of observations in a sample–are unlikely to be a valid proxy. In particular, replacing last year’s performance with analyst forecasts would only be valid if such forecasts could be observed after the release of the income statement but before any forward-looking disclosures. In practice, however, such forecasts do not exist because income statements and forward-looking narratives are typically released on the same day. On the other hand, replacing next year’s actual performance with analyst forecasts is inconsistent with the idea of private information as analyst forecasts represent market expectations, not insider expectations. Finally, note that our proxy for private information effectively assumes rational expectations on the part of managers and investors (though with different information sets on which to base expectations). This assumption of rational expectations is perfectly consistent with the signalling models in Section 2 as signalling models are also rational expectations models. In particular, the assumption of rational expectations is not inconsistent with the idea of managers trying to bias the tone of forward-looking narratives so as to maximise current market value for existing sharehold-ers.
6
One can only speculate about whyfirms are reluctant to discuss changes in the trading performance that result from acquisitions and disposals. As far as acquisitions and disposals over the coming year are concerned one could argue that changes in the group composition are often highly uncertain until the very last minute – for example until shareholder approval is granted to both entities– and as a result of this uncertainty management might prefer to stay quiet. However, this argument cannot apply to acquisitions and disposals in the year under review for which the 12-months effect in the coming year is necessarily (much) greater than the contribution in the current year. Perhaps the firms feel that the performance implications of such changes in the group composition can now easily be estimated from thefinancial statements. Whatever the precise reason for staying quiet, we prefer to delete suchfirms. Otherwise the trading outlook for the continuing businesses– which is regularly commented upon in the outlook section– could be dominated in next year’sfinancial statements by the effect of acquisitions and disposals–which are regularly not commented upon. In practical terms we scrutinise thefinancial statements for the effect of acquisitions and disposals on sales and operating profit margin, both in the year under review and in the next financial year, and we make adjustments (based on estimates) where possible. For example, we remove the contribution of next year’s acquisitions and recalculate sales growth and operating profit margin, and only retain the firm-year if the two adjusted values still fall into the range of the (original) top and bottom quartiles. Similarly, for any acquisi-tion in the current year we scale up the contribuacquisi-tion to the current year by estimating the 12-month effect of current year’s acquisitions and replace the actual contribution with an estimated 12-month contribution. For that we assume a lack of seasonality in sales and operating profit. Note that we delete firms for which we have insufficient information to make the necessary adjustments, for example because the date of thefirst consolidation in the current year is not given anywhere in the annual report.
decreases (increases) despite an increase (decrease) in the operating profit margin.7This leaves us with a
final sample of 181firm-years in the UP group and
321firms-years in the DOWN group.8
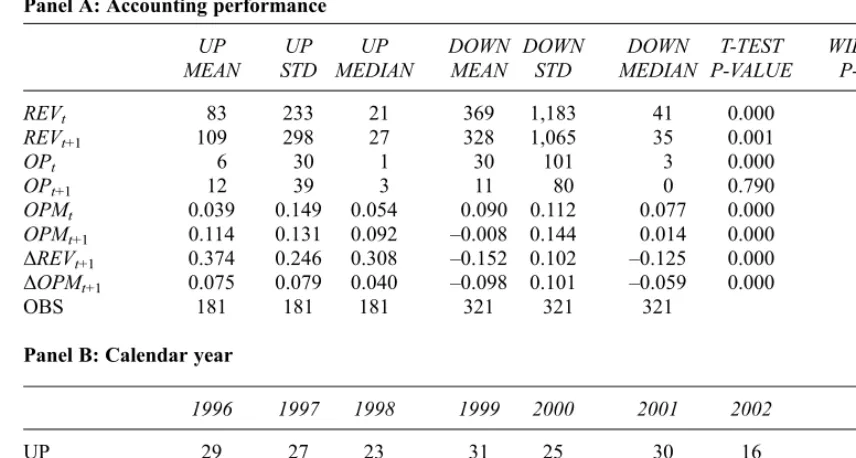
Panel A in Table 1 presents descriptive statistics for these two groups. The mean (median) sales
growth rate,ΔREVt+1, is 37.4 (30.8%) for the UP
group and 15.2 (–12.5)% for the DOWN group,
while the respective changes in the operating profit
margin, ΔOPMt+1, are 7.5 (4.0) and 9.8 (–5.9)
percentage points. The differences between the two
groups are highly significant, using either a
parametric two-sample t-test (means) or a non-parametric Wilcoxon Rank-Sum test (medians). A similar picture also emerges if we look at (absolute) sales,REV, and (absolute) operating profit,OP, int
and t+1, and compare any changes in these two
variables over the 12-month period across the two groups. Thus, it is clear from Panel A that our sample selection procedure was effective in creating two dichotomous samples with very different prospects for the coming year. Panel B shows that
–despite this very different outlook–no particular
calendar year dominates our two subsamples. Next we download the 502 annual reports from
Dialog and identify any ‘outlook sections’ in the
narrative part of the annual report. In a majority of Table 1
Descriptive statistics: sample selection
Panel A: Accounting performance
UP MEAN
UP STD
UP MEDIAN
DOWN MEAN
DOWN STD
DOWN MEDIAN
T-TEST P-VALUE
WILCOXON P-VALUE
REVt 83 233 21 369 1,183 41 0.000 0.000
REVt+1 109 298 27 328 1,065 35 0.001 0.229
OPt 6 30 1 30 101 3 0.000 0.000
OPt+1 12 39 3 11 80 0 0.790 0.000
OPMt 0.039 0.149 0.054 0.090 0.112 0.077 0.000 0.001
OPMt+1 0.114 0.131 0.092 –0.008 0.144 0.014 0.000 0.000 ΔREVt+1 0.374 0.246 0.308 –0.152 0.102 –0.125 0.000 0.000 ΔOPMt+1 0.075 0.079 0.040 –0.098 0.101 –0.059 0.000 0.000
OBS 181 181 181 321 321 321
Panel B: Calendar year
1996 1997 1998 1999 2000 2001 2002 OBS
UP 29 27 23 31 25 30 16 181
DOWN 19 54 62 33 42 78 33 321
ALL 48 81 85 64 67 108 49 502
Panel A presents descriptive statistics on revenue,REV, operating profit,OP, operating profit margin,OPM, sales growth rate,ΔREV, and change in operating profit margin,ΔOPM. Revenue and operating profit are measured byWorldscopeitems WC01001 and WC01250 and are defined as‘gross sales and other operating
revenue less discounts, returns and allowances’and‘difference between sales and total operating expenses’. REVandOPare measured in £000s, whileOPM,ΔREVandΔOPMare expressed in % and percentage points, respectively, and then divided by 100. UP (DOWN) refers to the subsample offirm-years with strongly increasing (decreasing) sales and operating profit margin over the nextfinancial year. A standard two-sample t-test (Wilcoxon Rank-Sum test) is used to test for differences in means (medians) between the two subsamples. Panel B illustrates the distribution offirm-years across calendar years. STD = standard deviation. OBS = observations. ALL = combined sample of UP and DOWN.
7
We use the change in the operating profit margin (rather than the growth rate in operating profit) because it avoids the problems associated with a negative deflator.
8Note that as we move from the initial to thefinal sample we delete a larger proportion offirm-years in UP than in DOWN. This is because in UP the extreme changes in performance are driven more frequently by changes in the group composition. Also note that while the initial subsamples are defined via quartiles, the exact number offirms that fall into the two initial subsamples also depends on the correlation structure between sales growth rate and change in operating profit margin. For example, if the two performance measures are completely uncorrelated, then one would expect the number of observations in each initial subsample to be approximately equal to 7,977 ÷ 16 = 499. However, a negative (positive) correlation will decrease (increase) this number. Thus, our initial sample sizes are consistent with diminishing returns asfirms tend to grow. This is exactly what microeconomic theory predicts.
cases it is straightforward to locate such sections because they are given a special heading. But even if there are no explicit headings it is often easy to
find these sections because they are almost always
located at the end of the Chairman’s Statement or at
the end of the Chief Executive’s Review. However,
where necessary we read the entire narrative section of the annual report.
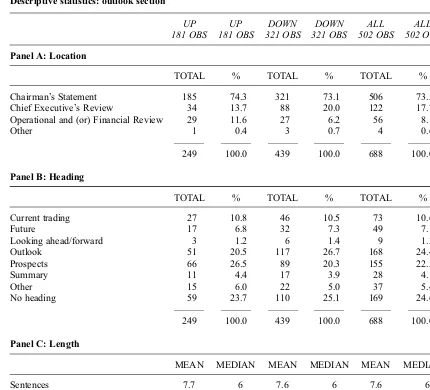
Table 2 gives some background information on the location of the outlook sections in the annual report, their headings, and their length. This back-ground information is given for the combined sample of 502 annual reports, and also separately for UP and DOWN, though we notice that any differences between UP and DOWN are generally quite small. As Table 2 indicates, we identify a total of 688 outlook sections in the combined sample,
giving an average of 1.37 outlook sections per report. Almost three-quarters of these outlook
sections can be found in the Chairman’s
Statement, while other popular choices are the
Chief Executive’s Review, and the Operational and
(or) Financial Review. Only four outlook sections are outside these three parts.9In terms of headings
‘Outlook’and‘Prospects’account for almost half of
all headings, while ‘Current trading’ and ‘Future’
are also frequently chosen. Around a quarter of all outlook sections have no headings at all. Finally, Panel C of Table 2 indicates the mean and median length of an outlook section, measured both in terms Table 2
Descriptive statistics: outlook section
UP 181 OBS
UP 181 OBS
DOWN 321 OBS
DOWN 321 OBS
ALL 502 OBS
ALL 502 OBS
Panel A: Location
TOTAL % TOTAL % TOTAL %
Chairman’s Statement 185 74.3 321 73.1 506 73.5
Chief Executive’s Review 34 13.7 88 20.0 122 17.7
Operational and (or) Financial Review 29 11.6 27 6.2 56 8.1
Other 1 0.4 3 0.7 4 0.6
–––––– –––––– –––––– –––––– –––––– ––––––
249 100.0 439 100.0 688 100.0
Panel B: Heading
TOTAL % TOTAL % TOTAL %
Current trading 27 10.8 46 10.5 73 10.6
Future 17 6.8 32 7.3 49 7.1
Looking ahead/forward 3 1.2 6 1.4 9 1.3
Outlook 51 20.5 117 26.7 168 24.4
Prospects 66 26.5 89 20.3 155 22.5
Summary 11 4.4 17 3.9 28 4.1
Other 15 6.0 22 5.0 37 5.4
No heading 59 23.7 110 25.1 169 24.6
–––––– –––––– –––––– –––––– –––––– ––––––
249 100.0 439 100.0 688 100.0
Panel C: Length
MEAN MEDIAN MEAN MEDIAN MEAN MEDIAN
Sentences 7.7 6 7.6 6 7.6 6
Words 190 151 194 170 192 163
UP and DOWN refer to the two subsamples offirm-years with strongly increasing and strongly decreasing sales and operating profit margins over the nextfinancial year. ALL = combined sample of UP and DOWN. OBS = observations.
9
Two outlook sections are found in the‘Directors’Report’. Another two outlook sections are located in the‘Statement of Prospects’and in‘Positioned for the Future’.
of sentences and words. It is clear from Panel C that, with only six sentences, the median outlook section is a rather small part of the annual report.
Given the length of the outlook section it might seem surprising that we focus exclusively on these short sections. Clearly, forward-looking narratives can be found elsewhere in the annual report. We have decided to focus on the outlook section for
three reasons. First, Smith and Taffler (2000)
observe consistency in the use of tone throughout narratives. This suggests that the tone in the outlook section is representative of the tone outside these sections. Second, statements in the outlook section typically deal with group prospects, while forward-looking narratives outside these sections are typic-ally concerned with the outlook for individual segments. By aggregating segmental prospects into group prospects outlook sections effectively sum-marise forward-looking narratives in other parts of the annual report. Also, our focus on group prospects is consistent with prior studies on the usefulness and value-relevance of forward-looking disclosures (e.g. Hutton et al., 2003) as these studies deal with group forecasts, not with forecasts for individual segments. Finally, the content of the outlook section is frequently released to the stock market together with the preliminary earnings announcement and very often with exactly the same wording as in the annual report later on. Again, we believe that this suggests that special importance is attached to these summary sections
by capital market participants.10We now turn to a
discussion of the way in which we measure tone in the annual report outlook section.
3.2. Measuring tone
We assess tone by manually reading all the sentences in the outlook section and by taking context into account. This approach is referred to in the literature as‘meaning-orientated’content
analy-sis (e.g. Krippendorf, 1980; Weber, 1990). While such an analysis is frequently perceived to be more subjective than computer-assisted‘form-orientated’
frequency counts, it is dictated by our focus on impression management. In particular, impression management techniques are usually subtle, complex and sophisticated (Brennan et al., 2008) and they warrant a coding technique that is more sensitive than computer-assisted word counts (Clatworthy and Jones, 2003).
We start the scoring process by determining an outlook statement’s underlying topic. We
differen-tiate between‘sales’,‘costs’,‘earnings’,‘cashflow’, ‘dividends’, ‘market share’, statements about a
firm’s‘industry’and the wider ‘economy’, general ‘trading’ statements, references to ‘growth’ and ‘success and progress’, and even statements about
the outlook in general (which we refer to as‘general
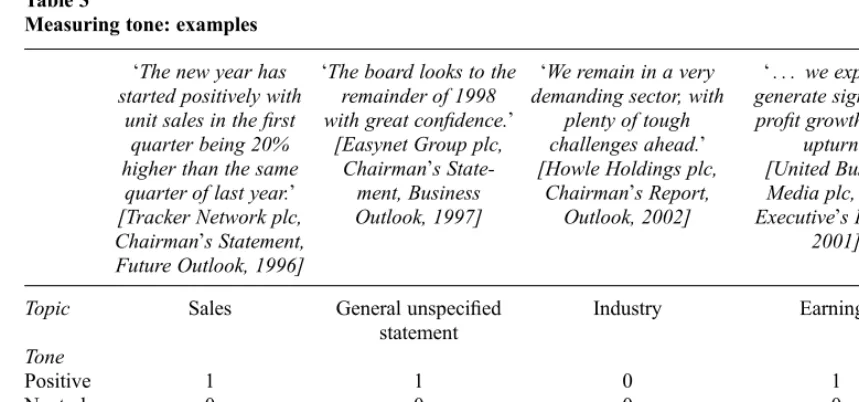
Table 3
quarter of last year.’ [Tracker Network plc, Chairman’s Statement, Future Outlook, 1996]
‘The board looks to the remainder of 1998
Topic Sales General unspecified
statement
The table illustrates our approach to measuring tone. The three tone categories are listed in the left-hand side column. The remaining columns contain four example statements and are used to illustrate our coding of tone. The three tone categories are given a score of 1 for‘existent’and 0 for‘non-existent’. The three
categories are mutually exclusive.
10Another reason for our focus on the outlook section is more practical. In particular, the manual coding of tone is a very time-consuming process and is feasible only if the number of sentences is strictly limited.
unspecified statements’). This list of topics has been
compiled after reading a set of 100 out-of-sample outlook sections from the two middle quartiles. Note that while we read outlook sections sentence by sentence our unit of measurement is actually the
‘statement’. Thus, while in most cases one sentence
contains exactly one statement, it is also possible for
sentences to contain more than one statement, if–
for example–a sentence contains a prediction for
both sales and profits.11
Next, we determine tone for each statement. We follow Bryan (1997) and Lang and Lundholm (2000) and differentiate between positive, neutral and negative statements. Positive and negative statements include both directional forecasts as well as general impressions. While directional forecasts with their explicit or implicit benchmarks are relatively easy to code, judging general impressions is more subjective. To mitigate this subjectivity we
compiled – prior to the coding of our two
subsamples – a list of keywords from the 100
out-of-sample outlook sections. This list was
intended to guide the first-named author in his
judgment of a statement’s tone and to increase the
consistency of his judgments over time. The list contains keywords which are frequently associated
with positive and negative impressions like‘
prom-ising’, ‘confident’ and ‘benefits’ for positive
pro-spects and ‘difficult’, ‘challenging’ and ‘soft’ for
negative prospects. Finally, we define a statement
as neutral if the statement uses keywords like
‘same’,‘in line with’or‘no growth’, if it includes a
mixed message with both positive and negative aspects, or if it appears to be factual without any apparent positive or negative connotation. Note that in assessing tone we take context into account. Thus, afirm’s prediction of a‘reduced loss’would
be coded as a positive statement even though,
individually, the two underlying keywords –
‘reduced’ and ‘loss’ – are commonly associated
with a negative tone.
A number of coding rules applied to our scoring process. In particular, we needed a decision rule for cases where more than one statement is made about the same topic. In such cases we decided to record only the‘highest-ranked’and‘least
ambigu-ous’statement on our scoring sheet. This is similar
to a decision rule in Kasznik and Lev (1995). For example, if a profit outlook is given for the first quarter as well as for the full year, then only the full year outlook is recorded. Where such a decision rule leads to no clear-cut ranking we
record the statement that comes first in terms of
chronological order if the tone of the competing statements is identical. Alternatively, if the tone is different then we record a neutral statement. For example, a neutral tone is recorded for‘costs’if the
firm indicates that next year’s pension charge is
likely to increase while other input prices are likely to ease.
Table 3 illustrates our scoring system for four example statements. It shows that the three tone categories are given a score of 1 for‘existent’and
0 for‘non-existent’and that the three tone
categor-ies are mutually exclusive. It also shows that we judge tone without reference to other forecast attributes. For example, the fourth statement is judged to be positive as the statement refers to
‘profit growth’ and this amounts to a directional
forecast. In particular, we do not take into account the existence of a conditional statement. We under-stand that some might argue that the existence of a conditional statement weakens the positive message of the outlook statement. However, judging the tone of the fourth example as neutral (or even negative)
is problematic as the firm has made a very clear
choice of not commenting on any periods prior to the upturn. This is a case of non-disclosure. If one interprets non-disclosure as bad news then one assumes that the predictions of early signalling theories are correct. But then there is no need to test these theories on real-world forward-looking nar-ratives.
Whenever a research design relies on manual content analysis reliability is an important consid-eration. To assess inter-coder reliability the second-named author coded once again the tone for a random sample of 50 annual reports. As far as the existence (non-existence) of topics is concerned the two coders agreed in 555 out of 600 cases. For the 102 cases where both coders judged a topic to be present, the agreement rate for‘tone’is 98%. This
agreement rate compares favourably with the 80% benchmark for inter-coder reliability in Milne and Adler (1999).
Finally, it is worth noting that, before any coding took place, we removed from the outlook sections any references to the identity of the firm. This makes it less likely that any potential bias is correlated with the variables of interest. For example, with the coder being unaware about a
firm’s loss status it becomes less likely that a
coder’s potential measurement bias could vary
across profit and loss firms. In other words, a
systematic measurement error –even if it existed
– should be constant across the two groups, and
thus the estimated difference in tone between loss 11Note that throughout the paper we refer to the entirety of
forward-looking statements as‘outlook section’.
and profitfirms should be an unbiased estimate of the true difference. Similar arguments apply to H4, H5 and H6. We now turn to a discussion of our testing strategy. Different strategies apply to
the two parts of our paper, namely H1–H2 and
H3–H6.
3.3. Hypothesis testing and regression model
H1 and H2 make predictions about the relative frequency of positive and negative statements in UP and DOWN. We test H1 and H2 in two ways. First, we calculate the mean and median difference between positive and negative statements and we test whether these differences are statistically sig-nificant. Second, we calculate a measure of overall tone as the deflated difference between positive and negative statements and we use the sum of positive, neutral and negative statements as the deflator. The advantage of this tone variable is that it is a standardised measure of forecast news as it no longer varies with the absolute number of
state-ments. Instead, for allfirms it ranges from 1 for
entirely negative to 1 for entirely positive. This standardised range makes it easy to compare tone across observations. Thus, the standardised tone variable will be our preferred measure of tone in subsequent tests.12
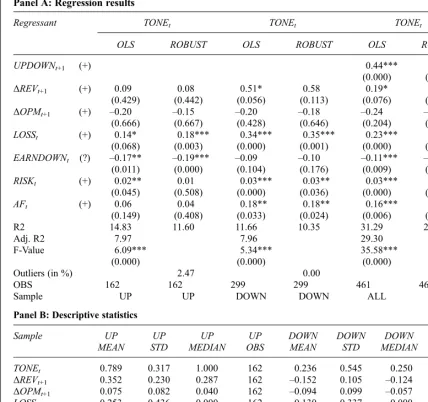
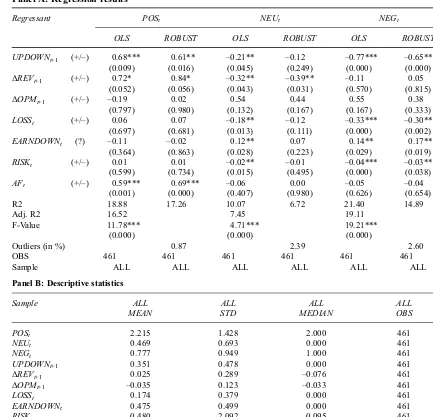
In the second part of our paper we test H3–H6
through a cross-sectional regression of standardised tone on loss status (H3), the sign of previous year’s
earnings change (H4), a measure of business risk (H5), and an indicator variable for the existence of an analyst earning forecast (H6). For this we include
LOSSt, EARNDOWNt, RISKt andAFt as the inde-pendent variables of main interest. In addition, we
control for next year’s performance by including
UPDOWNt+1,ΔREVt+1andΔOPMt+1as additional
regressors.This yields our regression model (1):
TONEt¼b0þb1UPDOWNtþ1þb2DREVtþ1
þb3DOPMtþ1þb4LOSSt
þb5EARNDOWNtþb6RISKtþb7AFt
þet ð1Þ
where LOSSt andEARNDOWNt are dummy
vari-ables that equal 1 if periodt’s earnings is negative
and lower, respectively, and 0 otherwise,RISKt is
defined as the standard deviation of ROE for the
five-year period t–4 to t, and AFt is a dummy
variable that equals 1 if Datastream reports in
periodtat least one annual analyst earnings forecast for periodt+1, and 0 otherwise. In terms of control
variables, UPDOWNt+1 is a dummy variable that
equals 1 for UP (and 0 for DOWN) and it controls
for the sign of next year’s performance change
whenever we pool UP and DOWN, while our sample selection variables,ΔREVt+1andΔOPMt+1,
control for the magnitude of next year’s sales
growth rate and change in operating profit margin.
Note the importance of controlling for future performance in testing our ceteris paribus
predic-tions H3–H6. For example, H3 predicts that loss
firm managers report a more positive tone than
profit firm managers, but this is done on the
assumption that both types offirms have the same
outlook for the future. However, in reality the
outlook is likely to vary between profit and loss
firms and with it an outlook section’s tone. In testing
H3–H6 we allow for this variation by including
UPDOWNt+1, ΔREVt+1 and ΔOPMt+1 as controls
for the sign and the magnitude of next year’s
financial performance. Finally, the dependent
vari-able in Equation (1), TONEt, is the standardised
measure of overall tone and ranges from 1 to 1.
We base the definition of all earnings and profit
variables – including LOSSt, EARNDOWNt and
ΔOPMt+1 – on Worldscope item WC01250. This
item is defined as ‘operating income’ and
repre-sents the ‘difference between sales and total
operation expenses’. In particular, it excludes all
types of operating and non-operating exceptional
items. We use this definition for three reasons.
First, Schleicher et al. (2007) demonstrate that this income number is highly correlated with other
measures of‘permanent’earnings. Permanence is a
desirable feature in the context of our study as it increases the likelihood that outsiders’expectations
are formed according to a random walk process.
Also, the elimination of exceptional items
increases the predictability of next year’s earnings
from an insider’s point of view. Second, trading
12
The treatment of neutral statements in the calculation of the overall tone variable deserves some further explanation. In particular, in calculating a standardised measure of tone a number of previous content analysis studies deflate by the sum of positive and negative keywords but not by neutral keywords (e.g. Brennan et al., 2008; Citron et al., 2008; Henry, 2008). Our decision to include neutral statements in the calculation of an overall tone’s deflator is taken for two reasons. First, very often we code a statement as neutral if the outlook section makes a positiveanda negative statement on the same topic. Previous content analysis studies commonly code these statements as two separate statements with a corresponding increase in the deflator. Thus, including neutral statements in the deflator is indeed quite consistent with the prior literature. Second, neutral statements substantially increase the variability of the overall tone variable, especially for UPfirms. Meaningful estimation of regression coefficients in part two of the paper is dependent on a minimum degree of variability in the regression variables. Finally, note that the numerator of the overall tone variable is unaffected by any decision in favour (or against) including neutral statements within the analysis.
statements conventionally comment on a firm’s
operating side but rarely onfinancial or tax aspects.
The use of ‘operating’ income is consistent with
this convention. Third, the argument that a nega-tive or a declining income number is a disappoint-ment and has costly consequences for managers is more convincing for a permanent than for a transitory earnings number (e.g. Walker and Louvari, 2003).
We define LOSSt and EARNDOWNt as
dichot-omous variables as H3 and H4 predict that it is the incidence, rather than the magnitude, of a loss and an earnings decline that affects a manager’s choice
of tone. Similarly, H6 predicts that it is the existence of an analyst earning forecast that leads to a more
positive tone. Thus, we also define AFt as a
dichotomous variable. Finally, we use ROE to
measureRISKtasROEdepends on changes in sales
as well as changes in the operating profit margin,
both of which are key performance measures in our study.
4. Results
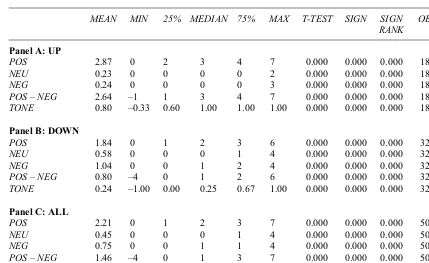
We start our empirical investigation by analysing the distribution of positive and negative statements,
POSandNEG, across our two subsamples, UP and
DOWN. These distributions are reported in Table 4 and they are used to test H1 and H2.
Looking at Table 4 wefirst note that the mean and median number of positive statements in UP is 2.87 and 3 while the corresponding numbers in DOWN are 1.84 and 2. Also, for both groups the number of positive statements exceeds the number of negative
statements: the mean and median value forPOS–
NEGis 2.64 and 3 in UP and 0.80 and 1 in DOWN.
A parametric one-sample t-test for the mean and non-parametric Sign and Sign-Rank tests for the
median confirm that the differences between
posi-tive and negaposi-tive statements are significant at the 0.000 level in both groups. Thisfinding is consistent with H1 but leads to a rejection of H2. Thus, while
UP firms understandably emphasise positive
aspects more than negative aspects, it is not the Table 4
Tone
MEAN MIN 25% MEDIAN 75% MAX T-TEST SIGN SIGN
RANK OBS
Panel A: UP
POS 2.87 0 2 3 4 7 0.000 0.000 0.000 181
NEU 0.23 0 0 0 0 2 0.000 0.000 0.000 181
NEG 0.24 0 0 0 0 3 0.000 0.000 0.000 181
POS–NEG 2.64 –1 1 3 4 7 0.000 0.000 0.000 181 TONE 0.80 –0.33 0.60 1.00 1.00 1.00 0.000 0.000 0.000 181
Panel B: DOWN
POS 1.84 0 1 2 3 6 0.000 0.000 0.000 321
NEU 0.58 0 0 0 1 4 0.000 0.000 0.000 321
NEG 1.04 0 0 1 2 4 0.000 0.000 0.000 321
POS–NEG 0.80 –4 0 1 2 6 0.000 0.000 0.000 321 TONE 0.24 –1.00 0.00 0.25 0.67 1.00 0.000 0.000 0.000 321
Panel C: ALL
POS 2.21 0 1 2 3 7 0.000 0.000 0.000 502
NEU 0.45 0 0 0 1 4 0.000 0.000 0.000 502
NEG 0.75 0 0 1 1 4 0.000 0.000 0.000 502
POS–NEG 1.46 –4 0 1 3 7 0.000 0.000 0.000 502 TONE 0.44 –1.00 0.00 0.50 1.00 1.00 0.000 0.000 0.000 502
The table presents descriptive statistics on the tone of forward-looking narratives in the annual report outlook section.POS,NEUandNEGare the (absolute) number of positive, neutral and negative statements per annual report outlook section.TONEis a measure of the overall tone. It is defined as the difference between positive and negative statements,POS–NEG, and scaled by the sum of positive, neutral and
negative statements,POS+NEU+NEG. UP (DOWN) refers to the subsample offirm-years with strongly increasing (decreasing) sales and operating profit margin over the nextfinancial year. A standard one-sample t-test (Sign test and Wilcoxon Sign-Rank test) is used to test for the significance of means (medians). P-values are reported to indicate significance levels. MIN = minimum. 25% = bottom quartile. 75% = top quartile. MAX = maximum. OBS = observations. ALL = combined sample of UP and DOWN.