DEVELOPMENT OF FLOW INJECTION METHOD
FOR ONLINE DETERMINATION OF THIOCYANATE BASED ON OXIDATION
BY PERMANGANATE
Hermin Sulistyarti
1.*, Spas D. Kolev
2, and Stephanie Lim
2 1Department of Chemistry, Brawijaya University, Jl. Veteran 1 Malang, Indonesia
2
Department of Chemistry, University of Melbourne Australia
Received May 25, 2010; Accepted July 16, 2010
ABSTRACT
The importance of developing method for thiocyanate becomes obvious, because thiocyanate can inhibit iodine uptake of thyroid gland leading to mumps disease. In this work, thiocyanate is oxidized by permanganate in the acid donor stream to cyanide, which is directly converted to hydrogen cyanide. Then, hydrogen cyanide diffuses through a Teflon membrane into acceptor stream containing nickel(II) in ammoniacal buffer to form tetracyanonickelate(II) which is detected spectrophotometrically at 267 nm. Analytical figures of merit were linear up to 50 mg L-1 for thiocyanate, with RSD of 1.34%, and detection limit of 0.07 mg L-1, respectively. Interfering anions were eliminated under stoichiometric amount of permanganate and sample throughput was 20 h−1. The method was validated for determining thiocyanate samples from synthetic and gold process waters with satisfactory results.
Keywords:Thiocyanate, flow injection, permanganate, spectrophotometry
INTRODUCTION
Thiocyanate is relatively nontoxic, however, at elevated level in the body can restrain iodine uptake by thyroid gland leading to endemic iodine disorder, especially under inadequate protein nutrition [1]. Continued ingestion of thiocyanate can cause goiter. Highly concentration of thiocyanate is usually observed in tailing water from gold process industry. In the body, thiocyanate is produced as a detoxicating mechanism of cyanide, and therefore thiocyanate presents in blood [2], saliva [3] and urine [4]. The existence of thiocyanate in the body fluids has been used for determining cyanide poisoning, smoker, or other diseases caused by consuming of cyanogenic glucoside [1]. Therefore, method for determination of thiocyanate which gives precise value of thiocyanate is demanded not only for environmental but also for medical and forensic needs.
Many methods for determination of thiocyanate in various samples have been developed. Most of spectrophotometric methods (batch or flow injection) were based on the formation of red complex of Fe(SCN)2+ [5] with short linear calibration of 0.1-2 mg/L or Konig reaction [3]. Sensitive methods using sophisticated instruments were also developed for analyzing thiocyanate in body liquids. Ion chromatography has been used for direct determination of thiocyanate which is detected by UV spectrophotometry at 210 nm. Although this method gave very low detection limit of 498.8 ng/L, recovery in blood was relatively low (83%) [6]. GC-MS was also
used for determining thiocyanate in blood involving sample pretreatment based on extractive alkylation with limit detection of 0.174 mg/L for thiocyanate. However, low recovery (80%) and high coefficients of variation (10%) were observed [2]. Similar method was applied to saliva giving linear calibration from 0.29 to 11.6 mg/L for thiocyanate [7]. Ion Pair Chromatography has also been reported to overcome the obstacle from the previous methods using C18 column with mobile phase containing tetrabutylammonium (TBA) phosphate (pH 6.5) in 40 (v/v) % acetonitrile at flow rate of 0.5 mL/min and detection at 210 nm. Linear calibration from 0.348 to 34.8 mg/L of thiocyanate was obtained with correlation coefficient of 0.999 [8].
Materials
All solutions were made up in Millipore deionised water with reagents of analytical grade. The stock solutions of 1000 mg L-1 cyanide and thiocyanate were prepared by dissolving the appropriate amounts of the KSCN (Ajax) in 0.01 M NaOH (BDH). Working solutions of H2SO4 were prepared by appropriately diluting concentrated H2SO4 (BDH). The ammonium buffer was prepared by mixing 0.1 M NaOH with 0.2 M NH4Cl (BDH) solutions. Stock solutions of 0.1 M NiCl2 and KMnO4 were prepared by dissolving the appropriate amounts of NiCl2.6H2O and KMnO4 all purchased from BDH, in ammonium buffer and sulfuric acid, respectively. Ferric nitrate solution was prepared by dissolving 40.4 g of Fe(NO3)3.9H2O (Ajax) in 80 mL of water and mixed with 8 mL of concentrated HNO3(BDH) and made up to 100 mL with water.
Instrumentation
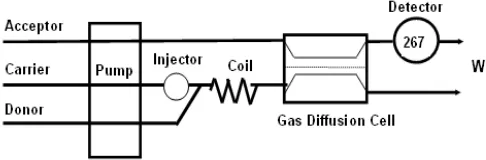
FIA manifold for determining thiocyanide is shown schematically in Fig. 1. It is consisted of peristaltic pump (Watson Marlo Alitea, Sweden) furnished with Tygon tubing (TACS Australia), a rotary injection valve (Rheodyne model 5020, USA) with a 500μl sample loop, Teflon tubing (0.5 mm ID, Supelco, USA), a home made gas diffusion cell and a spectrophotometric detector (Biochrom Libra S-12), furnished with a flow-through measuring cell (10 mm optical path length and 2 mm window diameter, Starna). The detector was interfaced to a PC via a PCL-818H data acquisition card (Advantech). Data were collected using a program written in Microsoft Quick C developed earlier. The mixing coils were made of helically coiled 1.0 m Teflon tubing. The gas diffusion cell with meander donor and acceptor channels consisted of two rectangular Perspex blocks (9.5 cm length, 2.3 cm width, and 3.0 cm height) held together by stainless steel screws. The depth and width of each channel were 0.5 mm and 2.0 mm, respectively. The donor and acceptor streams in the membrane separation cell were separated by Teflon membranes (ProTech, Australia).
Procedure
Thiocyanate determination
The analytical procedure for the determination of thiocyanate involved the injection of sample in the carrier stream which merged with reagent stream containing KMnO4 in H2SO4 via T-piece (Fig. 1). Under these conditions, thiocyanate was oxidized to hydrogen cyanide
Fig 1.Diagram of the experimental FI system
(Eq. 1) which diffuses through a Teflon membrane into acceptor stream containing nickel(II) in ammonia buffer to form tetracyanonickelate(II) (Eq. 2) which is detected spectrophotometrically at 267 nm.
-In order to validate the proposed FI system, this system was used to analyze thiocyanate in artificial and real (gold process water) samples. The FI-results of real samples analysis were compared to those of the APHA [5] standard method using spectrophotometric ferric-thiocyanate method.
RESULT AND DISCUSSION
Optimization of flow rate
Fig 2.Effect of flow rates with respect to sensitivity (A) and sampling rate (B) of thiocyanate
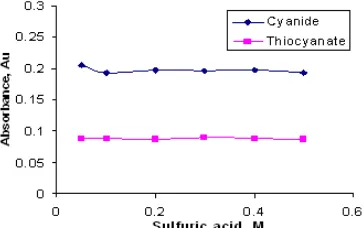
Fig 3.The effect of sulfuric acid to sensitivity
Fig 4.The effect of permanganate to sensitivity
Optimization of reagents
The optimal parameters for acceptor stream is characterized by the concentration and pH of ammonia buffer and the Ni(II) concentration. The influence of the ammonium buffer in the acceptor stream was studied by varying the effective concentration of NaOH in 0.2 M NH4Cl. When NaOH is added to NH4Cl, it coverts NH4Cl to NH3, thus creating an ammonium buffer. The buffer capacity will be at its maximum when the concentrations of NH4Cl to NH3 are equal, i.e. the effective concentration of NaOH is 0.1 M. For this reason 0.1 M NaOH was selected as the optimal effective concentration of NaOH in the acceptor stream. The pH corresponding to this ammonia buffer was 9.5.
Since the oxidizing power of KMnO4 is affected by concentration of acid, sulfuric acid concentration was optimized. The determination of thiocyanate was not
affected by the concentrations of 0.05-0.5 M H2SO4, this showed that thiocyanate was totally oxidized to cyanide, as observed in Fig. 3, the absorbance related to thiocyanate of each concentration is close half of that of cyanide as expected, as every mg L-1 of thiocyanate is converted to 26/58 mg L-1 cyanide. However, at concentration of lower than 0.3 M H2SO4 in thiocyanate reagent stream, the formation of a red brownish precipitate of manganese dioxide along the tubing was observed. It rapidly blocked the micro-pores of the membrane, thus decreasing its permeability and the analytical signal and led to poor precision. The formation of manganese dioxide was caused by insufficient acidity in the reaction zone since in neutral and alkaline media as well as at low acidity, permanganate is reduced to MnO2. To avoid the formation of MnO2 the concentration of H2SO4 in both reagent streams was selected as 0.4 M. After prolonged use of the flow system in some cases a small amount of MnO2 was still formed. An efficient method to remove this precipitate was based on flushing the donor channel with 0.05 M FeSO4in 0.5 M H2SO4 solution for 1 min [10]. This flushing method is also useful for cleaning up the brownish tubing after prolong use.
The effect of potassium permanganate on thiocyanate determination was conducted to ensure a complete oxidation process of thiocyanate to cyanide. By varying concentration in the range from 1.10-4 to 2.10-3 M, maximum absorbance could be attained for permanganate concentration greater than 5.10-4 M (Fig. 4). In subsequent experiments, the permanganate concentration was selected to be 1.10-3M.
Analytical figures of merit
Anion Interference
Ratio (mg/L) SCN-: X
n-% SCN Recovery
Anion Interference
Ratio (mg/L) SCN-: X
n-% SCN Recovery
Sulfide 10 : 0 100.00 Nitrite 10 : 0 100.00
10 : 10 100.89 10 : 10 101.38
10 : 50 114.67* 10 : 50 105.64
10 : 100 197.15* 10 : 100 103.30
Thiosulfate 10 : 0 100.00 Oxalate 10 : 0 100.00
10 : 10 99.06 10 : 10 98.07
10 : 50 88.96** 10 : 50 95.28
10 : 100 90.98** 10 : 100 101.07
Sulfite 10 : 0 100.00 Chloride 10 : 0 100.00
10 : 10 100.67 10 : 10 101.77
10 : 50 98.97 10 : 50 99.04
10 : 100 98.74 10 : 100 99.45
# The average of three determinations with RSD < 2 %, except of # and ^. * Irreproducible results as a result of membrane blockage by NiS(s).
* * Irreproducible results as a result of membrane blockage by S(s).
Fig 5. Calibration curves for thiocyante obtained under the optimal conditions of FIA
0.1 M buffer ammonia pH 9.5. The analytical figures of merit for thiocyanate determination were detection limit of 0.07 mg L-1, linear calibration (Fig. 5) range up to 50 mg L-1 (r2 = 0.9999), high reproducibility (RSD of 1.34%), and sampling rate of 20 h-1.
Interference studies
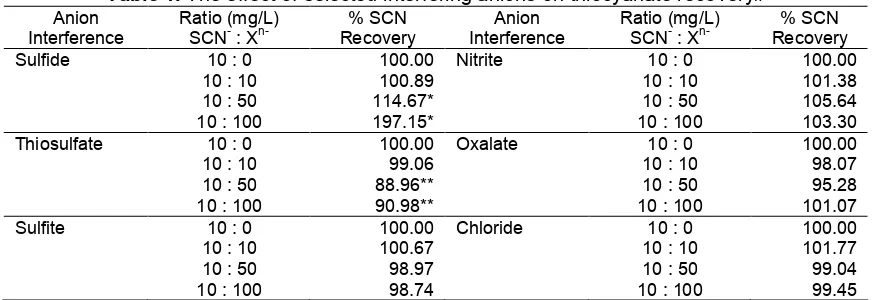
The effect of anions which might interfere the proposed method, such as sulfide, thiosulfate, sulfite, nitrite, oxalate, and chloride were examined by comparing the absorbance in the absence and the presence of various corresponding anions up to 100 mg L-1 in a samples containing 10 mg L-1 thiocyanate. These interfering agents behave as reducing agents, which react with permanganate, so that if permanganate is insufficient can result in low recoveries of thiocyanate. It was found that the method was not affected by all anions up to 100 mg L-1, except of sulfide and thiosulfate only up to 10 mg L-1(Table 1). This may be caused the insufficient concentration of
permanganate to oxidize sulfide to sulfate to give increasing absorbance shown by inflated apparent thiocyanate recoveries. The un-oxidized sulfide forms hydrogen sulfide in the donor stream which diffuses through the membrane, converts to sulfide ion and precipitates as NiS in the acceptor stream. The black precipitate of NiS could block the micro-pores of the membrane and resulted in poor reproducibility of the measurements.
As every mol of sulfide ion releases 8 mol electrons to be converted to sulfate ion and each mol of permanganate requires 5 mol of electrons, so 100 mg L-1 (0.0031 M) sulfide ion requires at least 0.005 M instead of 0.001 M permanganate. It was observed that higher concentration of permanganate the higher concentration of sulfide was eliminated accordingly. The use of high concentration of permanganate for long term, although in acidic solution, the excess of permanganate still could induce the slow formation of MnO2 in the presence of manganese(II) ions as shown in Eq. 3 [11]. In addition, the presence of high concentration of reducing agents in the sample which consume permanganate should be taken into account so that the concentration of permanganate is sufficient for oxidizing thiocyanate to cyanide.
2+ +
4 2 2
2MnO + 3Mn + 2H O 5MnO + 4H (3)
Thiocyanate analysis in real samples
Table 2Thiocyanate determination in real samples
No. Method A ± SD B ± SD C ± SD
1 Standard (APHA) 722.93 ± 7.12 836.89 ± 14.25 570.63 ± 7.71 2 FIA-Fe(SCN)2+ 720.61 ± 7.15 848.59 ± 14.31 580.28 ± 7.11 A, B, and C are three different samples from gold process water
cyanide which can also form tetracyanonickelate(II). In the injection of the first aliquot, the reagent stream was H2SO4 only. Under these conditions cyanide was converted to hydrogen cyanide which diffused through a Teflon membrane into acceptor stream containing nickel(II) in ammonia buffer to form tetracyanonickelate(II) which is detected spectrophotometrically at 267 nm. The absorbance measured (ACN) corresponds to the concentration of cyanide only. The injection of the second aliquot, the reagent stream was KMnO4 in H2SO4. Under these conditions, cyanide was converted to hydrogen cyanide, and thiocyanate was oxidized to hydrogen cyanide prior to reaction with nickel(II) in ammonia buffer to form tetracyanonickelate(II). The absorbance in this case corresponded to both cyanide and thiocyanate (ACN+SCN) while the difference (ACN+SCN - ACN) is related to the thiocyanate concentration.
Table 2 showed comparable results to all samples between spectrophotometric standard method and the proposed FI method supported by the value of t-test calculated (A = 0.53; B = 1.38; C = 2.19) < t-test tabulated (2.57 atαof 0.05, n = 3).
CONCLUSION
Flow injections method out-lined above allows sensitive and selective determination of thiocyanate, which can be easily automated. This FI system is operated in a simpler way (as thiocyanate is directly converted to cyanide, without any pretreatment) with simpler, inexpensive and more environmentally friendly reagents than those of existing methods. When real samples from gold process industry were analyzed directly by the proposed FI method for thiocyanate, the results obtained were comparable to those obtained from the appropriate standard method. As the uses of carcinogenic and potential drug synthesis reagents become big issues in environmental and medical areas,
and thus, their purchases are strictly prohibited, the hexaminenickel(II) reagent should be considered as an alternative for spectrophotometric standard method for thiocyanate.
ACKNOWLEDGEMENT
The authors are grateful to The University of Melbourne, Australia for facilitating research as well as Leviathan Resources (Stawell Gold Mines) Victoria,
Australia and Directorate General of Higher Education of Indonesia for the financial support.
REFERENCES
1. Dorea, J.G., 2004, J. Am. Coll. Nutr., 23, 2, 97– 101.
2. Kage, S., Nagata, T., and Kudo, K., 1996, J. Chromatogr. B,696, 1, 27–32.
3. Themelis, D.G., and Tzanavaras, P.D., 2002,Anal. Chim. Acta,452,2, 295–302.
4. Imanari, T., Tanabe, S., and Toida, T., 1982,
Chem. Pharm. Bull., 30, 10, 3800–3801.
5. American Public Health Association (APHA), 2005,
Standard Method for the Examination of Water and Wastewater,21sted., Washington D.C., 4–51. 6. Chinaka, S., Takayama, N., Michigami, Y., and
Ueda, K., 1998,J. Chromatogr. B, 713, 353–359. 7. Buddha, D.P., and Michael, S.L., 2006, J. Anal.
Toxicol., 30, 8, 511–515.
8. Tamošiünas, V., Padarauskas, A., and Pranaityté, B., 2006,Chemija,17, 2–3, 21–24.
9. Sulistyarti, H., Cardwell, T.J., and Kolev, S.D., 1997,Anal. Chim. Acta,357, 1, 103–109.
10. Haque, M.R., and Bradbury, J.H., 1999, Clinical Chemistry, 45, 9, 1459–1464.