DIFFUSION BEHAVIOR OF KETOPROFEN THROUGH CHITOSAN-ALGINATE MEMBRANES
Purwantiningsih Sugita*, Rini Siswati Asnel, Budi Arifin, and Tuti Wukirsari
Department of Chemistry, Bogor Agricultural University,Gedung Fapet W2 Lt 4-5, Jl. Agatis Kampus IPB Darmaga, Indonesia
Received July 27, 2010; Accepted August 5, 2010
ABSTRACT
Chitosan-alginate membrane diffusion behavior has been investigated for its application in drugs delivery system. Ketoprofen diffusion behavior assay were performed at 37 and 42 °C to membrane thickness (h) and donor
cell concentration of ketoprofen variations (A). The results showed that equilibrium concentrations (Cs) of ketoprofen
equation was 27.0087 + 0.09067T − 1.7499h + 0.1030A + 0.0161h2 − 0.0022A2 + 0.0040Th − 0.0018TA +
0.0095hA. The value of Cs was closer to the expected therapy concentration at 50 and 75 mg/L with thin membrane
(10-34 μm). Based on Higuchi equation, the model for J and D were J = 11.0849 – 0.2713T – 0.3132h – 0.7461Cs – respectively. The two dimensional contour maps of J versus A and h, both at 37 and 42 °C, showed an increasing of J value as A, h, or T increased.
Keywords: ketoprofen, chitosan-alginate, diffusion
INTRODUCTION
The ability of chitosan to form membrane has been much studied. The membranes chitosan are potential to be used in drug delivery systems. Yamada et al. [1] and Sutriyo et al. [2] have coated ketoprofen inflammatory drugs and propranolol hydrochloride anti-hypertension drugs by chitosan membranes, respectively. However, its fragile membrane property needs to be strengthened by adding glutaraldehyde as a cross-linker and natural or synthetic polymer as an interpenetrating agent. Sugita et al. have been investigated chitosan modified membranes by adding glutaraldehyde and natural hydrocolloid like guar gum [3], alginate [4], carboxymethylcelullose (cmc) [5] and xanthan gum [6], respectively. The chitosan modified are potential for membranes to be used in drug delivery systems. The potential of chitosan-guar gum membranes as drug delivery system have investigated by Nata et al. [7] and Sugita et al. [8] through such ketoprofen diffusion and in vitro dissolution behaviors, respectively.
* Corresponding author.
Email address : [email protected]
Nata et al. [7] reported that ketoprofen diffusion
through such chitosan-guar gum membrane was initiated by swelling process followed with membrane pores opening that release the drugs content from the matrix. Sugita et al. [8] reported that microphotographs of ketoprofen microcapsules in the gastrointestinal (KCl-HCl solution, pH 1.2) after 30 min of dissolution were shattered, so ketoprofen release became uncontrollable. Guar gum was not hold out to acid solution at pH < 3.0.
Microphotographs of ketoprofen microcapsules in the intestinal (buffer phosphate solution, pH 7.4) after 90 min of dissolution were still controllable and coated of ketoprofen content about 31.5%, but release time was too fast. On the other hand, shelf life of microcapsules are about 18.92 months if kept in climatic chamber at (40 ± 2) °C and RH (75 ± 5)% for 3 months [9].
Herdini [10] have been used chitosan-alginate membranes as drug delivery system for curcuma. Sarmento et al. [11], Van den Berg et al. [12], and Pandey & Khuller [13] have also used it for coating insulin hormone, protein, and antibiotics drug (like riphamicyne, isonyazide tuberculosis, pirazynamide), respectively. The membranes were applicable as coating material on slow-released drug preparation and hold out to acid solution at pH < 3.0 [14]. In previous research, Sugita et al. [4] reported that the membrane is also potential for membranes to be used in drug delivery systems. In this research, the membranes
could be used to coat a ketoprofen. This membrane
has not been investigated practically. Ketoprofen is a non-steroid anti-inflammatory drug (NSAID) with poor-solubility in water. Serious gastrointestinal toxicity, such as bleeding, ulceration, and perforation, can occur in patients treated chronically with ketoprofen therapy. This weakness can be overcome by microencapsulation the ketoprofen. It is hoped that the microcapsule can control the released of the ketoprofen. Chitosan-alginate membranes are expected to be more effectively coat and control the drug release.
Purwantiningsih Sugita et al.
This paper presents the diffusion behavior of ketoprofen through chitosan-alginate membranes. Membrane diffusion performance has been examined from the amount of released ketoprofen concentration
under the equilibrium condition (Cs), flux (J), and
diffusion coefficient (D) values resulted from the Higuchi
equation calculation. The relation between J, membrane
thickness (h), and ketoprofen concentration (A) are
modeled using response surface method (RSM).
EXPERIMENTAL SECTION
Materials
Chitosan was from CV Dinar Cikarang Bekasi with specification of moisture and ash contents, molecular weight, and degrees of deacetylation were 8.49%,
0.15%, 6.63×10⁵ g/mol and 74.15% respectively;
alginate and glutaraldehyde; ketoprofen was from PT Kalbe Farma. Aquades was from Organic Chemistry Laboratory, Institute of Bogor Agriculture.
Instrumentation
Shimadzu Pharmaspec 1700 UV Spectrophotometer and scanning electron microscopy
(SEM) (JEOL-JSM-5310LV). Model of ketoprofen Cs, J
and D were calculated using response surface method
(RSM) in Minitab Release 14.
Procedure
Chitosan-alginate Membrane Preparation [9]
Chitosan-guar gum membranes were prepared by mixing 75 mL of 2.25% (w/v) chitosan solution, 5 mL of 0.83% (w/v) alginate solution, and 1 mL of 4.0% glutaraldehyde solution, which was then poured into a
21.40 x 28.25 cm mold. Membranes thickness (h) was
varied by varying the volume of chitosan solution that was used.
Membrane Diffusion in Vitro Assay [7]
Three degrees of donor cell concentration (A) were
used: 25, 50, and 75 μg/mL, whereas receptor
compartment was filled with ethanol-water (1:1) solvent. The instrument was then put into a 37 and 42 °C water bath to keep the temperature. The mixing was assisted by two aerators that applied at both sides of the diffusion cell. A 10.0 mL aliquot was sampled from the recipient cell and the diffused ketoprofen concentration was determined by UV spectrophotometer. Aliquot sampling was performed every 30 min for the diffusion assay at 37 °C during 3 h and every 20 min for the assay at 42 °C during 6 h until the ketoprofen concentration became relatively constant (Cs). Substitute solvent (10.0 mL) was
added after each time an aliquot was sampled. Aliquot absorbance was determined at 255 nm.
Ketoprofen Diffusion Coefficient (D) and Flux (J) Modeling
Flux (J) and D were calculated by Higuchi equation:
dQ/dt = drug releasing rate per matrix surface area
Cs = drugs concentration that has been released to
the recipient cell under saturated or equilibrium condition (mg/L)
A = total concentration of drug either outside or
inside on gel matrix (mg/L)
H = membrane thickness (μm)
Flux (J) and D relationship mathematical models
were obtained using RSM method integrated in Minitab
Release 14 software with donor cell concentration (A),
equilibrium concentration (Cs), diffusion temperature
(T), and membrane thickness (h) as the factors.
Outputs of this modeling are J and D equations and
two dimensional contour plots.
RESULT AND DISCUSSION
Higuchi Models of Cs, J, and D
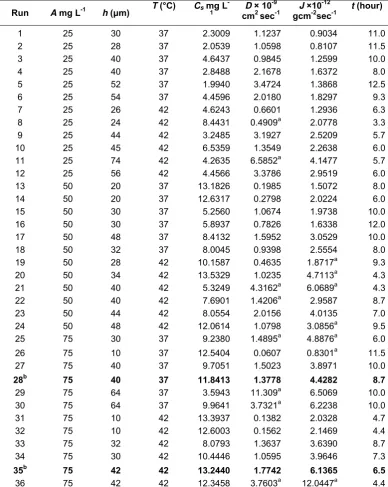
Table 1 shows the equilibrium concentration (Cs),
diffusion coefficients (D) and flux (J) as the results of diffusion assays. The both were derived from Higuchi’s Law using linear relationship between time and mass of ketoprofen that passed through the membranes.
The influence of T on diffusion coefficient in this
research was not significant due to the varied number and size of hollow space in membranes. Schmidt et al. [15] reported the dependence of water vapor permeability on the porosity of polyurethane membranes. This behavior may be due to changes in physical properties of the polymeric membrane such as the pore size or possibly the diffusivity of solvent in the
membrane[16].
Mathematical model for Cs obtained by RSM
using Minitab14 software is Cs = 27.0087 + 0.0906T –
1.7499h + 0.1030A + 0.0161h2 – 0.0022A2 + 0.0040Th
– 0.0018TA + 0.0095hA with R2 = 85.6%. R2 value for Cs model is less than 90%. However, statistical analysis of the equation shows that A, T, and h factors
each has significant effects to Cs value, with P value
Table 1. The Cs, D and J values that were obtained from diffusion assays
Run A mg L-1 h (μm) T (°C) Csmg L
-1 D × 10
-9
cm2 sec-1
J ×10-12 gcm-2sec-1
t (hour)
1 25 30 37 2.3009 1.1237 0.9034 11.0
2 25 28 37 2.0539 1.0598 0.8107 11.5
3 25 40 37 4.6437 0.9845 1.2599 10.0
4 25 40 37 2.8488 2.1678 1.6372 8.0
5 25 52 37 1.9940 3.4724 1.3868 12.5
6 25 54 37 4.4596 2.0180 1.8297 9.3
7 25 26 42 4.6243 0.6601 1.2936 6.3
8 25 24 42 8.4431 0.4909a 2.0778 3.3
9 25 44 42 3.2485 3.1927 2.5209 5.7
10 25 45 42 6.5359 1.3549 2.2638 6.0
11 25 74 42 4.2635 6.5852a 4.1477 5.7
12 25 56 42 4.4566 3.3786 2.9519 6.0
13 50 20 37 13.1826 0.1985 1.5072 8.0
14 50 20 37 12.6317 0.2798 2.0224 6.0
15 50 30 37 5.2560 1.0674 1.9738 10.0
16 50 30 37 5.8937 0.7826 1.6338 12.0
17 50 48 37 8.4132 1.5952 3.0529 10.0
18 50 32 37 8.0045 0.9398 2.5554 8.0
19 50 28 42 10.1587 0.4635 1.8717a 9.3
20 50 34 42 13.5329 1.0235 4.7113a 4.3
21 50 40 42 5.3249 4.3162a 6.0689a 4.3
22 50 40 42 7.6901 1.4206a 2.9587 8.7
23 50 44 42 8.0554 2.0156 4.0135 7.0
24 50 48 42 12.0614 1.0798 3.0856a 9.5
25 75 30 37 9.2380 1.4895a 4.8876a 6.0
26 75 10 37 12.5404 0.0607 0.8301a 11.5
27 75 40 37 9.7051 1.5023 3.8971 10.0
28b 75 40 37 11.8413 1.3778 4.4282 8.7
29 75 64 37 3.5943 11.309a 6.5069 10.0
30 75 64 37 9.9641 3.7321a 6.2238 10.0
31 75 10 42 13.3937 0.1382 2.0328 4.7
32 75 10 42 12.6003 0.1562 2.1469 4.4
33 75 32 42 8.0793 1.3637 3.6390 8.7
34 75 30 42 10.4446 1.0595 3.9646 7.3
35b 75 42 42 13.2440 1.7742 6.1365 6.5
36 75 42 42 12.3458 3.7603a 12.0447a 4.4
a
These values were not included in RSM due their large error b These values were used for SEM analysis.
Similar modeling for J and D respectively resulting:
J = 11.0849 – 0.2713T – 0.3132h – 0.7461Cs – 0.0096A
– 0.0001h2 – 0.0131Cs
2
+ 0.0002A2 + 0.0084Th +
0.0275TCs – 0.0018TA – 0.0059hCs + 0.0021hA +
0.0037CsA with R 2
= 97.9% and D = – 12.5000 +
0.2266T + 0.1313h + 0.1538Cs + 0.1200A − 0.0009h
2 +
0.0240 Cs
2
− 0.0009A2 + 0.0015Th − 0.0150 TCs −
0.0011TA – 0.0096hCs + 0.0004hA + 0.0039CsA with R2
= 98.7%. Statistical analysis to J and D equation also
shows significant effect of A, Cs, T, and h to J and D
value at 99% confidence level.
Cs model can be applied to estimate A, h, and T
values needed for obtaining expected ketoprofen
therapy concentration as slow-released preparation. J
and D models can be used to estimate
chitosan-alginate membrane diffusion properties for ketoprofen at different A, T, h, and Cs values.
Purwantiningsih Sugita et al.
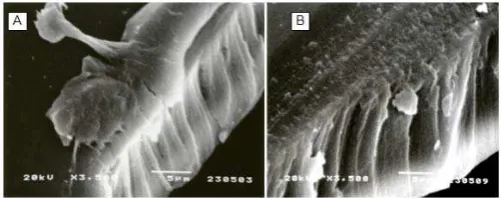
Fig 1. Microphotographs of (A) control; (B) run-28; (C)
run-35 chitosan-alginate membranes surface (top section) at 10,000 times magnification
Fig 3. Microphotographs of (A) before diffusion assay;
(B) run-3 (curcumin concentration (Cd) = 8 g/L; T=37 °C); (C) run-8 (Cd = 8 g/L; T = 41 °C) chitosan-alginate
membranes surface at 5,000 times magnification [10]
Fig 2. Microphotographs of (A) control; (B) run-28; (C)
run-35 chitosan-alginate membranes surface (lateral section) at 10,000 times magnification
Fig 4. Microphotographs of (A) control; (B) run-9; (C)
run-25 membranes surface at 7,500 times magnification [7]
Fig 5. Microphotographs of (A) control; (B) run-25
membranes cross-section at 3,500 times magnification [7]
Membranes Characterization
SEM image at 10,000 times magnification (Fig. 1A) clearly showing that chitosan-alginate membrane surface (top section) doesn’t have any pores and look very smooth before diffusion assay. Before diffusion assay, lateral section observation also doesn’t show that the membrane has any cavity inside (Fig. 2A). This surface morphology is similar with the result reported by Herdini [10] (Fig. 3A).
The observation of membranes after diffusion assay (Fig. 1B and 2B) showed that the membranes have small hollow space. These holes probably formed due to membrane swelling as the effect of ketoprofen concentration difference and also temperature. Swelling process is estimated to be enhanced when the temperature is raised. It was supported by the
observation of run- 28th membrane (A = 75 mg/L; T = 37
°C; h = 40 μm). In the previous study, Herdini [10]
reported that chitosan-alginate membrane that has been used in the curcuma diffusion assay at 37 °C has widely opened pores that dig deep into the membrane (Fig. 3B).
Increasing temperature accommodate membrane swelling to occur more easily. This fact is supported by
the 35th diffusion assay membrane observation result
(A = 75 mg/L; T = 42 °C; h = 42 μm). Membrane pores
became more widely opened and dig deeper into the membrane (Fig. 1C and 2C). This result is similar with the fact that Mulder [17] has reported, temperature rise will enlarge membrane pore holes due to thermal expansion. Herdini [10] also reported that
chitosan-alginate membrane that has been used in the 8th
diffusion assay at 41 °C has wider cavities, the membrane became porous, wavier, and cruder (Fig. 3C). Santos et al. [18] has reported that increasing temperature give rise to sodium sulfamerazine diffusion coefficient pass through chitosan membrane. Results
from the 28th and 35th diffusion assay are consistent
with this. The J value for the 35th assay (T=42 °C),
which is 6.1365 x 10⁻¹² g cm-2 sec-1, is higher than the J
value for the 28th assay (T = 37 °C), which is 4.4282 ×
10-12 g cm-2 sec-1. This also happened to the D value
obtained; the 35th assay D value (1.7742 x 10⁻⁹
cm2/sec) is higher than the D value for the 28th assay
(1.3778 x 10⁻⁹ cm2/sec) (Table 1). If we relate these
facts with the SEM images, this might be due to
membrane porosity in the 35th is higher than in the 28th
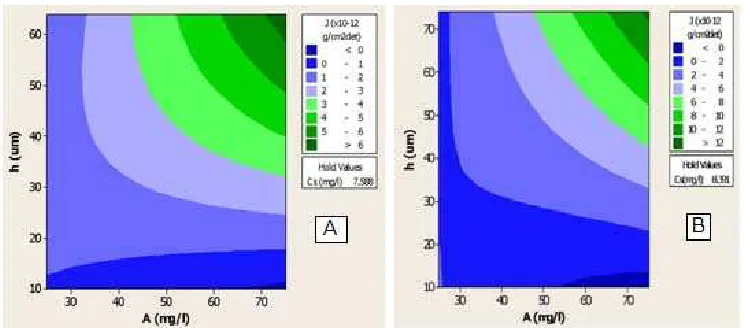
Fig 6. Relationship curve between A and h versus J at T = 37 °C and Cs = 7.588 mg/L (A) and T = 42 °C and Cs =
8.391 mg/L (B)
The results are similarly with Nata et al. [7]. Nata et al. [7] reported that the microphotographs of chitosan-guar gum membranes (Fig. 4) were unporous or had varied porosity due to dense cross-linking between chitosan molecules. It was estimated that small holes in
run- 9 membrane (Cd = 75 mg/L; T = 37 °C; h = 31 μm)
were caused by swelling process that was enhanced by concentration difference and temperature increase.
The observation of membranes cross-section shows the same results (Fig. 5). It shows that the membranes have hollow space. However, this hollow space did not emerge the surface of the membranes (Fig. 4A). The swelling process on membranes caused the hollow space became larger (Fig. 5B) and membranes pores that are the channel for the hollow space were opened (Fig. 4C). Swelling process is estimated to be enhanced when the temperature is raised. It was supported by the observation of run- 25
membrane (Cd = 75 mg/L; T = 42 °C; h = 35 μm). The
membrane became porous, wavier, and cruder (Fig. 4C). However, the pores were not spread throughout the membranes. It was supported by observation of the same membrane, but on the other area. This pore-opening process is very good for drug delivery. The swelling process of the membranes can make the drugs released when the microcapsule interacts with a body liquid.
The Influence of Ketoprofen Concentration, Temperature, and Membrane Thickness Effect on
Ketoprofen Cs
Table 1 show that the equilibrium concentration (Cs), diffusion coefficients (D) and flux (J) as the results of diffusion assays. At ketoprofen concentration of 25,
50, and 75 mg/L, Cs value varied between 1.9940 and
13.5329 mg/L for membrane that as thick as 10-74 μm at
37 and 42 °C. For ketoprofen concentration of 25 mg/L
at 37 °C and 42 °C have a maximum value of Cs were
4.6437 mg/L and 8.4431 mg/L, respectively that reached by the membrane with intermediate thickness
(40 μm) and the thin membrane (24 μm), respectively.
These Cs values are still lower than the expected
ketoprofen therapy concentration. But, for 50 mg/L ketoprofen concentration at 37 °C and 42 °C have
maximum Cs value were 13.1826 mg/L and 13.5329
mg/L, respectively that obtained by the thin membrane
(20 μm) and the thick membrane 34 μm, respectively.
For 75 mg/L ketoprofen concentration at 37 °C and
42 °C have maximum Cs 12.5404 mg/L and 13.3937
mg/L, respectively that obtained by membranes with
same thickness (10 μm). It has been showed that at 50
and 75 mg/L ketoprofen concentration, Cs values are
closer to the expected therapy concentration,
15−25 mg/L. Diffusion time needed to reach Cs value at
applied A, h, and T values are varied between 3.33 and 12.5 h. These suggest that chitosan-alginate is potential to be applied as ketoprofen coating material on slow-released drug preparation, thus ketoprofen administration frequency and its negative side effect can be minimized.
The Influence of Ketoprofen Concentration, Temperature, Cs, and Membrane Thickness Effect
on Ketoprofen flux (J)
Fig. 6 show that the two dimensional contour maps of J to A and h at 37 °C and 42 °C, respectively.
Fig. 6a described that at condition T = 37 °C and
Cs = 7.588 mg/L (mean value), maximum J value were
obtained when ketoprofen concentration is high (70–75
mg/L) on the thick membrane (59–64 μm), while the
minimum value of J were reached when ketoprofen
concentration is high (65–75 mg/L) on the thin
membrane (10−12 μm). In other words, the higher
Purwantiningsih Sugita et al.
concentration and membrane thickness will generally result in higher flux value. The increasing amount of ketoprofen molecules will give rise to the propulsion force generated, thus membrane swelling and ketoprofen diffusion will be more easily take place. This result probably obtained due to the better porosity of thick membrane than the thin ones. But this suggestion
is not reflected in the 35th diffusion assay SEM images
(Fig. 2C) which shows a quite good porosity for the
intermediate thickness membrane (42 μm).
Similar condition was discovered at T = 42 °C and
Cs = 8.391 mg/L (mean value) (Fig. 6B). Maximum
J value were obtained when ketoprofen concentration
was high (73−75 mg/L) on the thick membrane
(72−74 μm), on the other hand, the minimum value were
reached when high concentration (53-75 mg/L) on the
thin membrane (10−14 μm). On this condition, the
similar result like in 37 °C was obtained; J is proportional with ketoprofen concentration and membrane thickness. Generally, at higher temperature (42 °C) the higher
Cs value (mean value Cs = 8.391 mgLl) was obtained
than at the lower temperature (37 °C) (mean value
Cs = 7.588 mg/L). At higher temperature tends to speeds
up membrane swelling, thus enlarge pores size then increase ketoprofen molecules flow rate across the membrane. Previously Mulder [17], Ariyaskul et al. [19],
Susheelkumar et al. [20], and Chen et al. [21] also
reported increased flux as the temperature rise, but membrane selectivity decreased.
CONCLUSION
Chitosan-alginate membrane with 10−34 μm
thickness has potential as ketoprofen coating material in slow-released drug preparation of 50 and 75 mg/l dose at 37 °C or 42 °C. Cs value were obtained at the conditions are closer to the therapy concentration. The
two dimensional contour maps of J versus A and h
shows increasing J value as A, h, or T increased.
ACKNOWLEDGEMENT
This research is a part of major research with title Chitosan Development as Adsorbent and Coating Agent. Funding from Competency Grant 2008 Higher Directorate General Education, National Education Department are gratefully acknowledged.
REFERENCES
1. Yamada, T., Onishi, H., and Machida Y., 2001.
Yakugaku Zasshi 121, 3, 239–245.
2. Sutriyo, Joshita, D, and Indah, R., 2005. Majalah
Ilmu Kefarmasian,2, 145–153.
3. Sugita, P., Sjahriza, A., and Lestari, S.I., 2006, J.
Natur., 9, 32–36.
4. Sugita, P., Sjahriza, A., and Wahyono, D., 2006, J.
Sains dan Teknologi, 8, 133–137.
5. Sugita, P., Sjahriza, A., and Rachmanita, 2007, J.
Alchemy, 6, 57–62.
6. Sugita, P., Sjahriza, A., and Utomo, D.W., 2007,
Optimization synthesis chitosan-xanthan gum,
Proceeding 1st International Conference on
Chemical Science, Yogyakarta-Indonesia, 24-26 May 2007.
7. Nata, F., Sugita, P., Sjahriza, A., and Arifin, B.,
2007, Diffusion behavior of ketoprofen through
chitosan-guar gum membranes, Proceeding
Seminar International Conference and Workshop
on Basic science and Applied Science,6-7 August
2007.
8. Sugita, P., Amelia, F., Srijanto, B., Arifin, B., and
Wukirsari, T., 2007, Perilaku disolusi ketoprofen
tersalut gel kitosan-gom guar. Proceeding Seminar
Regional ITB Bandung Indonesia-UKM Malaysia,
16-17 December 2007
9. Sugita, P., Srijanto, B., Arifin, B., and Setyowati,
E.V., 2009. Indo. J. Chem., 9, 3, 391–397.
10. Herdini, 2008. Mikroenkapsulasi ekstrak rimpang
temulawak (Curcuma xanthorriza Roxb) tersalut
kitosan-alginat, Tesis, Fakultas Matematika dan
Ilmu Pengetahuan Alam, Institut Pertanian Bogor, Bogor:
11. Sarmento, B., Ribeiro, A., Veiga, F., Sampaio, P.,
Neufeld, R., and Ferreira, D., 2007, Pharm. Res.,
24, 2198–2206.
12. Van den Berg, G.W., Drolet, C., Scott, S.L., and
Noue, J.D.L., 2001, J. Controlled Released, 77,
297–307.
13. Pandey, R., and Khuller, G.K., 2004, J. Antimicrob.
Chemother., 53, 635–640.
14. Bregni, C., Degrossi, J., Garcia, R., Lamas, M.C.,
Firenstein, R.D., and Aquino M.A., 2000, Ars.
Pharm., 41, 245–248.
15. Schmidt, H., Marcinkowska, D., and Cieślak, M.,
2005, Fibres Text. East. Eur.,13, 2 (50), 66–68.
16. Goosen, M.F.A., Sablani, S.S., Maskari, S.S.,
Al-Belushi, R.H., and Wilf, M., 2004, Effect of feed
temperature and flow rate on permeate flux in spiral
wound reverse osmosis systems, In: Second
LACCEI International Latin American and Caribbean Conference for Engineering and Technology; Miami, 2-4 June 2004. Miami: LACCEI. Paper no 131.
17. Mulder, M., 1996. Basic Principles of Membrane
Purwantiningsih Sugita et al.
18. Santos, D.E.S., Neto, C.G.T., Fonseca, J.L.C., and
Pereira, M.R., 2008, J. Membr. Sci., 325, 1, 362–
370.
19. Svang-Ariyaskul, A., Huang, R.Y.M., Douglas, P.L.,
Pal, R., Feng, X., Chen, P., and Liu, L., 2006, J.
Membr. Sci., 280, 1-2, 815–823.
20. Susheelkumar, G.A., Prathaba, B., Manjeshwara,
L.S., and Aminabhavi, T.M., 2007. J. Polym. Sci.,
48, 18, 5417–5430.
21. Chen, J.H., Liu, Q.L., Xiong, Y., Zhang, Q.G., and