THE INFLUENCE OF PVA.cl.CITRIC ACID/CHITOSAN MEMBRANE HYDROPHICILITY
ON THE TRANSPORT OF CREATININE AND UREA
Retno Ariadi Lusiana
1,2,*, Dwi Siswanta
2, Mudasir
2, and Takashi Hayashita
3 1Department of Chemistry, Faculty of Mathematics and Natural Sciences, Universitas Diponegoro, Semarang 50275, Indonesia
2
Department of Chemistry, Faculty of Mathematics and Natural Sciences, Universitas Gadjah Mada, Sekip Utara, Yogyakarta, Indonesia, 55281
3
Department of Materials and Life Sciences Faculty of Science and Technology, Sophia University, Kioicho, Chiyoda-ku, Tokyo 102-8554, Japan
Received September 23, 2013; Accepted November 2, 2013
ABSTRACT
The influence of cross-linking and membrane hydrophilicity on the transport rate had been studied using a membrane prepared from a mixture of chitosan/PVA cross-linked citric acid (PVA.cl.CA) for creatinine and urea transport. The optimum mole ratio of PVA:citric acid as well as the best composition of chitosan:PVA.cl.CA were determined using creatinine transport study. Using the optimum compositions, further study was done using different thickness of the membrane in transporting creatinine, urea and a mixture of 3 species (creatinine, urea and vitamin B12). Membrane characterization was done using FT-IR spectrophotometer, water absorption test, TG/DTG and
SEM. The results showed that the optimum composition PVA:citric acid was obtained to be 90:1, having % WU of
113.74% and creatinine transport percentage of 18.16%. Meanwhile, the optimum composition of
chitosan:PVA.cl.CA was found at 4:6 ratio having % WU and % transport of 136.67% and 24.26%, respectively. The optimum transport capacity was found for membrane thickness of 50 µm with WU% at 139.61% and the percent transport of creatinine and urea each was 38.93% and 60.36%. The presence vitamin B12in the solution of is proved
to disturb the transport of creatinine and urea through the membrane. Finally, hydrophilicity seemed to give substantial contribution in the transport process as well as the mechanical strength of the membrane.
Keywords:chitosan; PVA; transport; cross-linking; hydrophilicity
ABSTRAK
Transpor kreatinin dan urea melalui membran campuran kitosan/citric acid crosslinked PVA (PVA.cl.CA) telah dikaji untuk mempelajari pengaruh sambung-silang dan hidrofilisitas membran terhadap laju transport. Rasio mol PVA:asam sitrat dan perimbangan kitosan:PVA.cl.CA terbaik diuji dengan transpor kreatinin. Membran dengan komposisi terbaik divariasi ketebalannya dan digunakan untuk uji transpor kreatinin, urea serta transpor paduan 3 spesies (kreatinin, urea dan vitamin B12). Karakterisasi membran dilakukan menggunakan spektrofotometer FT-IR,
uji serapan air, TG/DTG, SEM. Hasil penelitian menunjukkan bahwa komposisi asam sitrat optimal pada perbandingan mol PVA:asam sitrat 90:1 dengan % WU sebesar 113,74% dan persentase transpor kreatinin sebesar 18,16%. Perimbangan terbaik antara kitosan/PVA.cl.CA pada perbandingan 4:6 dengan % WU sebesar 136,67% dan persentase transpor sebesar 24,26%. Kemampuan transpor terbaik dimiliki oleh membran dengan ketebalan 50 µm dengan % WU sebesar 139,61% dan persentase transpor kreatinin dan urea masing-masing sebesar 38,93% dan 60,36%. Keberadaan vitamin B12dalam larutan sedikit mengganggu transpor kreatinin dan urea oleh membran.
Hidrofolisitas membran memberi kontribusi nyata pada proses transport dan kekuatan mekanik membran.
Kata Kunci:kitosan; PVA; transpor; sambung-silang; hidrofilisitas
INTRODUCTION
Hemodialysis is a biomedical method used to replace kidney function in the removal of metabolic waste substances from the body. The principle of hemodialysis is based on the diffusion of the toxic
compound uremic from the body to the dialysate solution through a semi-permeable membrane as a response to the differences in concentration or pressure [1].
containing entrained components, and an acceptor phase containing the components that can pass through the membrane. The transport through the membrane is achieved due to the gradient concentration in both phases. The permeability nature of the membrane means that the membrane can block certain species that are larger than the membrane pore size, and pass other species with smaller sizes. Selective properties of these membranes can be used in the separation process. To be used for hemodialysis, membranes should (1) have high permeability, which means that they can transport metabolites as quick as possible and (2) be hemocompatible or not rejected by the blood [2].
Chitosan is a polycationic biopolymer derived from chitin and is hydrophobic by nature. Chitosan is not soluble in water, but the repeatability of amine groups in its structure enable it to be dissolved in dilute acids. In acidic condition, the amine groups can easily be protonated and become positively charged. Researchers have been using chitosan for hemodialysis membranes due to its ability to form a thin film. However, the positively charged surface of chitosan will cause the disturbance of plasma proteins circulation, which in turn will cause protein adsorption on the surface of the membrane. Hence, it is necessary to modify the surface of chitosan prior to using it as a hemodialysis membrane [3-4].
One of the strategies that can be employed to increase the uniformity of pore size distribution as well as biocompatibility of the membrane is homogeneous blending, by which the equivalent ratio of hydrophobic and hydrophilic groups of the materials can be arranged. An appropriate ratio of hydrophilic and hydrophobic groups on the membrane is necessary to maintain the mechanical properties and biocompatibility of the surface. The ability of hydrophilic group to be connected to water molecules and the hydrophobic group to be connected the surface of the material will reduce the surface tension arising from the contact of a solid material with a solution of system [5]
One of synthetic polymers that can be used for blending with chitosan is PVA (polyvinyl alcohol). PVA is a hydrophilic, elastic, non-toxic, no carcinogenic and biodegradable polymer [6]. The combination between PVA and chitosan can be used as a basic material to prepare hemodialysis membrane [7]. The combination of the two materials aims to neutralize the positive charge of the chitosan as well as increase the hydrophilicity and mechanical properties of the membrane. Improving the biocompatibility of chitosan on blood by grafting PVA on the skeletal structure of chitosan followed by mixing resulted chitosan-PVA composite with PVA [8]. The process was able to produced more biocompatible membranes, as indicated by the reduction of protein adsorption on the membrane surface as well as a higher
mechanical strength of the membrane. When used alone, pure PVA exhibited high level of swelling when converted into a membrane, making it difficult to be used as a membrane without any modification. The high level of swelling might cause a leakage during transport processes through the membrane, thus, it is necessary to modify the material through crosslinking with more selective groups [6]. In addition, crosslinking reaction will also increase membrane rigidity [9] which is more favorable in a membrane. A mixture of PVA/chitosan crosslinked with glutaraldehyde and glyoxal as crosslinkers, demonstrated that the mixture was able to decrease membrane permeability for vitamin B12[10]. The studied of crosslinking reaction of PVA with maleic acid, and obtained that the level of swelling of PVA declines with increasing maleic acid content as crosslinker agent [9].
Our research is aimed to improve the transport ability of PVA, using crosslinking reaction of citric acid with PVA. The OH-group located along the open chain of PVA made this material easy to modify by substituting the hydroxyl group with other groups according to particular purposes [7] in this case for hemodialysis membranes. The crosslinking reaction of PVA with citric acid is done in order to incorporate the reactive -COOH groups of citric acid to the backbone chain of PVA. The substitution is expected to increase the active sites on the surface of PVA membrane, through which creatinine and urea can be transported via hydrogen bonds formation.
Next, to improve the mechanical properties as well decrease the hydrophilicity of PVA crosslinked with citric acid, the composite was mixed with the more hydrophobic chitosan. The appropriate ratio of the hydrophilic groups and the hydrophobic groups is expected help produce a membrane with high mechanical strength and flexibility. In this study, the relationship between the hydrophilicity of the membrane with the ability to transport urea and creatinine was also studied.
EXPERIMENTAL SECTION
Materials
Table 1.Composition of PVA crosslinked citric acid
Type of materials PVA (g) Citric acid (g) Mol PVA Mol citric acid
CA1 0.375 0.0235 70 1
CA2 0.375 0.0182 90 1
CA3 0.375 0.0136 120 1
CA4 0.375 0.0109 150 1
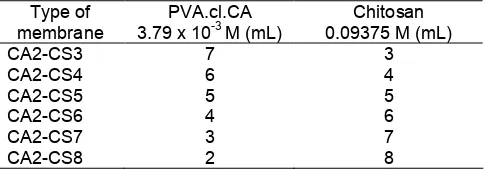
Table 2. Amounts of PVA.cl.CA and Chitosan for membranes prepared with different proportion volume ratio
The membrane instrument used for the transport consisted of two cylindrical chambers glass clamped together with the membrane held between them. The effective volume of each chamber was 50 mL and the effective diameter of the membrane was 2.5 cm. The phyicochemical characterization of the done using FTIR spectrometry. A thermogravimetric analyzer (Perkin Elmer) was used to measure the thermal weight loss of the membrane at the temperature range of 30–900 °C with heating rate of 5 °C/min under nitrogen stream. Membrane surface was characterized using scanning electron microscopy (SEM) Shimadzu U8000. Prior to analysis, samples were coated with platinum using Magnetron sputter coating equipment Instruments (Shimadzu). The Analytical balance, UV-spectrophotometer (772-Spectrophotometer) and pH meter (HM-30R) were used for measurements of sample.
Procedure
Synthesis of PVA crosslinked with citric acid (PVA.cl.CA)
PVA.cl.CA with four different compositions was prepared by first dissolving 0.375 g of PVA powder (g) in 20 mL distilled water. Afterwards, different amounts of citric acid were added with constant stirring for 2 h at 80 °C to reach the desired mole ratio (see Table 1). While stirring, 10 mL of 5% acid solution was also added. The resulted materials were then analyzed using FTIR for functional groups analysis.
Preparation of PVA.cl.CA membrane
The membrane was prepared by mixing a constant amount of chitosan (5 mL) with PVA.cl.CA obtained in
2.2. The mixture was stirred for 20 h and dried in an oven at 60 °C. Afterwards, 1M NaOH was added to help remove the membrane from Petri dish. The membrane was then washed with distilled water until neutral, after which it was air dried. Later, it was used for creatinine transport experiment. The optimum mole ratio of PVA and citric acid is obtained from the membrane that exhibits the highest % creatinine transport
Determination of the appropriate ratio of chitosan and PVA.cl.CA
The determination of appropriate ratio of hydrophilic group (PVA.cl.CA):hydrophobic (chitosan) was conducted using the optimum ratio of PVA and citric acid obtained in 2.3. Membranes were prepared using the composition in Table 2. The membranes generated were used to transport creatinine. The optimum ratio of chitosan:PVA.cl.CA is the membrane exhibiting the highest % creatinine transport.
Preparation of chitosan and PVA.cl.CA blend membrane thickness variation
Using the optimum composition from 2.4, membranes with different thickness were prepared using a composition shown in Table 3. Three different thicknesses were used and each is coded as T200, T100 and T50, respectively.
Swelling Test
Dried membranes with different compositions as prepared using method 2.2–2.4 were weighed, then soaked in phosphate buffer for 6 h. The membranes were taken out every 1 h interval and weighed. The membrane swelling percentage was calculated using the following formula:
wherewwand wdare the weight of hydrated and dried membranes, respectively.
Transport Test
HOOC C
Fig 1.The structure of intermolecular cross-linked PVA with citric acid
transport tests were carried out for 6 h, with samples from acceptor phase taken out every 1 h for analysis using UV-visible spectrophotometer.
Study of membrane transport capacity for urea, creatinine and vitamin B12
Transport process experiments were done by using the following metabolites: urea 500 ppm, creatinine 15 ppm, and vitamin B12 20 ppm in 50 mL dissolved phosphate buffer solution in the source phase and 50 mL phosphate buffer only in the acceptor phase. Each compartment is equipped with magnetic stirrer. Solute permeability in passing through the membrane was determined by analyzing the concentrations of each solute in the acceptor phase with a UV-Vis spectrophotometer at 0–6 h intervals. For the purpose of analysis, urea was initially complexed with 4-dimetilaminbenzaldehida (4-DAB) in acidic condition, and the absorbance was measured at 425 nm. Creatinine was measured at 486 nm picric acid-NaOH as complexing agents. The pink vitamin B12solution was measured at 361 nm without using any complexing agent.
Membrane thickness analysis
Dried membranes were soaked with 10 mL of phosphate buffer solution to allow it to inflate in proportion to the size of the membrane used in the transport process. Afterwards, the membranes were measured for their thickness on three different spots to obtain the average thickness of the membrane.
Characterizations
The membranes were characterized using different methods. Membrane surface was characterized using scanning electron microscopy (SEM) Shimadzu U8000. Prior to analysis, samples were coated with platinum using Magnetron sputter coating equipment Instruments (Shimadzu). Meanwhile, the analysis of the membrane pore size distribution was done using Surface Area
Analyzer. A thermogravimetric analyzer (Perkin Elmer) was used to measure the thermal weight loss of the membrane at the temperature range of 30–900 °C with heating rate of 5 °C/min under nitrogen stream. The weight losses at different stages were recorded and analyzed. The tensile strength of the membranes was measured using a Shimadzu testing machine AG-I-250 KN, using membrane size of 1 cm x 10 cm.
RESULT AND DISCUSSION
Synthesis and Characterization of PVA Crosslinked with Citric Acid (PVA.cl.CA)
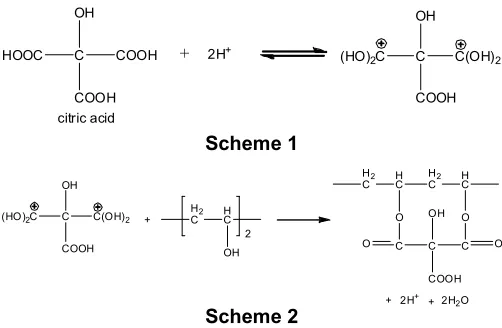
Cross-linking reaction was done using acid catalyst to facilitate the proton transfer process to the citric acid molecules, and was carried was carried out at 80 °C to accelerate the process. The mechanism of cross-linking reaction of PVA with citric acid can be explained through a two-stage reaction: 1) citric acid molecule is protonated due to acidic condition from acetic acid (Scheme 1); 2) –OH groups from PVA is then bound to the protonated citric acid (Scheme 2).
Fig 2.FTIR spectra of materials
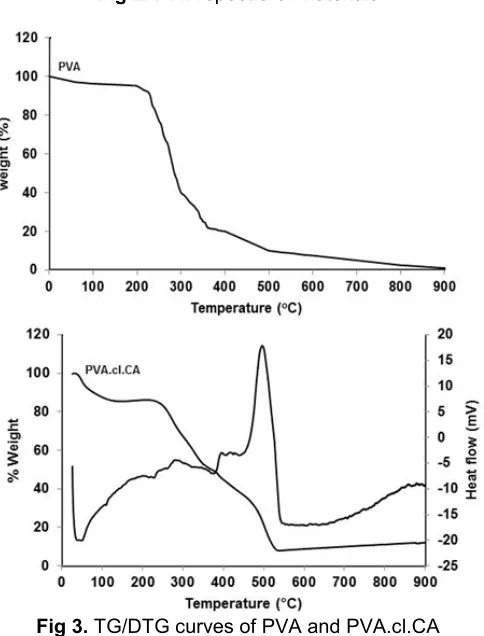
Fig 3.TG/DTG curves of PVA and PVA.cl.CA
Although the structure of citric acid crosslinked PVA is described as intramolecular crosslinking, it is also possible for intermolecular crosslinking to occur. Such structure is formed when two chains of PVA is crosslinked with citric acid, as can be seen in Fig. 1.
FT-IR Spectra Analysis
FT-IR was used to characterize the functional groups of PVA, citric acid as well as PVA.cl.CA, and the IR spectra can be seen in Fig. 2. PVA spectra showed a broad band at 3400 cm-1, indicating the presence of O-H groups, while an absorption band at 1110 cm-1 can be
attributed to the vibration of C-O in the vinyl acetate groups. Citric acid spectra showed a wide absorption band in the region 2900 to 3400 cm-1, which can be attributed to stretching vibration of O-H from of the carboxylic group. The band ranged from 1689 to 1759 cm-1is typical absorption band of carbonyl (C=O) of carboxylic group. The spectra of PVA.cl.CA showed a broader band at 3400 cm-1. The higher intensity of this band might be attributed to the presence of O-H, both from the carboxylic group of citric acid, and -OH groups of PVA. The absorption at 1087 and 1234 cm-1 which were absent in both PVA and citric acid spectra, might be ascribed to C-O ester groups, indicating the crosslinking between citric acid and PVA chains, as seen in Fig. 2. Meanwhile, absorption band at 1658 cm-1in PVA.cl.CA spectra indicated the decrease of carbonyl groups after crosslinking, as exhibited by the smaller intensity of the absorption band.
TG/DTG Analysis of the Membranes
Thermograms from TGA and DTG analysis of PVA and PVA.cl.CA are shown in Fig. 3. Thermogravimetry was conducted at temperatures between 30–900 °C at a heating rate of 5 °C min-1. As can be seen in Fig. 3(A), there is a slight weight loss (approximately 5%) between 30–150 °C, which can be associated to the evaporation of water due to hygroscopic hydroxyl groups. The second decline occurred at temperatures between 225–325 °C, associated with heat-related degradation of PVA molecules. Meanwhile, form Fig. 3(B), it can be seen that there is a weight loss at the temperature between 30-250 °C (16.32%), which is much larger than that of PVA, indicating a much heavier mass of water associated with hydroxyl group. The second weight loss occurred between 250–500 °C, which can also be attributed to heat-related degradation of the molecule. Both data show that the citric acid crosslinked PVA has a higher thermal stability than pure PVA, as indicated from the higher temperature range for the weight loss associated both the release of water as well as and heat-related degradation processes.
Determination of Optimum Membrane
Fig 4.The relationship between % transportt vs. contact time for PVA–citric acid mixture with different mol ratio
Fig 5. Creatinine permeated percentage for membranes with different mole ratio of chitosan:PVA.cl.CA, measured at different transport time (2, 4, and 6 h)
Table 3. Composition of membrane for different thickness
Type of membrane
Chitosan 0.0975 M (mL)
PVA.cl.CA 3.79 x 10⁻³M (mL)
Acetic acid (mL)
T50 2 3 5
T100 4 6 0
T200 8 12 0
Table 4. Swelling percentage and creatinine permeated percentage for CA2 membrane with different proportion volume of PVA.cl.CA:Chitosan
Type of membrane % Swelling % Creatinine permeated
CA2-CS8 116.85 19.81
CA2-CS7 127.07 22.52
CA2-CS6 12731 22.84
CA2-CS4 136.67 24.26
CA2-CS3 142.11 23.02
it can be assumed that if the membrane is able to perform permeation of creatinine, the membrane will also be able to be used for the permeation of urea. From Fig. 4, it can be seen that the highest creatinine permeation was obtained for CA2 membrane (18:16%). Thus the best mole ratio of citric acid to PVA occurs at a ratio of 1:90.
After getting mole ratio between PVA with citric acid, the next step is setting the balance ratio of hydrophilic to hydrophobic group forces the material through the mixing between PVA.cl.CA with chitosan. The right blend of hydrophilic groups with hydrophobic membrane will result in a certain hydrophilicity values with optimum performance. The range of values appropriate hydrophilicity, membrane can work optimally in the transport process. Hydrophilicity of the membrane plays a role in determining the permeation rates of the membrane permeate. When hydrophilicity achieves the right composition, the membrane expands according to the optimal water content capacity. Water content
contained in the membrane transport process is a means to permeate through the membrane. The determination of the optimum equivalent ratio of chitosan with citric acid crosslinked PVA was carried out by using the membranes for creatinine transport and for swelling percentage. As can be seen from Table 2, the membranes were prepared with different mole ratio of the starting materials. The results are given in Fig. 5.
From Fig. 5, it can be seen that the longer the transport time, the higher the transport percentage. Furthermore, the transport percentage tends to increase with increasing amount of PVA.cl.CA in the membrane. And can be seen from Table 4, that the greater the content PVA.cl.CA in blended membranes will increase the ability swelling of membrane. In other words, the increased content of PVA.cl.CA in membrane continued to increase the hydrophilicity of the membrane and it is also correlated with an increase in creatinine transport capability. This might be due to the fact that the addition of PVA to chitosan membranes is able to improve the membrane hydrophilicity. It can also be seen from Fig. 5 that the membrane with the most optimum composition is membrane CA2CS4 (PVA.cl.CA:Chitosan of to 6:4), as indicated by the highest percentage of transport percentage of the membrane.
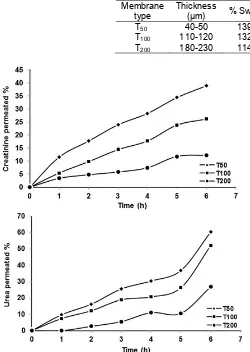
Table 5.Swelling percentage for CA2-CS4 membrane with different thickness
Membrane type
Thickness
(μm) % Swelling % Creatininepermeated
% Urea permeated
T50 40-50 139.61 38.93 60.36
T100 110-120 132.71 26.18 52.03
T200 180-230 114.78 12.31 26.80
Fig 6. Creatinine and urea permeated percentage for membranes with different thickness, measured at different transport time
Fig 7. Permeated percentage of three different metabolites: urea, creatinine and vitamin B12, measured at different transport time
permeability in line with membrane hydrophilicity also increased [6]. This is due to the fact that membrane
hydrophilicity increased with the addition of PEO molecules to the chitosan membrane.
Effect of Membrane Thickness against Creatinine and Urea Transport
Creatinine and urea transport using membrane with different thickness (Table 3) was performed for 6 h transport time. The result of creatinine and urea transport on three membranes with different thickness is shown Fig. 6. It can be seen from the figure that the longer transport time, the higher the creatinine transport percentage. This is due to increasing contact time between the membranes with creatinine solution. The highest transport capacity was obtained for membrane T50, having transport percentage of 38.93%. In line with the data for creatinine transport, urea transport percentage is higher with increasing transport time, and the highest transport percentage was 60.36%, which is achieved by T50 membrane. Fig. 6 also show that not only T50 has the highest transport percentage for urea and creatinine, the membrane also exhibited the highest swelling percentage compared to the other membranes, as can be seen in Table 5.
It was also obtained that the transport percentage for urea is higher than that of creatinine. This can be attributed to the fact that urea (M=60 g/mol) has a smaller molecular weight than creatinine (M=113 g/mol), which also means smaller molecular size. It is therefore understandable that urea molecules can penetrate the pores of the membrane and then transported by the active groups of the membrane.
The Effects of Vitamin B12 on the Transport of
Creatinine and Urea
The effects of vitamin B12on creatinine and urea transport were studied by combining the three species in the source phase. The transport of the three species mixture was done for 6 h using a membrane T50, and the results can be seen in Fig. 7.
Fig 8.SEM images of PVA.cl.CA membrane (A, B) before used; and (C, D) after used for vitamin B12transport
creatinine were transported individually. The transport percentage of creatinine decreased from 38.93% to 33.52%, while transport percentage of urea decreased from 60.36% to 40.06%. When mixed together, the much large molecular size of vitamin B12 seems to have a significant influence on the transport percentage of the other two metabolites. In addition, Fig. 8 also shows that there did not seem to be any transport of vitamin B12 through the membrane, as pointed out by the almost zero absorbance of vitamin B12at 360 nm during UV-Vis analysis. It seems that the molecular size of vitamin B12 is too large to pass through the membrane pores.
Additionally, the presence of vitamin B12 in the source phase also reduces the percentage of creatinine and urea transport. With very large molecular size, vitamin B12might hinder creatinine and urea to enter the membrane pores [13-14]. The competition of the three metabolites to approach the membrane surface may also cause additional collision between the molecules, so that it is difficult for creatinine and urea to enter the membrane pores which lead to so longer transport time. The presence of vitamin B12 that covers the pores might also be one of the reasons for the decline in the transport percentage for both creatinine and urea, as the molecules were able to block urea and creatinine from passing through the membranes. This result is supported with the SEM image shown in Fig. 8.
SEM images
SEM images of PVA.cl.CA/chitosan membrane before and after the transport of urea, creatinine as well
as the three metabolites (urea, creatinine and vitamin B12) are shown in Fig. 8. It can be see from Fig. 8 that prior to use, the membranes look smooth and porous. However, after being used for the transport of 3 species, the membrane surface became more rugged and compact, with small flocks covering the pores. While it is not clear in this research whether the flocks on the surface are vitamin B12 adsorbed on the membrane surface, it is evidence that the changes of the membrane surface considerably decreased the transport percentage of both urea and creatinine.
CONCLUSION
REFERENCES
1. Vanholder, R., 1992,Clin. Mater., 10, 87–133. 2. Deppisch, R., Storr, M., Buck, R., and Gӧhl, H.,
1998,Sep. Purif. Technol.,14, 1-3, 241–254.
3. Morti, S., Shao, J., and Zydney, A.L., 2003, J. Membr. Sci., 224, 1-2, 39–49.
4. Zhang, Y., Zhu, P.C., and Edgren, D., 2010, J. Polym. Res., 17, 5, 725–730.
5. Wang, Y-X., Robertson, J.L., Spillman, W.B., and Claus, R.O., 2004,Pharm. Res., 21, 8, 1362–1373. 6. Abdel-Mohsen, A.M., Aly, A.S., Hrdina, R.,
Montaser, A.S. and Hebeish, A., 2011, J. Polym. Environ., 20, 1, 104–116.
7. Barzin J., Madaeni S.S., and Pourmoghadasi S., 2006,J. Appl. Polym. Sci., 104, 4, 2490–2497.
8. Don, T-M.,King, C-F., Chiu, W-Y., and Peng, C-A., 2005,Carbohydr. Polym., 63, 3, 331–339.
9. Gohil, J.M., Bhattacharya, A., and Ray, P., 2006,J. Polym. Res., 13, 2, 161–169.
10. Nakatsuka, S., and Andrady, A.L., 1992, J. Appl. Polym. Sci., 44, 1, 17–28.
11. Costa-Júnior, E.S., Barbosa-Stancioli, E.F., Mansur, A.A.P., Vasconcelos, W.L., and Mansur, H.S., 2009,Carbohydr. Polym., 76, 3, 472–481. 12. Radhakumary, C., Nair, P.D., Nair, C.P.R., and
Mathew, S., 2012, J. Appl. Polym. Sci., 125, 3, 2022–2033.
13. Saljoughi, E., Amirilargani, M., and Mohammadi, T., 2011,J. Appl. Polym. Sci., 116, 4, 2251–2259. 14. Su, B-H., Shi, Y., Fu, P., Tao, Y., Nie, S., and