Summary Because of difficulties in directly assessing root responses of mature forest trees exposed to atmospheric pol-lutants, we have used the model TREGRO to analyze the effects of a 3- and a 10-year exposure to ozone (O3) on root dynamics of a simulated 160-year-old sugar maple (Acer saccharum Marsh.) tree. We used existing phenological, allometric, and growth data to parameterize TREGRO to produce a simulated 160-year-old tree. Simulations were based on literature values for sugar maple fine root production and senescence and the photosynthetic responses of sugar maple seedlings exposed to O3 in open-top chambers.
In the simulated 3-year exposure to O3, 2 × ambient atmos-pheric O3 concentrations reduced net carbon (C) gain of the 160-year-old tree. This reduction occurred in the C storage pools (total nonstructural carbohydrate, TNC), with most of the reduction occurring in coarse (woody) roots. Total fine root production and senescence were unaffected by the simulated 3-year exposure to O3. However, extending the simulated O3 exposure period to 10 years depleted the TNC pools of the coarse roots and reduced total fine root production. Similar reductions in TNC pools have been observed in forest-grown sugar maple trees exhibiting symptoms of stress. We conclude that modeling can aid in evaluating the belowground response of mature forest trees to atmospheric pollution stress and could indicate the potential for gradual deterioration of tree health under conditions of long-term stress, a situation similar to that underlying the decline of sugar maple trees.
Keywords: coarse roots, demographics, fine roots, senescence, total nonstructural carbohydrates.
Introduction
Since the early 1980s, some sugar maple stands in the northern hardwood forest of the northeastern United States (Allen et al. 1992) have shown signs of severe dieback and decline (Renaud and Mauffette 1991). Several mechanisms, including air pol-lution stress, have been implicated as causal agents of the decline. Under experimental conditions, air pollution stress is capable of producing similar dieback symptoms, and in par-ticular, it causes reductions in root mass of trees (Retzlaff et al.
1992). Because the reduction in root mass may be the initial damage that causes failure of other biotic systems leading to decline, we hypothesized that ozone (O3) exposure alters root dynamics in mature sugar maple trees.
In eastern North America, low concentrations of tropo-spheric O3 occur frequently over a wide area (National Acad-emy of Sciences 1977). Several studies (Reich et al. 1986, Noble et al. 1992, Laurence et al. 1993) have attempted to quantify the response of sugar maple to increased concentra-tions of tropospheric O3 pollution; however, most of these studies have focused on the response of aboveground tissue or organs.
Fine roots are important, dynamic components of northern hardwood ecosystems (Hendrick and Pregitzer 1993b), but because of the difficulties associated with studying fine roots, many aspects of fine root production and mortality are poorly understood (Hendrick and Pregitzer 1993b). Fine root produc-tion and senescence have been estimated from sequential sam-pling of live root mass, which renders the samsam-pling unit useless for additional study. Recent advances in minirhizotron tech-nology have permitted in situ estimates of fine root production and turnover in these ecosystems (Hendrick and Pregitzer 1992, 1993a, 1993b, Fahey 1994).
We hypothesized that simulation models are an effective tool for assessing the potential consequences of air pollution exposure on root dynamics of mature forest trees. To test this hypothesis we used the model TREGRO, developed and de-scribed by Weinstein et al. (1991), to assess the belowground tissue responses of a simulated mature sugar maple tree with and without O3 exposure.
Materials and methods
Description of TREGRO
TREGRO is a physiological simulation model of the carbon (C), water, and nutrient fluxes of an individual tree. In the model, the tree is divided into compartments: a canopy of leaves grouped by age class, branches, stem, and coarse and fine roots in three soil horizons. In each of these compartments, the model tracks three C pools: structure (living, respiring
Simulated root dynamics of a 160-year-old sugar maple (
Acer
saccharum
Marsh.) tree with and without ozone exposure using the
TREGRO model
W. A. RETZLAFF, D. A. WEINSTEIN, J. A. LAURENCE and B. GOLLANDS
Boyce Thompson Institute for Plant Research, Tower Road, Ithaca, NY 14853-1801, USA
Received October 25, 1995
tissue); wood (non-respiring tissue); and total nonstructural carbohydrate (TNC). The model calculates the C assimilation of the entire tree each hour as a function of ambient environ-mental conditions using the Farquhar equations (Farquhar et al. 1980). Carbon is redistributed daily within the plant for growth, storage, respiration, and senescence, depending on the distance between source and sink and the relative sink strength.
Parameterization of TREGRO
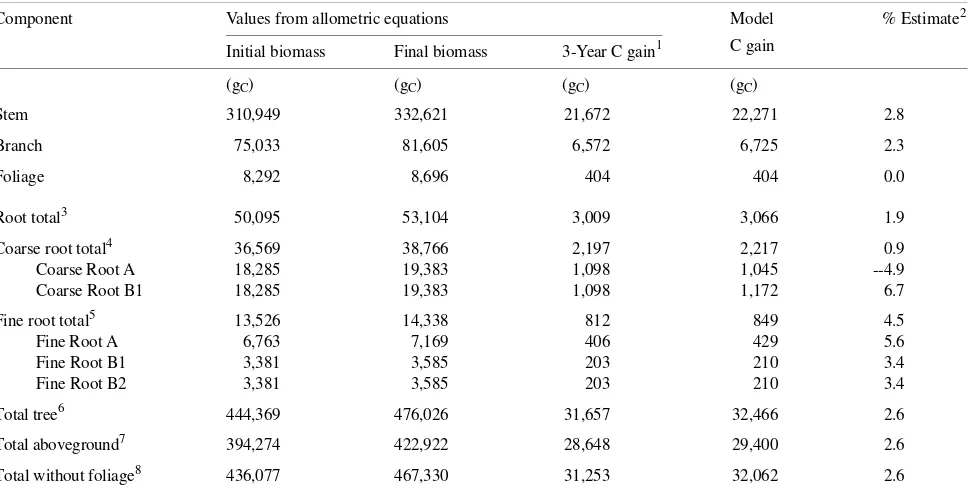
We set the initial biomass of the simulated sugar maple tree, including C partitioning among components, in the TREGRO model. The simulation target was to grow a sugar maple tree with three annual dbh (diameter at breast height) increments of approximately 0.33 cm year−1. Utilizing dbh-based allometric relationships, the biomass (in g of C, gC) of the base tree (32 cm dbh) and a target tree (33 cm dbh) were estimated (Table 1).
Initial tree biomass
Initial biomass of the sugar maple tree was based on the dbh (32 cm) of dominant and codominant sugar maple trees meas-ured by Fielding (1916) in Franklin and St. Lawrence Coun-ties, NY. Trees of this dbh typically exhibit diameter growth of 2.8 to 3.6 cm in 10 years (Fielding 1916, Godman 1965, Godman et al. 1990) and are approximately 150--160 years old
(Fielding 1916, Godman et al. 1990) with a height of 20 m (Fielding 1916) and a mean crown radius of 3.2--3.6 m (Tucker 1990). Height growth ceases or becomes negligible at this age (Godman et al. 1990).
Initial biomass of individual tree components (foliage, branch, stem, and coarse and fine root) was calculated using dbh-based allometric equations derived from sugar maple trees growing in Ontario, Canada (belowground components) and the Great Lakes Region of the USA (aboveground compo-nents) (Morrison 1990, Burton et al. 1991, Chapman and Gower 1991). Leaf area was also calculated using dbh-based allometric equations (Burton et al. 1991, Chapman and Gower 1991). Coarse root biomass was split equally between two soil horizons, A and B1. Fifty percent of fine root (defined here as roots < 2.0 mm diameter (Hendrick and Pregitzer 1993b)) biomass was allocated to soil horizon A and 25% to each of soil horizons B1 and B2. Tree biomass in each component was further partitioned into TNC, structure, and wood. The propor-tion of wood biomass (14%) in the initial tree’s stem, branches, and coarse (woody) roots was set to that determined by Chap-man and Gower (1991). The remainder of the initial biomass was split between TNC and structure. Total nonstructural car-bohydrate represented 30% of structure in the stem, branch, and coarse roots and 20% of structure in the foliage; these
Table 1. Initial and final biomass and 3-year C gain values (gC, where mass = 2 × gC) from literature allometric data and the resulting TREGRO
modeled 3-year C gain and the percent estimate for a simulated 157--160-year-old sugar maple tree.
Component Values from allometric equations Model % Estimate2
C gain Initial biomass Final biomass 3-Year C gain1
(gC) (gC) (gC) (gC)
Stem 310,949 332,621 21,672 22,271 2.8
Branch 75,033 81,605 6,572 6,725 2.3
Foliage 8,292 8,696 404 404 0.0
Root total3 50,095 53,104 3,009 3,066 1.9
Coarse root total4 36,569 38,766 2,197 2,217 0.9
Coarse Root A 18,285 19,383 1,098 1,045 --4.9
Coarse Root B1 18,285 19,383 1,098 1,172 6.7
Fine root total5 13,526 14,338 812 849 4.5
Fine Root A 6,763 7,169 406 429 5.6
Fine Root B1 3,381 3,585 203 210 3.4
Fine Root B2 3,381 3,585 203 210 3.4
Total tree6 444,369 476,026 31,657 32,466 2.6
Total aboveground7 394,274 422,922 28,648 29,400 2.6
Total without foliage8 436,077 467,330 31,253 32,062 2.6
1 3-Year C gain = Final biomass -- Initial biomass.
2 % Estimate = ((Model C gain -- 3-year Allometric C gain)/(3-Year Allometric C gain))100. 3 Root total = Coarse root total + Fine root total.
4
Coarse root total = Coarse Root A + Coarse Root B1.
5 Fine root total = Fine Root A + Fine Root B1 + Fine Root B2. 6 Total tree = Stem + Branch + Foliage + Root total.
7 Total aboveground = Stem + Branch + Foliage total. 8
values were based on reported TNC concentrations in coarse roots (Wargo 1971, 1975, Renaud and Mauffette 1991, Kolb et al. 1992), stem (Kolb et al. 1992), and foliage (M.A. Topa, Boyce Thompson Institute for Plant Research, Ithaca, NY, pers. comm.) of sugar maple trees.
Soil parameters
Because there are no competition effects for space in TRE-GRO, the soil rooting area (40.72 m2) was set to equal that of the projected crown area, assuming a crown radius of 3.6 m (Tucker 1990) and a uniform circular shaped crown. We recog-nize that, in a forest stand, the roots of many species would be intermingled beneath the canopy, but the rooting area of a particular tree would not exceed the crown area in a closed canopy, assuming that similar sized trees have similar sized root areas. If a tree has roots growing beyond the radius of its canopy, it is likely that another tree is using a similar area beneath the first tree canopy. Further, Tubbs (1977) found that sugar maple roots usually terminated within a few feet of the crown perimeter. Depths of the A, B1, and B2 soil horizons were set to 0.118, 0.232, and 0.303 m, respectively, based on measured soil depths in three old-growth sugar maple stands (Frelich et al. 1989). Soil water and nutrient conditions were set to be non-limiting in all of the simulations.
Seasonal phenology
Sugar maple trees produce a single cohort of foliage per year, with foliage bud break and flush generally occurring in the first half of May (Brundett and Kendrick 1988, Kolb and Teulon 1992, Kolb et al. 1992). Height and radial growth begin soon after foliage bud break and continue for approximately 15--17 weeks, until the end of August (Godman et al. 1990). Root growth occurs from spring to fall when conditions are favor-able (Brundett and Kendrick 1988). Fine root production and turnover occur simultaneously throughout the growing season and overwinter production is low (Hendrick and Pregitzer 1992, 1993b). Foliage senescence occurs late in the season with leaf fall occurring in mid-October (Reich et al. 1991). TREGRO parameters were set to reproduce these phenological events during the simulation. Ithaca, NY weather data from 1988 was used to convert the approximate calendar dates to heat degree-day (days above 0 °C summed from day of year (DOY) 1 to 365) values used to parameterize the model. The same meteorological data set was used for all the TREGRO model simulations.
Carbon assimilation
Net C assimilation (g of C per g of leaf C per h, gC glC--1 h--1) during a high irradiance (1000 µmol m−2 s−1; 25--30 °C), midsummer 11-day period (DOY 200--210) was set to be approximately 0.0075 gC glC--1 h--1 (cf. Ledig and Korbobo 1983, Bahari et al. 1985). Leaf respiration was set at 17% of net C assimilation (cf. Walters et al. 1993).
The final TREGRO simulated tree was calibrated by adjust-ing tissue growth rates and fine root senescence rates until two conditions were met: (1) the simulated C gain of each of the tree components, foliage, branch, stem, and coarse and fine
roots, and the total tree C gain were within 10% of the value for projected C gain from the literature-based allometric rela-tionships; and (2) the proportion of TNC, structure, and wood in each of the tree components at the end of a simulation matched that parameterized for the tree at the beginning of the simulation (Table 1). Fine root senescence was set to approxi-mate one complete root turnover per year based on field meas-urements (Hendrick and Pregitzer 1992, 1993a, 1993b, Fahey 1994).
Ozone simulation
In TREGRO, effects of O3 are simulated as a cumulative effect of the pollutant on the maximum rate of carboxylation, Vmax. The magnitude of the O3 effect is controlled by a threshold below which there is no effect, and a linear relationship be-tween cumulative uptake of O3 and decreasing C assimilation. Although O3 does not accumulate in the leaf tissue, the effect of cumulative O3 uptake is proportional to the product of the hourly O3 concentration multiplied by the O3 conductance. There are conflicting reports of O3-induced reductions in foli-age C assimilation of sugar maple seedlings grown under greenhouse or growth chamber conditions (highly significant reductions, Reich et al. 1986, Noble et al. 1992) and in open-top chambers (no significant reductions, Laurence et al. 1993). The location of the experiment, the O3 exposure regimes, or the genetic composition of the plant materials may explain these contradictory results. Significant O3-induced reductions in C assimilation by seedlings in greenhouse and growth cham-ber studies probably do not reflect the C assimilation response in a field-grown tree. Laurence et al. (1993), in a highly replicated open-top chamber study, observed a 12% reduction in net C assimilation between field-grown sugar maple seed-lings in 2 × ambient O3 and those in 0.5 × ambient O3 that was not significant because of high variability. Furthermore, the 2× ambient O3 treatment did not cause a reduction in seedling growth or biomass development.
To evaluate the effect of the maximum response possible, we assumed that the maximum rate of carboxylation, Vmax, began decreasing as soon as O3 uptake occurred in the leaves (i.e., the O3 threshold was zero). Because the total amount of cumula-tive O3 uptake increased during the growing season, we as-sumed that there was a proportional decrease in Vmax for each additional gram of O3 (gO3) taken up by the leaves. The slope
of the response was set to match the maximum reduction observed in open-top chambers by Laurence et al. (1993) (i.e., the instantaneous net C assimilation would be reduced by 12% when the cumulative O3 dose reached 2 × ambient O3 concen-tration, which is equivalent to a total cumulative O3 uptake of 0.0252 gO3 glC
−1). Based on this O
Results and discussion
Matching root parameters to reported values
We tried to match root and other tissue parameters in the base (no O3) TREGRO sugar maple tree with those reported in the literature for phenology, TNC content, production, and senes-cence. In the base tree, we were able to reproduce all of the expected tissue growth rates and patterns (Figure 1). For in-stance, sugar maple root growth is reported to occur from spring to fall (Brundett and Kendrick 1988), with fine root production and turnover occurring simultaneously throughout the growing season and production continuing more slowly over winter (Hendrick and Pregitzer 1992, 1993b). Further, annual fine root production is greater than mortality in a sugar-maple-dominated ecosystem (Hendrick and Pregitzer 1992, 1993b). By setting the initial base-tree parameters using this information, we were able to reproduce these demographic patterns accurately with TREGRO (Figure 1).
Our simulated estimate of fine root production was 6.94 MgDW (dry weight) ha−1 year−1, which approximates the value of 7.30 MgDW ha−1 year−1 reported by Hendrick and Pregitzer (1993b) for a sugar-maple-dominated northern ecosystem. Fine root production (14.13 kgC) of the simulated sugar maple tree was 1.7 and 6.3 times annual foliage (8.42 kgC) and branch (2.25 kgC) production in the first simulation year, respectively. In a sugar-maple-dominated ecosystem, fine root production was roughly twice as high as foliage production (Hendrick and Pregitzer 1993b, Fahey 1994) and six times higher than branch production (Hendrick and Pregitzer 1993b). Further, 48% of fine root biomass production occurred in our simulated tree by DOY 200, which is similar to the reported value of greater than 50% of annual length production before midsummer in a sugar-maple-dominated ecosystem (Hendrick and Pregitzer 1993b). The seasonal pattern of coarse root TNC of the
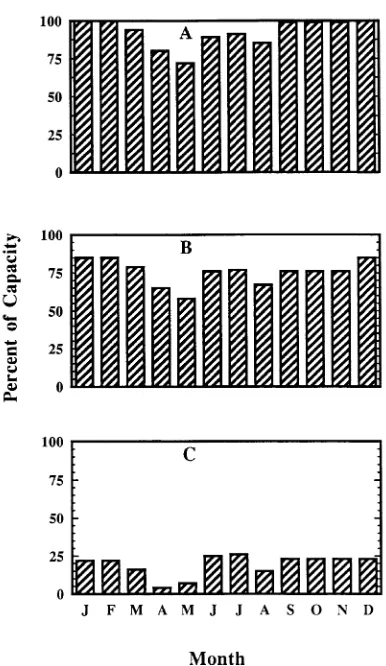
simu-lated tree closely matched that reported by Wargo (1979) (Figure 2A). Given the similarity between our simulated tree and the literature values, we conclude that the allometry and other parameters (including the meteorological data) used in the simulation typify a mature sugar maple tree and its envi-ronment.
Our simulated estimate of fine root senescence was 6.80 MgDW ha−1 year−1, which is close to the value of 6.70 MgDW ha−1 year−1 reported for a sugar-maple-dominated ecosystem at 43° N (Hendrick and Pregitzer 1993b). The close similarity in values is expected because we parameterized the model using the fine root senesence rate from the 43° N ecosystem. Hendrick and Pregitzer (1993a, 1993b) found a lower rate (4.80 MgDW ha−1 year−1) in more northerly latitudes and attrib-uted the difference in their estimates of fine root senescence between the northern and southern sites to the higher soil temperatures at the southern site (80 km south of the northern site), causing accelerated maintenance costs and increased fine root mortality rates. Our mean growing season soil tempera-tures (14.5 °C in our meteorological data set) were similar to the soil temperatures (14.2--14.6 °C) in the sugar maple eco-system at 43° N (Hendrick and Pregitzer 1993b). However, the
Figure 1. Total mass, cumulative growth, and cumulative senescence of fine roots from a three-year TREGRO simulation of a mature sugar maple tree. The data shown represent growth with no O3 exposure.
Data from an O3-exposed simulated tree were identical and are not
shown.
Figure 2. Percent capacity of coarse root TNC pools at the end of each month during the last year of TREGRO simulations of a mature sugar maple tree after three years with no O3 exposure (A) and after O3
fine root senescence rate in TREGRO is not linked to soil temperature (cf. Hendrick and Pregitzer 1993a); it is only dependent on the current mass of fine root tissue.
We were able to parameterize a mature sugar maple tree in TREGRO, simulate growth for a period of three years, and approximate the dynamics of belowground physiological processes that are reported in the literature for individual sugar maple trees and ecosystems. Accurate simulation of the dy-namics of physiological processes with TREGRO permits in-vestigation of the physiological responses of trees to environmental stress.
Ozone simulation
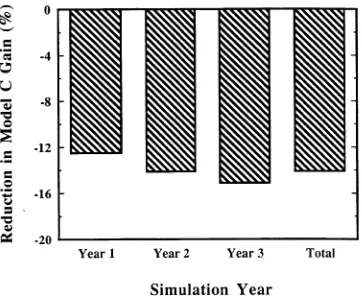
In the simulation, atmospheric O3 concentrations at twice the (1988) Ithaca, NY ambient O3 concentration reduced the net C gain of a 160-year-old simulated tree (Figure 3). The reduction in C gain compared to the unexposed (0.0) tree increases each year and the cumulative total reduction, or the average of the 3-year simulation, was 14%. This reduction occurred in the storage (TNC) pool of the simulated tree, with the majority of the reduction occurring in the coarse (woody) roots (Figures 2A, 2B, and 4). Similar reductions in TNC pools have been observed in forest-grown sugar maple trees exhibiting symp-toms of stress (decline or dieback). Sugar maple trees heavily infested with pear thrips (Taeniothrips inconsequens (Uzel) (Thysanoptera: Thripidae)) had less root TNC when measured in the fall following attack compared with trees with less thrips damage (Kolb et al. 1992). Further, October starch content of stem and root tissues from sugar maple trees with more than 50% crown dieback was lower than that of trees with less than 10% crown dieback (Renaud and Mauffette 1991). Therefore, the subtle response of the simulated sugar maple tree to atmos-pheric O3 stress may accurately reflect the response of forest-grown sugar maple trees to atmospheric O3 pollution.
Cooley and Manning (1987) proposed a conceptual model to describe the effects of O3 on photosynthate partitioning in plants. The model states that, under conditions of low concen-trations of O3 (50--100 ppb), perennial plants divert
photosyn-thate assimilate to leaves at the expense of the roots, whereas at higher O3 concentrations (>100 ppb), partitioning of C to all sinks decreases because of a reduction in photosynthetic pro-duction. Our TREGRO model assumes that under moderate reductions in photosynthesis (such as those produced in re-sponse to 50--100 ppb O3), the C needs of the aboveground tissues will be satisfied first because they are closer to the site of C fixation. The overall effect of this assumption is a simu-lated diversion of assimilate to aboveground tissues at the expense of roots. Consequently, results from our TREGRO O3 simulation (seasonal mean O3 concentration was < 100 ppb) mimic the proposed conceptual model in terms of the availabil-ity of C for the root (TNC) component. However, O3-induced reductions in C gain and coarse root TNC pools did not alter the dynamics of fine root phenology, production, or mortality following the simulated 3-year exposure to O3 (see Figure 1). If greater C reductions had occurred, thereby depriving fine roots of additional C, then phenology, production, and mortal-ity could have been altered. Even though simulated O3 expo-sure reduced the TNC content of the coarse roots after three years (TNC content = 30% of structure when C pools are full at the end of the growing season; TNC content = 17% of capacity following O3 exposure), sufficient reserves remained during the growing season for fine root production (Figures 2B and 4). However, extending the simulated O3 exposure period for an additional seven years (10-year total O3 exposure) re-sulted in depletion of the entire TNC pool in the coarse roots during a portion of the growing season in the last three years of simulation, causing a reduction in fine root production compared to that in the unexposed base tree (Figures 2C and 5). Although TNC depletion was large by the end of the third year and even larger by the end of the tenth year, no change in fine root phenology and senescence occurred.
Because the simulated O3 regime reduced the amount of TNC, but did not reduce the growth or structure of the coarse roots, the TNC remaining at the end of the third and tenth years
Figure 3. Percent reduction in C gain of a mature sugar maple tree exposed to 2 × ambient O3 concentrations during a 3-year TREGRO
model simulation.
of O3 exposure was less than in the unexposed base tree (Figures 2B and 2C). This change in C partitioning agrees with the assumptions of Cooley and Manning (1987) and the results of a study on Pinus ponderosa Laws. seedlings (Tingey et al. 1976). However, contrary results (reduced C allocation, but no changes in C partitioning) have been found in almond (Prunus dulcis (Mill) D.A. Webb syn. P. amygdalus Batsch, cv. Butte and Nonpareil) exposed to increased concentrations of O3 (Retzlaff et al. 1992). Our simulated response and results presented elsewhere (Tingey et al. 1976, Mortenson and Skyre 1990, Retzlaff et al. 1992) indicate that the effect of O3 on partitioning of dry matter will differ depending on the sensitiv-ity of the plant to O3, the effect of C supply relative to demand, and the O3 concentration to which the plants are exposed. Therefore, it is important to have accurate estimates of the biomass and C allocation responses for each species studied or simulated. An understanding of the relative reduction in pho-tosynthesis compared to C demand for growth will permit predictions of when storage TNC reductions will lead to growth declines.
We do not know whether our simulated estimates of below-ground responses accurately reflect the response that would occur in forest-grown trees. However, our results do show that O3 has the potential to contribute to the decline in sugar maple through reductions in coarse root TNC pools. Such reductions have been observed in sugar maple trees exhibiting decline symptoms. We conclude that our simulated O3 response mim-ics a proposed conceptual model and matches the measured results of field studies with other species. It appears that the physiological imbalances observed in declining trees may de-crease the resistance of sugar maple to additional biotic and abiotic stresses (Renaud and Mauffette 1991, Kolb et al. 1992). Based on literature estimates of belowground root phenology, TNC content, production, and mortality, the present modeling effort indicates that long-term exposure to O3 may reduce TNC storage pools in sugar maple coarse roots and ultimately de-crease fine root production. Fine root phenology and
senes-cence were not affected by simulated O3 exposure in this study. Simulation exercises, like the one discussed here, are useful for conducting long-term evaluations that could not be done ex-perimentally. We conclude that modeling can aid in the below-ground evaluation of mature forest tree responses to atmospheric pollution stress (and other physiological stresses) and could indicate the potential for gradual deterioration of tree health (as evidenced by decreased TNC pools) under conditions of extended stress, a situation similar to that under-lying sugar maple decline.
Acknowledgments
This research was conducted as part of research cooperative CR-820759-02 among the USEPA, the Desert Research Institute, and Boyce Thompson Institute for Plant Research. Additional funds were provided by the endowment of Boyce Thompson Institute for Plant Research. This paper has not been subject to USEPA policy review and should not be construed to represent policies of the agency. We thank Drs. T. Fahey, M. A. Topa and R. Yanai for critical manuscript review, and B. Warland for word processing assistance.
References
Allen, D.C., C.J. Barnett, I. Millers and D. LaChance. 1992. Temporal change (1988--1990) in sugar maple health, and factors associated with crown condition. Can. J. For. Res. 22:1776--1784.
Bahari, Z.A., S.G. Pallardy and W.C. Parker. 1985. Photosynthesis, water relations, and drought adaptation in six woody species of oak--hickory forests in central Missouri. For. Sci. 31:557--569. Brundett, M.C. and B. Kendrick. 1988. The mycorrhizal status, root
anatomy, and phenology of plants in a sugar maple forest. Can. J. Bot. 66:1153--1173.
Burton, A.J., K.S. Pregitzer and D.D. Reed. 1991. Leaf area and foliar biomass relationships in northern hardwood forests located along a 800 km acid deposition gradient. For. Sci. 37:1041--1059. Chapman, J.W. and S.T. Gower. 1991. Aboveground production and
canopy dynamics in sugar maple and red oak trees in southwestern Wisconsin. Can. J. For. Res. 21:1533--1543.
Cooley, D.R. and W.J. Manning. 1987. The impact of ozone on assimilate partitioning in plants: a review. Environ. Pollut. 47:95--113. Fahey, T.J. 1994. Fine root dynamics in a northern hardwood forest ecosystem, Hubbard Brook Experimental Forest, NH. J. Ecol. 82:533--548.
Farquhar, G.D., S. von Caemmerer and J.A. Berry. 1980. A biochemi-cal model of photosynthetic CO2 assimilation in leaves of C3
spe-cies. Planta 149:78--90.
Fielding, F.A. 1916. A silvicultural study of the hard maple. MS Thesis, Cornell Univ., 73 p.
Frelich, L.E., J.G. Bockheim and J.E. Leide. 1989. Historical trends in tree-ring growth and chemistry across an air quality gradient in Wisconsin. Can. J. For. Res. 19:113--121.
Godman, R.M. 1965. Sugar maple (Acer saccharum Marsh.). In
Silvics of Forest Trees of the United States. Ed. H.A. Fowells. USDA, Agriculture Handbook 271, Washington, DC, pp 66--73. Godman, R.M., H.W. Yawney and C.H. Tubbs. 1990. Sugar maple
(Acersaccharum Marsh.). In Silvics of North America, Volume 2, Hardwoods. Eds. R.M. Burns and B.H. Honkala. USDA Forest Service, Agriculture Handbook 654, Washington, DC, pp 78--91. Hendrick, R.L. and K.S. Pregitzer. 1992. The demography of fine roots
in a northern hardwood forest. Ecology 73:1094--1104.
Hendrick, R.L. and K.S. Pregitzer. 1993a. Patterns of fine root mortal-ity in two sugar maple forests. Nature 361:59--61.
Hendrick, R.L. and K.S. Pregitzer. 1993b. The dynamics of fine root length, biomass, and nitrogen content in two northern hardwood ecosystems. Can. J. For. Res. 23:2507--2520.
Kolb, T.E., L.H. McCormick, E.E. Simons and D.J. Jeffery. 1992. Impacts of pear thrips damage on root carbohydrate, sap, and crown characteristics of sugar maples in a Pennsylvania sugarbush. For. Sci. 38:381--392.
Kolb, T.E. and D.A.J. Teulon. 1992. Effects of temperature during bud burst on pear thrips damage to sugar maple. Can. J. For. Res. 22:1147--1150.
Laurence, J.A., R.J. Kohut, R.G. Amundson, D.A. Weinstein and T.J. Fahey. 1993. Response of plants to interacting stresses: an evalu-ation of the effects of ozone and acidic precipitevalu-ation on the nutrition, growth, and physiology of red spruce and sugar maple. Final Re-port, Electric Power Research Institute, 3412 Hillview Ave, Palo Alto, CA, 104 p.
Ledig, F.T. and D.R. Korbobo. 1983. Adaptation of sugar maple populations along altitudinal gradients: photosynthesis, respiration, and specific leaf weight. Am. J. Bot. 70:256--265.
Morrison, I.K. 1990. Organic matter and mineral distribution in an old-growth Acersaccharum forest near the northern limit of its range. Can. J. For. Res. 20:1332--1342.
Mortenson, L.M. and O. Skyre. 1990. Effects of low ozone concentra-tions on growth of Betulapubescens Ehrh., Betulaverrucosa Ehrh. and Alnusincana (L.) Moench. New Phytol. 115:165--170. National Academy of Sciences. 1977. Ozone and other photochemical
oxidants. Committee on Medical and Biological Effects of Environ-mental pollutants, Division of Medical Sciences, National Research Council, Washington, DC, 719 p.
Noble, R., K.F. Jensen, B.S. Ruff and K. Loats. 1992. Response of
Acersaccharum seedlings to elevated carbon dioxide and ozone. Ohio J. Sci. 92:60--62.
Reich, P.B., A.W. Schoettle and R.G. Amundson. 1986. Effects of O3
and acidic rain on photosynthesis and growth in sugar maple and northern red oak seedlings. Environ. Pollut. 40:1--15.
Reich, P.B., M.B. Walters and D.S. Ellsworth. 1991. Leaf age and season influence the relationships between leaf nitrogen, leaf mass per area and photosynthesis in maple and oak trees. Plant Cell Environ. 14:251--259.
Renaud, J.-P. and Y. Mauffette. 1991. The relationships of crown dieback with carbohydrate content and growth of sugar maple (Acer saccharum). Can. J. For. Res. 21:1111--1118.
Retzlaff, W.A., T.M. DeJong and L.E. Williams. 1992. Photosynthesis and growth response of almond to increased atmospheric ozone partial pressures. J. Environ. Qual. 21:208--216.
Tingey, D.T., R.G. Wilhour and C. Standley. 1976. The effect of chronic ozone exposures on the metabolite content of ponderosa pine seedlings. For. Sci. 22:234--241.
Tubbs, C.H. 1977. Root-crown relations of young sugar maple and yellow birch. USDA Forest Service North Central Forest Experi-ment Station, Research Note NC-225, 4 p.
Tucker, G.F. 1990. Crown architecture and xylem-borne sucrose pro-duction in stand-grown sugar maple (Acersaccharum Marsh.) of the Adirondack Mountains. Ph.D. Diss., Cornell Univ., 148 p. Walters, M.B., E.L. Kruger and P.B. Reich. 1993. Growth, biomass
distribution and CO2 exchange of northern hardwood seedlings in
high and low light: relationships with successional status and shade tolerance. Oecologia 94:7--16.
Wargo, P.M. 1971. Seasonal changes in carbohydrate levels in roots of sugar maple. USDA Forest Service, Northeastern Forest Experi-ment Station Research Paper NE-213, 8 p.
Wargo, P.M. 1975. Estimating starch content in roots of deciduous trees----a visual technique. USDA Forest Service, Northeastern For-est Experiment Station Research Paper NE-313, 9 p.
Wargo, P.M. 1979. Starch storage and radial growth in woody roots of sugar maple. Can. J. For. Res. 9:49--56.