Michael Darden is an assistant professor of economics at Tulane University. Ian McCarthy is an assistant professor of economics at Emory University. The authors are grateful to Jonathan Skinner, Brian McMa-nus, James Alm, Jonathan Pritchett, Otavio Bartalotti, Mary Olson, and two anonymous referees for helpful comments. The data used in this article can be obtained beginning March 2016 through April 2019 from Michael Darden, 206 Tilton Hall, Tulane University, New Orleans, LA 70118 or mdarden1@tulane.edu.
[Submitted August 2013; accepted May 2014]
ISSN 0022- 166X E- ISSN 1548- 8004 © 2015 by the Board of Regents of the University of Wisconsin System
T H E J O U R N A L O F H U M A N R E S O U R C E S • 50 • 4
Estimating the Impact of Star Ratings on
Medicare Advantage Enrollments
Michael Darden
Ian M. McCarthy
Darden and McCarthyABSTRACT
The Centers for Medicare and Medicaid Services (CMS) has calculated and disseminated an overall contract quality star rating system (from one
to fi ve stars) for all Medicare Advantage (MA) contracts since 2009. In
this paper, we study the effect of CMS- reported star ratings on MA plan enrollment. We formulate a discrete choice demand model for differentiated MA plans and estimate the model with market- level plan enrollment data. We identify separate enrollment effects for each star level using a regression discontinuity research design that exploits plausibly random variation around star thresholds. The results suggest that the 2009 published star
ratings directed benefi ciaries away from low- rated plans more than actively
toward high- rated plans. When we repeat the analysis for 2010 published
quality stars, we fi nd no signifi cant effects. We present suggestive evidence
that supply- side responses to the star rating system may explain the one- time enrollment response to CMS- published quality stars.
I. Introduction
Since the Medicare Modernization Act of 2003, the role of Medicare Advantage (MA) plans in the provision of health insurance to Medicare benefi ciaries has grown substantially. From 2003 to 2012, the share of Medicare- eligible individuals in a MA health plan increased from 13.7 percent to 27 percent.1 Alongside the increas-ing role of MA plans, the Centers for Medicare and Medicaid Services (CMS) has
undergone a signifi cant effort to better inform the Medicare population of MA quality. In 2007, CMS introduced a fi ve- star rating system that provided a rating of one to fi ve stars to each MA contract—a private organization that administers potentially many differentiated plans—in each of fi ve quality domains.2 In 2009, CMS began aggregat-ing the domain- level quality scores into an overall star rataggregat-ing for each MA contract that was made available to benefi ciaries via the Medicare Plan Finder website and 1- 800- MEDICARE. Finally, beginning in the 2012 enrollment period, contracts were incentivized to receive a high rating through rating- dependent reimbursement and bo-nus schemes. Given the substantial efforts involved in calculating and disseminating the star ratings, the new incentives on plans to achieve a high rating, and the growing role of the MA program in the provision of health insurance to Medicare benefi ciaries, understanding the impact of star ratings on MA enrollment is critical to future Medi-care policy.
While disseminating quality information theoretically may improve market out-comes (Akerlof 1970), surprisingly few studies have empirically examined the impact of publicly available quality measures on Medicare health plan choice. A recent ex-ception is Reid et al. (2013), who study the impact of star ratings on MA plan choice using individual- level CMS data. However, the analysis in Reid et al. (2013) does not differentiate between overall quality beliefs and CMS- reported quality informa-tion. Alternatively, Dafny and Dranove (2008) separately identify the effect of CMS- reported quality from other sources of quality information on plan enrollment. They
fi nd that the publication of MA quality information in 2001 did affect enrollment but that published CMS quality information was less important than other sources of qual-ity information available. However, the qualqual-ity information available during the study timeframe was limited to the 2000–2001 “Medicare & You’” CMS booklet, which published a variety of disaggregated quality metrics (for example, the percentage of women receiving a mammogram) rather than the star rating system currently in place. The private provision of Medicare health insurance has also grown signifi cantly since the timeframe studied in Dafny and Dranove (2008).
In this paper, we analyze the effect of the marginal quality star on MA plan en-rollment. We formulate a discrete choice demand model for differentiated MA plans, and we estimate our model with data on plan enrollment, plan characteristics, and market- area information from 2009 and 2010. Our empirical model is consistent with a nested logit demand model of differentiated products (Berry 1994). We defi ne a nest-ing structure that allows for fl exible substitution patterns between plans by defi ning nests on the basis of prescription drug coverage and positive monthly premiums.3 Our dependent variable is the plan’s log market share relative to the log market share of traditional Medicare fee- for- service (FFS), which serves as a common outside option for all Medicare eligibles in all markets.
We contribute to the literature on the enrollment effects of CMS quality reporting in three important ways. First, within a theoretically grounded model of plan choice, we identify the effect of quality star reporting on a plan’s log relative market share
2. For example, one domain on which contracts were rated was “Helping You Stay Healthy.”
with a novel regression discontinuity (RD) design that exploits plausibly random variation around star thresholds. We replicate CMS’s underlying, continuous contract quality score and examine log relative share changes within a bandwidth around each star threshold. Importantly, our research design allows us to differentiate the effect of CMS- reported quality information on enrollment from other sources of quality information and prior quality beliefs.4 Ramanarayanan and Snyder (2012) adopt a similar RD approach in their study of the impact of CMS rating systems in the dialysis industry.
Second, we extend the current literature, namely Dafny and Dranove (2008) and Town and Liu (2003), by modeling enrollment at the plan level. Due to data limita-tions, those authors were forced to aggregate enrollment data to the contract level and thus not able to model how plan characteristic variation within MA contracts may infl uence plan enrollment. Although CMS assigns star ratings and grants permission to enroll Medicare benefi ciaries at the contract level, a specifi c contract generally will contain several differentiated plans. Although all plans operating under a given contract receive the same quality score, these plans are differentiated on the basis of plan attributes such as premium and prescription drug coverage. By estimating our model of plan choice at the plan level, we more precisely estimate the effect of quality reporting on plan enrollment and avoid the plan characteristic aggregation assump-tions of other papers.
Finally, while Reid et al. (2013) assume a linear effect of quality stars on enroll-ment, we separately examine enrollment patterns around different star thresholds. Our analysis therefore captures the potentially different enrollment effects of the marginal quality stars across the CMS- reported quality distribution.5 Furthermore, we show that treating star ratings as exogenous may understate the marginal star enrollment effect in 2009, particularly at the low end of the star rating distribution.
We fi nd generally positive and signifi cant effects of CMS- reported stars on plan enrollment in 2009, with larger effects for the lower star- rated contracts. Specifi cally, plan market share is found to increase by 4.75 percentage points relative to tradi-tional FFS for plans with three stars relative to 2.5 stars (a 1.5 standard deviation increase in relative market share). This effect drops to 2.74 percentage points (a 0.9 standard deviation increase) for plans with four stars relative to 3.5 stars. In context, a 4.75 percentage point increase in relative market share is equivalent to 131 additional enrollments among smaller counties and 1,353 additional enrollments among larger counties.6 Our results are robust to different bandwidth and nesting specifi cations.
When we repeat the analysis for 2010, we fi nd smaller effects, none of which are statistically signifi cant. Although our market level data are not suffi ciently rich to
4. This distinction is a common concern in the literature on the effects of information campaigns. For ex-ample, Dranove and Sfekas (2008), in studying the effect of hospital report cards on hospital market share, use the example that a positive quality report is unlikely to increase the market share of the Mayo Clinic. 5. Other papers that investigate the effects of quality information dissemination also fi nd differential effects at different points in the quality distribution. For example, see Scanlon et al. (2002) on health plan demand and Dranove and Sfekas (2008) on hospital demand.
explain why the quality star system yielded enrollment shifts in 2009 and not in 2010, we present suggestive evidence for two supply- side responses to the 2009 ratings that may explain our observed differences in results. First, we observe a dispropor-tionate percentage of plans from low star- rated contracts in 2009 exiting the market between 2009 and 2010, suggesting that lower star- rated contracts that are observed in both years dropped plans at a greater rate than higher star- rated contracts. Second, our results suggest that marginally higher- rated contracts in 2009 raised premiums from 2009 to 2010, potentially pricing out any quality advantages.
Our results have implications within the CMS rating program and potentially broader implications for future rating programs. Within the current program, our re-sults indicate that the rating program has not meaningfully driven benefi ciaries toward the highest- rated plans. The Patient Protection and Affordable Care Act (ACA) now ties bonus and other incentive payments with the CMS star ratings. However, our results suggest that the incentive to increase quality stars for enrollment purposes is relatively minimal at the high end of the star rating distribution, making the CMS bonus program the predominant incentive in place for contracts to achieve the highest possible star ratings. Considering the design of future rating programs (for example, rating plans on the insurance exchanges), our results also highlight potential unin-tended consequences via supply- side responses from one year to the next.
This paper proceeds as follows. We summarize the background of the MA program in Section II, including the recent star rating program. Section III reviews the current literature on the role of quality and quality reporting on health plan choice. Section IV presents our proposed methodology and relevant econometric background. Section V summarizes the data used in our analysis. Section VI presents the results of our anal-ysis along with a series of robustness checks and an investigation into the differences in our 2009 and 2010 results, and Section VII concludes. Details of the star rating pro-gram, our calculations, and data cleaning are presented in appendices available online.7
II. Medicare Advantage
The Balanced Budget Act of 1997 (BBA) introduced private health in-surance options known as Medicare + Choice plans (M+C, or Medicare Part C), which included traditional Health Maintenance Organizations (HMOs) but allowed additional plan types including Preferred Provider Organizations (PPOs), Provider- Sponsored Organizations (PSOs), Private FFS (PFFS) plans, and Medical Savings Accounts (MSAs). The introduction of Medicare Part C generated an infl ux of supplemental care options for the Medicare population. Medicare Part C was then revised in 2003 under the Medicare Modernization Act and renamed Medicare Advantage (MA), which al-lowed additional plan types such as Regional PPOs and Special Needs Plans (SNPs) as well as prescription drug coverage. MA plans, like the preceding Medicare Part C plans, are provided by private companies that contract with CMS yearly. Contracts are approved at the county level, and there can be multiple individual plans provided under each contract. As such, only those residents living in the county in which the contract applies have access to the plans under that contract.
By choosing an MA plan, benefi ciaries no longer receive the traditional benefi ts of Medicare FFS but must still enroll in Medicare Parts A and B and pay the Part B premium. CMS requires that MA plans offer at least what the benefi ciary could receive from Medicare FFS. Most MA contracts are also required to offer at least one plan that includes prescription drug coverage. MA plans are therefore a form of voluntary supplemental coverage for the Medicare population. Other avenues of supplemen-tal coverage available for Medicare benefi ciaries include Medicaid, Medigap, and employer- provided insurance.
For a given calendar year, benefi ciaries may enroll in MA plans during an open enrollment period from November 1 through December 31 of the prior year. During this time, eligibles aged 65 years or older without end stage renal disease may choose any plan available in their area. Limited enrollment continues through June 30 of the current year, during which time eligibles may only enroll in an MA plan if the plan is currently accepting new members. Benefi ciaries may also switch plans during the limited enrollment period, but only one switch is allowed per year.
As of September 2012, MA plans provided coverage to 13.7 million benefi ciaries (approximately 27 percent of the total Medicare population) based on a total of 2,074 MA plans across the country, with an average of 20 plans available to a given ben-efi ciary.8 This is a substantial increase in plans from 2002, when just 452 total plans based on 174 contracts were available across the United States, covering a total of 5.3 million Medicare benefi ciaries.
Although existing plans offer a variety of optional benefi ts, the abundance of MA plan choices can be overwhelming for much of the Medicare population. In a study commissioned by the American Association for Retired Persons (AARP), Hibbard et al. (1998) found that most benefi ciaries do not fully understand the differences be-tween the standard Medicare FFS and Medicare Part C. Atherly (2001); Frank (2004); and Heiss, McFadden, and Winter (2006), among others, have also found strong sur-vey evidence that the choice set is overly complicated and that benefi ciaries often do not make fully informed decisions.
CMS has historically recognized the potential diffi culty for Medicare benefi cia-ries to make informed decisions regarding their health plans. For example, under the BBA, CMS was mandated to provide health plan quality information to Medicare benefi ciaries. Among other things, CMS responded with a “Medicare and You” hand-book mailed to all Medicare eligibles at the start of the open enrollment period. This handbook was fi rst circulated to eligibles in November 1999 (relevant for coverage in 2000) and included a variety of measures intended to better inform benefi ciaries of the quality of plans available in their respective geographic areas.
Building upon these prior quality reporting initiatives, CMS launched a star rating program in 2007 by which contracts are rated from one to fi ve stars based on several measures covering fi ve domains: (1) “helping you stay healthy,” (2) “getting care from your doctors and specialists,” (3) “getting timely information and care from your health plan,” (4) “managing chronic conditions,” and (5) “your rights to appeal.” Since 2007, the individual measures and domains have changed nearly every year. For ex-ample, CMS expanded the “rights to appeal” domain in 2010 to include measures on
complaints and the number of benefi ciaries leaving the plan, among others. Also in 2010, the “timely information” domain was replaced by “customer service.” Online Appendix 1 details the individual measures and domains for 2009.
In each year, individual measures are quantifi ed and given a star rating based on the criteria published by CMS. For example, in 2008, the “helping you stay healthy” domain included eight individual measures. One such individual measure was “breast cancer screening,” measured as the percent of female MA enrollees ages 50 to 69 who had a mammogram during the measurement year or the year prior to the measure-ment year. The contract received a star rating for this measure based on its percentile rank, with one- star, two- star, three- star, four- star, and fi ve- star ratings based on the 15th, 35th, 65th, 85th, and 100th percentile, respectively. Data for this measure were collected from the Healthcare Effectiveness Data and Information Set (HEDIS), previ-ously known as the Health Plan Employer Data and Information Set.
Star ratings are calculated for each individual measure based on data collected from a variety of sources, including HEDIS, the Consumer Assessment of Healthcare Pro-viders and Systems (CAHPS), the Health Outcomes Survey (HOS), the Independent Review Entity (IRE), the Complaints Tracking Module (CTM), and CMS adminis-trative data. These star ratings are then averaged to generate a star rating for each domain. Beginning in 2009, the star ratings of individual measures were also averaged to generate an overall star rating for the contract (after additional adjustments by CMS intended to reward consistency across individual metrics), rounded to the nearest half- star. The star rating for each domain and each individual metric are still available on the plan fi nder website but are not provided as part of the high- level summary and comparison of each plan. Online Appendix 2 details the star rating calculations for 2009 and provides example calculations for fi ve contracts.
III. Evidence on the Effects of Quality Reporting
The current study concerns the impact of star ratings on MA enroll-ments and relates generally to the literature on quality ratings and health plan choice (Beaulieu 2002, Chernew and Scanlon 1998, Dafny and Dranove 2008, Farley et al. 2002, Jin and Sorensen 2006, Scanlon et al. 2002, Spranca et al. 2000, Wedig and Tai- Seale 2002).9 Existing studies in this area have relied on a variety of techniques and data sets in order to more accurately estimate the effect of quality information on a consumer’s health plan choice.
In a laboratory setting, Spranca et al. (2000) found that consumers with access to quality ratings were more likely to choose higher- rated but less expensive, less com-prehensive plans. Conversely, subjects without access to quality ratings were more likely to choose more expensive plans offering more comprehensive coverage. These results suggest an important role for quality ratings—namely, improved matching be-tween consumers and plans. The results also suggest that, in the absence of quality ratings, consumers may rely more heavily on decision rules to aid in their choice of health plans. Screening rules have been the subject of recent studies in health plan
choice (Li and Trivedi 2012, Schram and Sonnemans 2011); however, such studies generally do not consider alternative decision rules among those with and without access to plan quality information.
Studies based on observational data have focused largely on the private insurance market. Beaulieu (2002), for example, analyzed plan choice and switching behavior using data on Harvard University health insurance plans from 1995 through 1997. Comparing switching behaviors from 1995 to 1996 (when health plan quality informa-tion was not made available to enrollees) to switching behavior in 1996 to 1997 (when quality information was available), she found that enrollees responded (albeit mod-estly) to quality reports by switching away from lesser- quality plans and concluded that quality reports provided additional information beyond what consumers indepen-dently obtained from experience. She also found evidence that older employees used quality information differently than younger employees.
Scanlon et al. (2002) analyzed the impact of quality ratings on health plan choice for General Motors’ nonunion employees in 1997. Aggregating data to the market share level, the authors found that individuals avoided plans with several below average ratings; however, the analysis could not identify the impact of specifi c health quality domains on choice (for example, the impact of patient satisfaction ratings versus medi-cal / surgimedi-cal care). Alternatively, Chernew and Scanlon (1998) modeled the impact of quality ratings in a Bayesian learning framework where quality ratings served as a signal with which employees updated their prior beliefs. Experience was therefore implicitly accounted for in employees’ prior beliefs. The authors found that quality ratings had a modest but signifi cant impact on health plan choice. The authors also found evidence of heterogeneity across dimensions in which health plans were rated with medical / surgical ratings having the largest impact.
Wedig and Tai- Seale (2002) analyzed the impact of report card ratings distributed to federal employees under the Federal Employees Health Benefi t Plan (FEHBP). Comparing health plan choices in 1995 (prior to report cards being issued to enrollees) to choices in 1996 (after report cards were made available), the authors found that report card ratings on quality of care had a signifi cant impact on health plan choice, particularly on new employees, while report card ratings on plan coverage impacted existing employees and showed no signifi cant effect for new employee plan choice. The study also found that report cards increase the price elasticity of demand, indicat-ing that report card ratindicat-ings impact how enrollees value other plan attributes.
Using FEHBP data from 1998 to 1999, Jin and Sorensen (2006) studied the impact of NCQA ratings on health plan choice among retirees and surviving family members of federal employees. The data set included two types of plans: (1) plans that allowed quality ratings to be distributed to enrollees; and (2) plans for which ratings were calculated but were not made public. The data and methodology therefore allowed the analysis to distinguish between quality information provided by health plan ratings versus other quality signals known to consumers but not observed by the researcher. The authors found that NCQA ratings had an important impact on individuals select-ing a plan for the fi rst time in their geographic area and those who switched plans from 1998 to 1999.
Medicare HMO enrollees from 1994 to 2002. Comparing plan switching behaviors after 2000 to switching behaviors prior to 2000, the authors found little evidence that the “Medicare & You” booklets offered any additional quality information beyond existing ratings from U.S. News & World Report, word of mouth, or prior experience. Of the relatively small effects that emerged from the “Medicare & You” booklets, the authors identifi ed consumer satisfaction scores as the only metric impacting benefi cia-ries’ switching behaviors. The authors concluded that public quality reporting initia-tives offered relatively little information not already revealed through market- based learning (for example, grading systems from other sources, personal experience, and word of mouth).
Most recently, Reid et al. (2013) studied the impact of star ratings on MA plan choice using individual- level plan choice data from CMS. Similar to Wedig and Tai- Seale (2002) and Jin and Sorensen (2006), the authors found that star ratings had the largest positive effect on fi rst- time MA enrollees. Importantly, the analysis in Reid et al. (2013) did not differentiate between plan quality and reported quality infor-mation. This is a critical area of distinction, as refl ected by previous efforts in the literature to parse out these different effects (Scanlon et al. 2002, Wedig and Tai- Seale 2002, Jin and Sorensen 2006, Dafny and Dranove 2008). Our paper follows this area of research in attempting to quantify the role of star ratings as a reporting mechanism rather than as an overall indicator of quality. Given the variety of avenues by which benefi ciaries can gauge a plan’s quality, the value of star ratings solely as a reporting mechanism remains a critical and policy- relevant question that is unaddressed in the current literature.
IV. Methodology
Following Berry (1994) and the subsequent, voluminous literature on demand estimation, we estimate a discrete choice model in which a Medicare- eligible individual maximizes her utility over a menu of Medicare options available in her market area. The set of differentiated products from which an individual may select is specifi c to an individual’s area of residence. In all markets, an individual may opt for traditional Medicare FFS, which we defi ne as the outside option j = 0. Alternatively, an individual in market area m may select a contract(plan), j(p), from the set
j∈{0,1(p),…,Jm(p)}.10 Due to data limitations, previous studies of Medicare plan
choice with market- level data aggregated the decision model to the contract level, in-cluding Dafny and Dranove (2008) and Town and Liu (2003); however, there are often different plans within a contract that are differentiated on the basis of premiums, de-ductibles, and prescription drug benefi ts. Indeed, Dafny and Dranove (2008) and Town and Liu (2003) use the lowest premium plan within a contract as the contract premium. Given data on plan characteristics, we are able to identify a richer model of plan choice.
Let the utility of individual i from selecting Medicare option j(p) in market area m be given as
(1) Uij(p)m = δj(p)m + ξj(p)m + ζig + (1 – σ)εij(p)m,
where δj(p)m and ξj(p)m represent the mean level of utility derived from observed and unobserved contract- plan- market area characteristics, respectively. Following the nested logit structure of Berry (1994), we partition the set of Medicare options into groups, indexed by g, as follows: (1) MA plans that offer prescription drug coverage (MA- PD plans) with no monthly premiums; (2) MA- PD plans with positive monthly premiums; (3) MA plans that do not offer prescription drug coverage (MA- Only plans) with no monthly premiums; (4) MA- Only plans with positive monthly premiums; and (5) traditional FFS (g = j = 0). In addition to the iid extreme value error εij(p)m, indi-vidual preferences are allowed to vary through group dummies ζig. This nested logit structure relaxes the independence of irrelevant alternatives assumption and allows for differential substitution patterns between nests. The nesting parameter, σ, captures the within- group correlation of utility levels.
To capture the effect of quality reporting on enrollment, we specify mean utility as follows:
δj(p)m = qjγ + Xj(p)mβ – αFp,
where qj denotes the quality of contract j and Xj(p)m are contract, plan, and market- level observed characteristics, including a dummy variable for Part D participation and market- level data on the age, race, and education profi le of a given county.11 If the plan charges a monthly premium, F, then α captures the price effect.
Berry (1994) shows how to consistently estimate the parameters of utility Function 1 by integrating out the individual level variation in preferences. If we assume that εij(p)m follows a multivariate extreme value distribution, then from Cardell (1997) it follows that ζig + (1 – σ)εij(p)m is also an extreme value random variable. The relative probability that an individual in market area m will select option j(p) as compared to Medicare FFS therefore has the following closed- form:
ln(Pj(p)m) – ln(P0m) = δj(p)m + σ ln(Pj(p)m|g) + ξj(p)m.
Here, Pj(p)m|g is the conditional probability of an individual enrolling in option j(p) within group g. Applying market share data as empirical estimates of the probabilities yields our fi nal estimation equation
(2) ln(Sj(p)m) – ln(S0m) = δj(p)m + σ ln(Sj(p)m|g) + ξj(p)m,
where Sj(p)m denotes the share of individuals (relative to all Medicare eligibles) enroll-ing in option j(p) in market area m, Sj(p)m|g denotes the within- group market share of option j(p), and ξj(p)m denotes the mean utility derived from unobserved plan charac-teristics.
Most studies of differentiated products recognize that observed product characteris-tics are likely to be correlated with the mean utility derived from unobserved product and market characteristics, ξj(p)m. Indeed, the standard approach to recovering unbiased estimates treats observed product characteristics, Xj(p)m, as exogenous after product
fi xed effects and instruments for prices with those of other markets (Town and Liu 2003); however, we cannot use a fi xed effects approach at the contract level because quality information is only disseminated at the contract level. Moreover, as refl ected in
Dafny and Dranove (2008) and others, a benefi ciary’s knowledge of contract quality is made up of several individual components. Our interest lies in the specifi c informa-tional value of the CMS star rating program separate from other sources of quality in-formation available to benefi ciaries. Therefore, the overall quality component of an in-dividual’s utility, qj, can be partitioned into a prior quality component and a potentially informative signal in the form of CMS star ratings, which are likely to be correlated.
Exploiting the nature of the CMS rating system, we propose an alternative meth-odology for the estimation of the effect of CMS star ratings based on a regression discontinuity (RD) design.12 The RD design is intended to simulate a randomized trial by limiting the analysis to a window around threshold values. As discussed in Lee and Lemieux (2010), the RD design more closely resembles a randomized trial than some of the more common empirical approaches, including instrumental variables and fi xed effects estimation. In our setting of plan choice and contract quality, the RD design focuses the analysis on contracts where assignment into treatment (for example, a half- point improvement in star rating) is arguably random. In other words, a contract with an overall summary score of 2.26 is essentially identical in overall quality to a contract with a summary score of 2.24, even though the fi rst contract will receive a star rating of 2.5 while the second contract will receive a star rating of 2.0. The two contracts therefore differ only in terms of CMS- reported quality.
Following Imbens and Lemieux (2008), our method proceeds by restricting the sample to a prespecifi ed bandwidth, h, around each of four star rating thresholds. For example, to analyze the impact of improving from 2.0 to 2.5 stars, the sample is re-stricted to contracts with summary scores of 2.25±h, where contracts with scores less than 2.25 were rounded to 2.0 stars and contracts with scores of 2.25 or greater were rounded to 2.5 stars. We then defi ne Rj as the underlying summary score, Rˆ as the threshold summary score at which a new star rating is achieved (for example, Rˆ = 2.25 when considering the 2.5 star rating), and R = Rj−Rˆ, which represents the amount of improvement necessary to achieve an incremental improvement in rating. To imple-ment our approach, we specify the quality component of utility, qj, as follows: (3) qj=␥1+␥21(Rj > R) ˆ +∑d=D1[␥
3Rjd+␥41(Rj> R)ˆ Rjd],
where interest ultimately lies in γ2 and where D denotes the order of the polynomial. Setting D = 1 therefore amounts to a local linear regression within the specifi ed band-width around each star rating threshold. Incorporating Equation 3 with the mean utility specifi cation yields the fi nal regression equation,
(4) ln(Sj(p)m) – ln(S0m)=␥1+␥21(Rj> Rˆ)+∑d=D1[␥3Rjd +␥41(Rj > Rˆ)Rjd],
+Xj(p)m–␣Fp+ln(Sj(p)m|g)+j(p)m.
Our application of the RD design differs from that of the standard RD application in one critical way. Typically, the assignment variable is measured at the same level as the outcome variable so that plausibly random variation around the discontinuity
will explain subsequent variation in outcomes. In our application, however, quality is reported as a contract- level characteristic while market shares are at the plan level. Multiple plans operating under the same contract will therefore have different market shares with no variation in CMS- reported quality.
Moreover, even with purely randomized quality scores at the contract level, we would not expect to see randomization in plan or county- level variables, just as one would not expect to see randomization in household characteristics in a survey with randomly selected states or counties. Because of this institutional fact, plan and county level covariates do not merely serve to reduce the variation in coeffi cient estimates as in the case with the standard RD design (Imbens and Lemieux 2008, Lee and Lemieux 2010). Instead, covariates come directly from a utility- maximizing model of health plan choice and serve the traditional regression purpose to control for plan- and county- level characteristics that likely infl uence a plan’s market share. Specifi c covariates included in our analysis are county- level demographic data (unemployment rate, population over 65, population over 85, percent female, percent black, percent white, percent of college graduates, and a dummy for Southern counties), plan pre-mium, drug copays, and dummy variables for whether the plan offers prescription drug coverage, whether the plan charges a positive monthly premium, and plan type (HMO, PPO, or PFFS).
Finally, if the star ratings have an impact on overall market share, then the within- group shares will be endogeneous and tend to bias the estimate of γ2. We there-fore estimate Equation 4 using two- stage least squares (within the bandwidth around each star rating), with age of the contract and the number of within- group plans as instruments for the within- group share term, Sj(p)m|g, the latter of which has also been used in Town and Liu (2003) and Dafny and Dranove (2008).
To estimate Equation 4, we collected data on market shares, contract / plan char-acteristics, and market area characteristics from several publicly available sources from June 2008 through December 2011. The unit of observation is the con-tract / plan / county / month / year. However, because our identifi cation strategy exploits plausibly random variation that is cross- sectional, we do not exploit the panel nature of the contract / plan records. Instead, consistent with the MA open enrollment period, we model the mean market share over a year as a function of CMS- reported contract quality during the previous open enrollment period. We report summary statistics and results for 2009 and 2010 enrollments based on quality information that was fi rst reported in the previous October.
Market share data are constructed from the Medicare Service Area fi les, which list all approved MA contracts within a county / month / year.13 To these records, we merge enrollment and plan information at the contract / plan level from the MA enroll-ment fi les. We also merge county- level MA penetration information to control for the prevalence of MA enrollment. Next, we merge quality information at the contract / year level, which includes an overall summary star measure, star ratings for different do-mains of quality (for example, helping you stay healthy), as well as star ratings and
continuous summary scores for each individual metric (for example, the percentage of women receiving breast cancer screening and an associated star rating). As discussed above and in Online Appendix 2, data are not available for the overall continuous summary score, but we are able to replicate this variable by aggregating the specifi c quality measures as CMS does. Finally, we merge plan premium information at the contract / plan / county / year level and county- level census demographic and socioeco-nomic information from the American Community Survey.
There exists very little variation in contract / plan enrollment across months in the same calendar year. We therefore take the average enrollment over a year to con-struct market share variables rather than arbitrarily choosing a given month. After constructing the relevant market share variables from mean enrollment, we drop all observations with missing quality information or with overall star ratings that could not be replicated (six contracts in 2009 and seven contracts in 2010).14 We also drop all contract / plans with missing premium information. Dropping these observations does not change our main fi ndings relative to assuming a zero premium. Finally, to focus on HMO, PPO, and PFFS plans, we drop all special needs plans and employer- specifi c plans. For 2009 and 2010, we have 20,374 and 17,130 contract / plan / county observa-tions, respectively.15
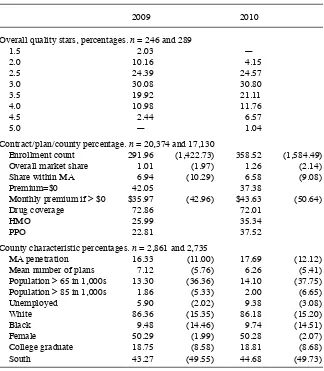
Table 1 provides summary statistics by year for the fi nal data sets used in the anal-ysis. The mean contract / plan enrollment is 292 enrollees in 2009, and the mean overall market share is 1 percent of the eligible market. Forty- two percent of plans have a zero premium, and 72 percent offer some form of Part D drug coverage in 2009. The quality distribution in 2009 is roughly mound- shaped with three stars as the modal contract quality star value.
The MA market appears to consolidate between 2009 and 2010. While the share of MA enrollees relative to Medicare- eligible individuals increases from 16.33 percent to 17.69 percent, the mean number of contract / plans in a county decreases from 7.12 to 6.26. Meanwhile, the average enrollment increases by 22.8 percent to 359 enrollees per contract / plan. While no 1.5- star contracts from 2009 remain in our 2010 sample, the quality distribution does not appreciably shift between 2009 and 2010.16
VI. Results
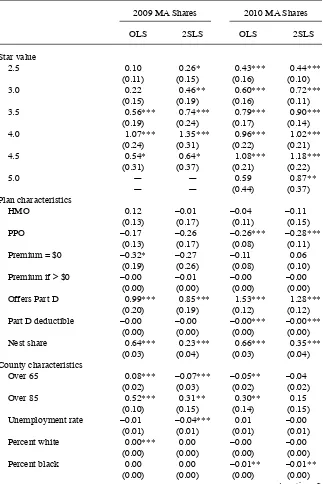
First, we estimate standard OLS and 2SLS regressions based on the full sample of plans, with results summarized in Table 2. Note that the star rating
coef-fi cients in Table 2 are interpreted relative to all plans with less than a 2.5 rating. For the 2SLS results in 2009, individual tests of each star rating coeffi cient relative to the
14. Many contracts were too new to be evaluated on all quality dimensions, and thus were omitted from Medicare’s quality reporting. Of the ratings that were accurately replicated, we estimate contracts with sum-mary score values marginally above or below the relevant thresholds. Our sumsum-mary score calculations are therefore not systematically biased in one direction or the other, and it is unlikely that our results are biased by the handful of contracts for which star ratings were not replicated.
15. See Online Appendix 3 for further details on our sample construction.
next lowest rating reveals no signifi cant effects from 2.5 to three stars or from three to 3.5 stars, with a signifi cant effect of 0.61 (1.32 percentage point increase in relative market share) when moving from 3.5 to four stars.17 For the 2SLS results in 2010, the only signifi cant effects emerged when moving from two to 2.5 stars or from 2.5 to three stars. Importantly, the estimates of the quality coeffi cient from these regressions represent the impact of overall plan quality (as measured by the star ratings) and not specifi cally the impact of CMS- reported quality from the CMS star rating program.
17. Conversion from coeffi cients to estimated effects on relative market shares follows from Kennedy (1981): gˆ=(exp(ˆ␥2−0.5 ˆV␥2)−1), where Vˆ
2 denotes the estimated variance of the γ2 coeffi cient.
Table 1
Summary Statistics
2009 2010
Overall quality stars, percentages. n = 246 and 289
1.5 2.03 —
2.0 10.16 4.15
2.5 24.39 24.57
3.0 30.08 30.80
3.5 19.92 21.11
4.0 10.98 11.76
4.5 2.44 6.57
5.0 — 1.04
Contract / plan / county percentage. n = 20,374 and 17,130
Enrollment count 291.96 (1,422.73) 358.52 (1,584.49)
Overall market share 1.01 (1.97) 1.26 (2.14)
Share within MA 6.94 (10.29) 6.58 (9.08)
Premium=$0 42.05 37.38
Monthly premium if > $0 $35.97 (42.96) $43.63 (50.64)
Drug coverage 72.86 72.01
HMO 25.99 35.34
PPO 22.81 37.52
County characteristic percentages. n = 2,861 and 2,735
MA penetration 16.33 (11.00) 17.69 (12.12)
Mean number of plans 7.12 (5.76) 6.26 (5.41)
Population > 65 in 1,000s 13.30 (36.36) 14.10 (37.75)
Population > 85 in 1,000s 1.86 (5.33) 2.00 (6.65)
Unemployed 5.90 (2.02) 9.38 (3.08)
White 86.36 (15.35) 86.18 (15.20)
Black 9.48 (14.46) 9.74 (14.51)
Female 50.29 (1.99) 50.28 (2.07)
College graduate 18.75 (8.58) 18.81 (8.68)
Table 2
OLS and 2SLS Regression Results for MA Shares
2009 MA Shares 2010 MA Shares
OLS 2SLS OLS 2SLS
Star value
2.5 0.10 0.26* 0.43*** 0.44***
(0.11) (0.15) (0.16) (0.10)
3.0 0.22 0.46** 0.60*** 0.72***
(0.15) (0.19) (0.16) (0.11)
3.5 0.56*** 0.74*** 0.79*** 0.90***
(0.19) (0.24) (0.17) (0.14)
4.0 1.07*** 1.35*** 0.96*** 1.02***
(0.24) (0.31) (0.22) (0.21)
4.5 0.54* 0.64* 1.08*** 1.18***
(0.31) (0.37) (0.21) (0.22)
5.0 — — 0.59 0.87**
— — (0.44) (0.37)
Plan characteristics
HMO 0.12 –0.01 –0.04 –0.11
(0.13) (0.17) (0.11) (0.15)
PPO –0.17 –0.26 –0.26*** –0.28***
(0.13) (0.17) (0.08) (0.11)
Premium = $0 –0.32* –0.27 –0.11 0.06
(0.19) (0.26) (0.08) (0.10)
Premium if > $0 –0.00 –0.01 –0.00 –0.00
(0.00) (0.00) (0.00) (0.00)
Offers Part D 0.99*** 0.85*** 1.53*** 1.28***
(0.20) (0.19) (0.12) (0.12)
Part D deductible –0.00 –0.00 –0.00*** –0.00***
(0.00) (0.00) (0.00) (0.00)
Nest share 0.64*** 0.23*** 0.66*** 0.35***
(0.03) (0.04) (0.03) (0.04)
County characteristics
Over 65 0.08*** –0.07*** –0.05** –0.04
(0.02) (0.03) (0.02) (0.02)
Over 85 0.52*** 0.31** 0.30** 0.15
(0.10) (0.15) (0.14) (0.15)
Unemployment rate –0.01 –0.04*** 0.01 –0.00
(0.01) (0.01) (0.01) (0.01)
Percent white 0.00*** 0.00 –0.00 –0.00
(0.00) (0.00) (0.00) (0.00)
Percent black 0.00 0.00 –0.01** –0.01**
(0.00) (0.00) (0.00) (0.00)
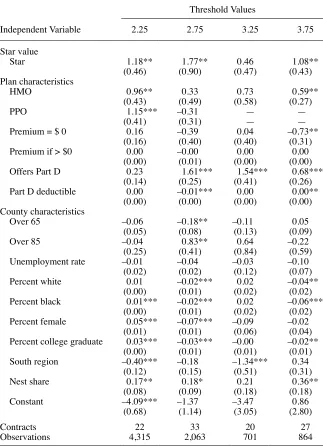
Table 3 presents the estimated star rating coeffi cients from 2009 data using local linear regressions.18 The results show a positive and signifi cant effect of star ratings at the 2.5, three, and four- star thresholds. The largest effect comes from a three- star rating relative to a 2.5- star rating (2.75 threshold) which, based on the local linear regression, suggests an increase in a plan’s market share relative to Medicare FFS of 4.75 percentage points. The effect drops to a 2.74 percentage point increase in relative market share for four- star contracts relative to 3.5- star contracts. By contrast, the two- stage least squares effects in Table 2 suggest no signifi cant effects for three relative to 2.5 star contracts and a 1.32 percentage point (p < 0.01) increase for four relative to 3.5 star contracts. These results indicate that the effects vary across the quality distribution but also that there may exist a negative correlation between CMS star ratings and enrollees’ prior beliefs in 2009, particularly at the lower end of the star rating distribution. Additionally, our estimate of the nesting parameter, σ, on the within- group log market share ranges between 0.17 and 0.36, suggesting a small but statistically signifi cant correlation in mean utility within groups. The magnitude of the estimated nesting parameter σ is similar to that of the full- sample 2SLS results in Table 2.
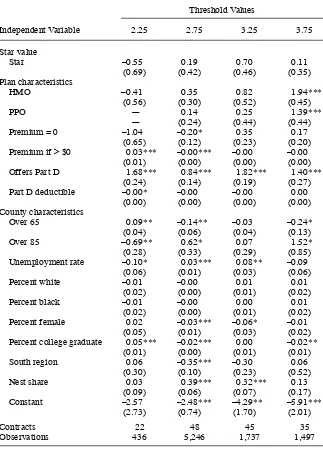
Results for an identical analysis based on 2010 MA share data are presented in Table 4. Counter to the results in 2009, our 2010 analysis reveals no signifi cant effects of CMS- reported star ratings on relative market shares. We discuss these differences in more detail in Section VIA; however, before we formally compare the 2009 and 2010 results, we fi rst assess the robustness and sensitivity of the 2009 and 2010 results individually.
18. Our preferred specifi cation is linear in Rj for small sample concerns. Higher- order polynomial specifi ca-tions yield large standard errors and are subject to overfi tting problems.
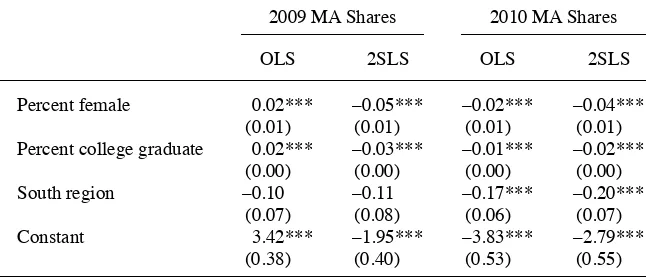
2009 MA Shares 2010 MA Shares
OLS 2SLS OLS 2SLS
Percent female 0.02*** –0.05*** –0.02*** –0.04***
(0.01) (0.01) (0.01) (0.01)
Percent college graduate 0.02*** –0.03*** –0.01*** –0.02***
(0.00) (0.00) (0.00) (0.00)
South region –0.10 –0.11 –0.17*** –0.20***
(0.07) (0.08) (0.06) (0.07)
Constant 3.42*** –1.95*** –3.83*** –2.79***
(0.38) (0.40) (0.53) (0.55)
Notes: Results based on OLS and 2SLS regressions estimated on the full sample of plans, with standard errors in parentheses and robust to heterogeneities across plans and clustering at the contract level. Omitted star category is less than 2.5 stars. For 2SLS results, within- group shares were instrumented with the age of the contract and the number of plans in the same nest. * p < $0.1, ** p < $0.05, *** p < $0.01.
Table 3
RD Regression Results for 2009 MA Shares
Threshold Values
Independent Variable 2.25 2.75 3.25 3.75
Star value
Star 1.18** 1.77** 0.46 1.08**
(0.46) (0.90) (0.47) (0.43)
Plan characteristics
HMO 0.96** 0.33 0.73 0.59**
(0.43) (0.49) (0.58) (0.27)
PPO 1.15*** –0.31 — —
(0.41) (0.31) — —
Premium = $ 0 0.16 –0.39 0.04 –0.73**
(0.16) (0.40) (0.40) (0.31)
Premium if > $0 0.00 –0.00 0.00 0.00
(0.00) (0.01) (0.00) (0.00)
Offers Part D 0.23 1.61*** 1.54*** 0.68***
(0.14) (0.25) (0.41) (0.26)
Part D deductible 0.00 –0.01*** 0.00 0.00**
(0.00) (0.00) (0.00) (0.00)
County characteristics
Over 65 –0.06 –0.18** –0.11 0.05
(0.05) (0.08) (0.13) (0.09)
Over 85 –0.04 0.83** 0.64 –0.22
(0.25) (0.41) (0.84) (0.59)
Unemployment rate –0.01 –0.04 –0.03 –0.10
(0.02) (0.02) (0.12) (0.07)
Percent white 0.01 –0.02*** 0.02 –0.04**
(0.00) (0.01) (0.02) (0.02)
Percent black 0.01*** –0.02*** 0.02 –0.06***
(0.00) (0.01) (0.02) (0.02)
Percent female 0.05*** –0.07*** –0.09 –0.02
(0.01) (0.01) (0.06) (0.04)
Percent college graduate 0.03*** –0.03*** –0.00 –0.02**
(0.00) (0.01) (0.01) (0.01)
South region –0.40*** –0.18 –1.34*** 0.34
(0.12) (0.15) (0.51) (0.31)
Nest share 0.17** 0.18* 0.21 0.36**
(0.08) (0.09) (0.18) (0.18)
Constant –4.09*** –1.37 –3.47 0.86
(0.68) (1.14) (3.05) (2.80)
Contracts 22 33 20 27
Observations 4,315 2,063 701 864
Table 4
RD Regression Results for 2010 MA Shares
Threshold Values
Independent Variable 2.25 2.75 3.25 3.75
Star value
Star –0.55 0.19 0.70 0.11
(0.69) (0.42) (0.46) (0.35)
Plan characteristics
HMO –0.41 0.35 0.82 1.94***
(0.56) (0.30) (0.52) (0.45)
PPO — 0.14 0.25 1.39***
— (0.24) (0.44) (0.44)
Premium = 0 –1.04 –0.20* 0.35 0.17
(0.65) (0.12) (0.23) (0.20)
Premium if > $0 0.03*** –0.00*** –0.00 –0.00
(0.01) (0.00) (0.00) (0.00)
Offers Part D 1.68*** 0.84*** 1.82*** 1.40***
(0.24) (0.14) (0.19) (0.27)
Part D deductible –0.00* –0.00 –0.00 0.00
(0.00) (0.00) (0.00) (0.00)
County characteristics
Over 65 0.09** –0.14** –0.03 –0.24*
(0.04) (0.06) (0.04) (0.13)
Over 85 –0.69** 0.62* 0.07 1.52*
(0.28) (0.33) (0.29) (0.85)
Unemployment rate –0.10* 0.03*** 0.08** –0.09
(0.06) (0.01) (0.03) (0.06)
Percent white –0.01 –0.00 0.01 0.01
(0.02) (0.00) (0.01) (0.02)
Percent black –0.01 –0.00 0.00 0.01
(0.02) (0.00) (0.01) (0.02)
Percent female 0.02 –0.03*** –0.06* –0.01
(0.05) (0.01) (0.03) (0.02)
Percent college graduate 0.05*** –0.02*** 0.00 –0.02**
(0.01) (0.00) (0.01) (0.01)
South region 0.06 –0.35*** –0.30 0.06
(0.30) (0.10) (0.23) (0.52)
Nest share 0.03 0.39*** 0.32*** 0.13
(0.09) (0.06) (0.07) (0.17)
Constant –2.57 –2.48*** –4.29** –5.91***
(2.73) (0.74) (1.70) (2.01)
Contracts 22 48 45 35
Observations 436 5,246 1,737 1,497
A. Robustness and Sensitivity Analysis
Several empirical questions must also be addressed regarding the appropriateness of the analysis and robustness of the results above. These questions can be generally grouped into three categories: (1) the ability of contracts to manipulate the continu-ous quality score, (2) bandwidth selection, and (3) the defi nition of nests used in the discrete choice framework. We discuss each of these areas in more detail below.
First, MA contracts may behave strategically by improving their summary scores just beyond the relevant threshold values. If this were the case, we would expect to see large jumps in the empirical CDF of the summary scores at the threshold values of 2.25, 2.75, 3.25, etc. Figure 1 presents the empirical CDFs for the 2009 and 2010 summary scores, with different CDFs for each nest. As is clear from the fi gure, there are no apparent jumps in the CDF at the star rating thresholds, indicating no evidence of “gaming”’ on behalf of the payers. Differences in CDFs between plans with and without monthly premiums also tend to support our use of positive and $0 premium plans as separate nests.
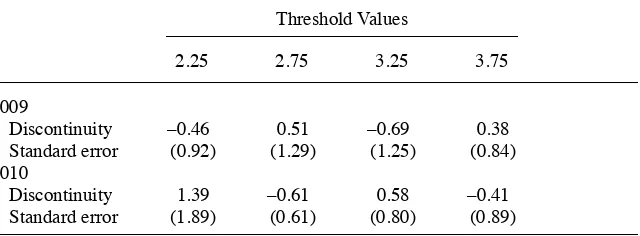
To more formally assess potential manipulation of the running variable, we adopt the density test proposed by McCrary (2008). This is a test of the continuity of the running variable at the threshold values. As McCrary points out, this test is most ap-propriate in situations where manipulation of the running variable is monotonic. This is a reasonable assumption in our case since (if suffi cient manipulation is possible) contracts would only have an incentive to increase their continuous quality score. The estimated discontinuity and standard errors at each threshold point are summarized in Table 5 and presented graphically in Figure 2. As is clear from the estimated size of each discontinuity relative to its standard error, there is no evidence that plans can suffi ciently manipulate the continuous quality score.
The institutional details behind the star rating program would also tend to refute the claim that contracts manipulate their quality score. This is because the star rat-ings are calculated based on data two or three years prior to the current enrollment period. The underlying data for the star ratings were therefore predetermined as of the introduction of the star rating program in the respective enrollment year. Simi-larly, due to the timing of CMS quality reporting and the open enrollment period, contracts would not have the opportunity to manipulate other observable plan char-acteristics in response to their same- year star ratings. Our application is therefore devoid of many of the supply- side issues raised by Werner et al. (2012) in their study of nursing home care, wherein the authors noted that suppliers may respond to low quality scores by changing other product characteristics. One exception to this issue concerns potential adjustments from 2009 to 2010, which we discuss in more detail in Section VIB.
0
.2
.4
.6
.8
1
CDF
1 2 3 4 5
Summary Score
All Plans
Part D, Premium > $0
a. 2009 CDF
b. 2010 CDF Part D, Premium = $0
Part C, Premium > $0 Part C, Premium = $0
0
.2
.4
.6
.8
1
CDF
2 3 4 5
Summary Score
All Plans
Part D, Premium > $0 Part D, Premium = $0
Part C, Premium > $0 Part C, Premium = $0
Figure 1
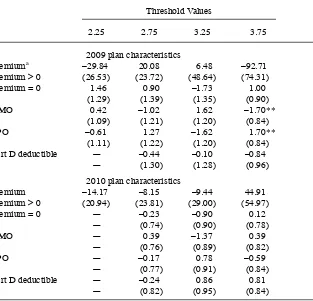
show no signifi cant differences in characteristics below versus above the respective star rating thresholds.19
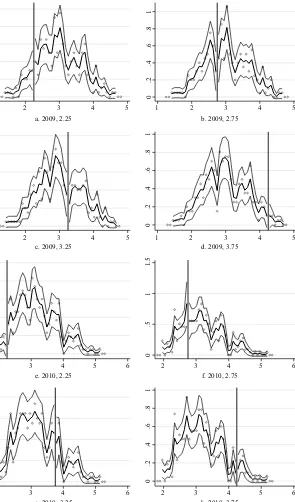
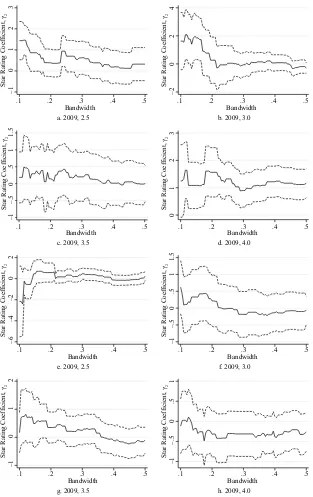
The choice of bandwidth is another common area of concern in the RD literature. To assess the sensitivity of our results to the choice of bandwidth, we replicated the local linear regression approach from Tables 3 and 4 for alternative bandwidths rang-ing from 0.095 to 0.50 in increments of 0.005. The results are illustrated in Figure 3, where each graph presents the estimated star- rating coeffi cient, ␥ˆ2, along with the upper and lower 95 percent confi dence bounds. In 2009, for increasingly large band-widths, the effect at 2.5 and 3.0 stars diminishes in magnitude and becomes insignifi -cant while the estimated effect at 3.5 stars is persistently insignifi cant, and the effect at 4.0 stars remains signifi cant with a magnitude of between 1.0 and 1.5. Within the narrower bandwidths (less than 0.15), the 2009 panel is consistent with the results from Table 3 in that the effect of star ratings is highest among the lower threshold values. As the bandwidth enlarges, the role of existing quality information (as opposed to CMS- reported quality) would be expected to have a larger infl uence. As such, the results largely collapse to those in Table 2 at larger bandwidths, which explains the persistent effects at the 4.0 star threshold relative to the 3.5 star threshold. Similarly, the effects in the 2010 panel are consistently insignifi cant and tend to support the ro-bustness of the results in Table 4 with regard to bandwidth selection.
Finally, our delineation of nests according to premium and Part D participation is gen-erally supported by Figure 1, which reveals relatively clear differences in the distribution of star ratings across these four groups. However, previous work from Town and Liu (2003) and others tends to delineate plans by MA- PD versus MA- Only, with no hard-ened differentiation based on premiums. We therefore replicated our analysis using Part D participation as our sole nesting variable. Results from these regressions are summa-rized in Tables 7 and 8 for 2009 and 2010, respectively, where the estimated coeffi cients on the star rating are similar to the results based on our original nests in Tables 3 and 4.
19. We also follow Dafny and Dranove (2008) and Town and Liu (2003) and consider the minimum premium across plans operating under a given contract, with no qualitative change in results from Table 6.
Table 5
McCrary (2008) Density Test
Threshold Values
2.25 2.75 3.25 3.75
2009
Discontinuity –0.46 0.51 –0.69 0.38
Standard error (0.92) (1.29) (1.25) (0.84)
2010
Discontinuity 1.39 –0.61 0.58 –0.41
Standard error (1.89) (0.61) (0.80) (0.89)
B. Comparison of 2009 and 2010
The OLS and 2SLS results in Table 2 suggest that overall contract quality plays an important role in plan choice in both 2009 and 2010. However, the results from the RD design differ substantially in 2010 compared to 2009, with no signifi cant enrollment effects from CMS- reported star ratings estimated in 2010. As indicated by the robust-ness and sensitivity analysis in Section VIA, these differences in the 2009 and 2010 RD results do not appear to be driven by our empirical specifi cation. Moreover, the
Table 6
Test of Plan Characteristics Within Relevant Bandwidths
Threshold Values
2.25 2.75 3.25 3.75
2009 plan characteristics
Premiuma –29.84 20.08 6.48 –92.71
Premium > 0 (26.53) (23.72) (48.64) (74.31)
Premium = 0 1.46 0.90 –1.73 1.00
(1.29) (1.39) (1.35) (0.90)
HMO 0.42 –1.02 1.62 –1.70**
(1.09) (1.21) (1.20) (0.84)
PPO –0.61 1.27 –1.62 1.70**
(1.11) (1.22) (1.20) (0.84)
Part D deductible — –0.44 –0.10 –0.84
— (1.30) (1.28) (0.96)
2010 plan characteristics
Premium –14.17 –8.15 –9.44 44.91
Premium > 0 (20.94) (23.81) (29.00) (54.97)
Premium = 0 — –0.23 –0.90 0.12
— (0.74) (0.90) (0.78)
HMO — 0.39 –1.37 0.39
— (0.76) (0.89) (0.82)
PPO — –0.17 0.78 –0.59
— (0.77) (0.91) (0.84)
Part D deductible — –0.24 0.86 0.81
— (0.82) (0.95) (0.84)
Notes: Results based on OLS regressions with RD approach and a bandwidth of h = 0:125. Robust standard errors are in parentheses. Results were excluded for the 1.5 and 4.5 star ratings due to an insuffi cient number of contracts on the lower and upper ends of the 1.75 and 4.25 thresholds, respectively. Regressions estimated at the contract level, with dependent variables measured as the average value of each plan characteristic by contract. Part D deductible measured only among plans offering Part D, and similarly the plan premium is measured only among plans charging a positive premium. * p < 0.1, ** p < 0.05.
aThe magnitude of the premium coef
a. 2009, 2.5 b. 2009, 3.0
Table 7
RD Regression Results for 2009 MA Shares with Alternative Nests
Threshold Values
2.25 2.75 3.25 3.75
ˆ
␥2 0.99** 1.50** 0.48 0.87*
Standard error (0.42) (0.72) (0.46) (0.48)
ˆ
2 0.25** 0.30** 0.18 0.37
Standard error (0.07) (0.08) 0.22 (0.23)
Contracts 22 33 20 27
Observations 4,315 2,063 701 864
Notes: Results based on 2SLS regressions with RD approach and a bandwidth of h = 0:125. Standard errors in parentheses are robust to heterogeneities across plans and clustering at the contract level. Results were excluded for the 1.5 and 4.5 star ratings due to an insuffi cient number of contracts on the lower and upper ends of the 1.75 and 4.25 thresholds, respectively. Nests were delineated by plans with or without prescription drug coverage. Within- group shares were instrumented with the age of the contract and the number of plans in the same nest. * p < 0.1, ** p < 0.05.
Table 8
RD Regression Results for 2010 MA Shares with Alternative Nests
Threshold Values
2.25 2.75 3.25 3.75
ˆ
␥2 –0.57 0.30 0.64 0.13
Standard error (0.74) (0.36) (0.40) (0.36)
ˆ
2 0.00 0.38*** 0.42*** 0.10
Standard error (0.17) (0.08) 0.07 (0.12)
Contracts 22 48 45 35
Observations 436 5,246 1,737 1,497
Notes: Results based on 2SLS regressions with RD approach and a bandwidth of h = 0.125. Standard errors in parentheses are robust to heterogeneities across plans and clustering at the contract level. Results were excluded for the 1.5 and 4.5 star ratings due to an insuffi cient number of contracts on the lower and upper ends of the 1.75 and 4.25 thresholds, respectively. Nests were delineated by plans with or without prescription drug coverage. Within- group shares were instrumented with the age of the contract and the number of plans in the same nest. * p < 0.1, ** p < 0.05, *** p < 0.01.
Although a given insurer’s ability to actively change its star rating from 2009 to 2010 is limited, a contract may have responded to the 2009 ratings by changing its plan offerings for 2010. For example, a contract may operate a variety of plans in 2009, but upon receiving a low star rating, the contract may reduce the number of plans under that contract in 2010.20 There is empirical evidence in our data suggesting that this is the case. As summarized in Table 9, 98 percent of the plans in contracts with a 1.5 star rating in 2009 were dropped in 2010. Similarly, 50 percent of the plans in a two- star contract in 2009 were dropped in 2010. Meanwhile, less than 20 percent of plans in a contract rated three stars or above were dropped, and only 3 percent of the plans from a 4.5- rated contract were dropped.
To assess the impact of star ratings on plan exit more formally, we estimate a probit regression model of an indicator for plan exit in 2010 as a function of dummies for the 2009 star rating and the same county- and plan- level characteristics included in all prior regressions.21 Probit coeffi cients are reported in the second to last column of Table 9, and the associated marginal effects suggest that plans from a contract with a three- star rating or higher were between 31 percent and 45 percent less likely to be dropped in 2010 than plans with a rating of less than 2.5 stars.
In addition to changing the composition of the plans offered, a contract may have responded to the 2009 publication of quality stars by increasing (decreasing) plan premiums if the contract received a high (low) star rating. If consumers are more sensitive to premium changes than to reported quality changes, then we may observe outfl ows of enrollees from higher- rated plans between 2009 and 2010. To investigate this possibility, we estimate a regression of 2010 plan premium as a function of its 2009 value, 2009 star ratings, and 2009 county / plan characteristics. The results are summarized in the fi nal column of Table 9 and indicate that 2.5, three, and 3.5- star plans had a signifi cant increase in premium from 2009 to 2010.22 Given the existing literature concerning the role of premium on plan choice (see Town and Liu 2003 and others), the results suggest insurers may have priced themselves out of any quality advantages realized from their 2009 star ratings.
Table 10 reports results from the same two dependent variables—plan exit and 2010 plan premium—but within a bandwidth of 0.125 around the 2009 star thresholds. While underpowered, the results in Table 10 suggest that contract / plan observations just above the star thresholds for 2.5 and 3.5 stars in 2009 may have substantially increased premiums (43 percent and 27 percent of a 2010 premium standard deviation, respectively), and contract / plan observations just below some thresholds may have disproportionately exited the market. A full analysis of the causal impact of the 2009 rating on plan exit and adjustments to plan characteristics is beyond the scope of the paper, but the results in Tables 9 and 10 are suggestive of potential supply- side adjust-ments to the 2009 star ratings that may explain the lack of any signifi cant, observed effects of quality stars in 2010. However, we stress that the results of this analysis are suggestive at best, and we cannot confi dently identify either response given the market- level nature of our data and the short two- year timeframe. Ultimately, it could be that the changes to the 2009 to 2010 rating system, in which some domains changed
20. Especially if the contract can identify a specifi c plan for which ratings are likely to be low. 21. The sample includes all 20,374 plan / contract / county observations in 2009.
or were removed / replaced altogether, suffi ciently altered the rating system such that comparisons across years are not meaningful.
VII. Discussion
This paper analyzes the impact of the CMS star rating program on MA enrollments, focusing particularly on the impact of CMS- reported star ratings rather than the more general impact of plan quality. The analysis adopts a standard discrete- choice framework, estimated with market- level enrollment data as initially proposed in Berry (1994) and subsequently widely implemented in the literature on demand estimation. Our analysis also exploits the inherent sharp RD design of the star rating program, wherein the reported star rating calculated by CMS derives from a continuous summary score rounded to the nearest half- star value.
There are two important points that support our adoption of the RD design based
Table 9
Plans from 2009 to 2010 by Star Rating
2009
2.5 7,320 35.93 58.1 57.77 65.10 0.34 26.34***
(37.82) (28.77) (0.44) (9.36)
3.0 3,905 19.17 20.4 59.08 81.76 –0.95** 20.60**
(32.99) (40.98) (0.39) (8.63)
3.5 1,791 8.79 16.2 77.09 99.89 –0.90*** 28.04***
(44.37) (64.48) (0.35) (10.01)
4.0 947 4.65 20.0 85.91 97.51 –0.95*** 15.72
(48.06) (57.88) (0.42) (10.14)
4.5 450 2.21 3.30 80.55 91.52 –2.16*** 16.92
(42.21) (50.48) (0.48) (10.29)
Total 20,374 100 62.08 73.94 — —
(39.36) (48.58)
on the overall star rating. First, the overall star rating in 2009 and 2010 is that which is easily observed by benefi ciaries. Although enrollees can access the domain- level star ratings with some additional effort, a benefi ciary does not generally have easy access to the individual metrics, such as generosity of breast cancer screening. Sec-ond, our design only requires that plans within a bandwidth have comparable overall quality—not that the plans are identical in every dimension. In particular, our design allows for two plans to have similar or even identical summary scores but very dif-ferent individual metrics. If a plan’s overall rating as reported by CMS is important for plan choice, our RD design will appropriately estimate the effect of a marginal improvement in star rating by comparing plans with comparable overall quality scores but plausibly randomly assigned star ratings. To the extent that benefi ciaries rely more on domain- level ratings and not on the overall rating, our RD design is still suffi cient to conclude that the star rating program had a small effect.
Our results indicate that the 2009 published star ratings directed benefi ciaries away from low- rated plans more than actively toward high- rated plans, suggesting that low- star plans may have a relatively larger incentive to increase CMS- reported quality compared to higher rated plans. Meanwhile, when we extended the analysis to the 2010 published star ratings, we found no signifi cant effects at any of the star rating thresholds. A closer inspection of plan behaviors from 2009 to 2010 suggests that lower- rated plans may have disproportionately exited the market from 2009 to 2010 while marginally higher- rated plans in 2009 increased premiums in 2010. These supply- side responses may explain at least some portion of the differences between our 2009 and 2010 results.
Our results have implications within the CMS rating program and potentially broader implications for future rating programs. Within the current program, our re-sults indicate that the rating program has not meaningfully driven benefi ciaries toward the highest- rated plans. Recent reforms that have partially tied MA contract
reim-Table 10
Regression Discontinuity Estimates—2009 to 2010
2.25 2.75 3.25 3.75
Plan exit –0.97*** –0.07 0.34*** –0.35*
Standard error (0.20) (0.16) (0.11) (0.19)
Contracts 16 31 18 864
Observations 4,315 2,063 701 26
2010 premium 67.18*** 13.82 40.76*** 24.92
Standard error (20.67) (27.69) (13.08) (20.33)
Contracts 3 9 9 14
Observations 268 1,245 502 512