FINAL PROJECT - TI 141501
IMPROVEMENT OF INVENTORY CONTROL
SYSTEMS FOR RAW MATERIAL IN A
MAKE-TO-ORDER COMPANY
ROBERTUS WILLY GUNAWAN
NRP 2511 100 118
SUPERVISOR
Prof. Ir. I. Nyoman Pujawan, M. Eng, Ph. D, CSCP
DEPARTMENT OF INDUSTRIAL ENGINEERING
Faculty of Industrial Technology
FINAL PROJECT - TI 141501
IMPROVEMENT OF INVENTORY CONTROL
SYSTEMS FOR RAW MATERIAL IN A
MAKE-TO-ORDER COMPANY
ROBERTUS WILLY GUNAWAN
NRP 2511 100 118
SUPERVISOR
Prof. Ir. I. Nyoman Pujawan, M. Eng, Ph. D, CSCP
DEPARTMENT OF INDUSTRIAL ENGINEERING
Faculty of Industrial Technology
IMPROVEMENT OF INVENTORY CONTROL SYSTEMS FOR RAW
MATERIAL IN A MAKE-TO-ORDER COMPANY
Student Name : Robertus Willy Gunawan
Student ID
: 2511100118
Supervisor
: Prof. Ir. I. Nyoman Pujawan, M. Eng., Ph. D., CSCP.
ABSTRACT
In any manufacturing industry, inventory is always an important part to be
controlled; companies have to design a system that is able to avoid stock outs
while keeping the stock at minimum. Nonetheless, to some extents, managing
inventory is utterly complicated. In many cases, companies turn into fiasco when
they design an efficient inventory control system, especially for make-to-order
companies which deal with extremely high demand uncertainty. In this paper,
several inventory control systems such as continuous review (s, Q system) and
periodic review (R, s, S system) are investigated and compared to the existing
inventory control system in the company. The objective is to obtain a better
inventory control system for every raw material category in terms of total cost and
service level. At the very first phase, considering usage volume and the coefficient
of variance, several raw material samples are taken. This research develops a
Monte Carlo simulation for generating probabilistic demand and shipment lead
time. In carrying out simulation for generating demand, author uses several
replications to evade improper results, which could lead to wrong decisions. Each
scenario for inventory control system is evaluated in terms of total cost and
service level. Heuristic methods for both continuous and periodic inventory
control systems are also used to test the sensitivity of the parameters. This paper
brings an important recommendation to the company as well as insight for
make-to-order companies in general. Since cost is the ultimate output for profit-based
companies including Karya Makmur Baru, Ltd., the proposed inventory control
system for each raw material category could be implemented by the company as a
means to reduce the total inventory cost while maintaining the service level target.
The inventory cost reduction ranges from 39.69% to 72.85%, with the minimum
service level of 98.48%.
ACKNOWLEDGEMENT
Praise to the Lord, the Almighty, and Holy Mary for all grace, guidance, and
blessing author can finish this final
research entitled “
Improvement of Inventory
Control Systems for Raw Material in a Make-To-Order Company
” in Industrial
Engineering Department of Institut Teknologi Sepuluh Nopember (ITS) Surabaya.
This final research is one of the requirements to finish undergraduate study and to
achieve Bachelor degree.
During the study and the completion of this final research, the author receives
countless support, motivation, inspiration, help, and love from various people and
societies; the author is sincerely grateful to them. Hence, the author would like to
use this opportunity to express gratitude to those who contribute the most and play
important role, namely:
1.
Antonius Herlambang Gunawan and Siany Yulianti, as the most beloved
parents; Sheraphine Friska Gunawan, as the greatest sister in this universe;
Surjowati and Siantara, as the best grandparents; Alodia Emily, as the cutest
and most beautiful niece; Dody Tanujaya, as the kindest brother-in-law; also
all author’s family
who have always been there supporting author physically
and mentally at all times. May in future the author can repay your love with
success and achievements.
2.
Prof. Ir. I Nyoman Pujawan, M. Eng., Ph. D., CSCP., as supervisor, head of
laboratory and the best lecturer for the author, under whose great guidance,
conducive discussion, patient supervision, and wise advises in tutoring for the
whole time, this final research along with author’s undergrad
uate study can
finish on time.
3.
Prof. Ir. Budi Santosa, M. Sc., Ph. D., as head of Department of Industrial
Engineering and Putu Dana Karningsih ST., M. Eng. Sc., Ph. D., as secretary
of Department of Industrial Engineering, whose support and advise have
helped the author during undergraduate study much.
4.
Dr. Nurhadi Siswanto, Naning Aranti Wessiani ST. MT., Prof. Iwan Vanany,
whose constructive suggestions and valuable feedbacks have directed and
completed this research.
5.
Dr. Imam Baihaqi, Dr. Iwan Vanany, Dr. Ahmad Rusdiansyah, and Ms. Niniet
Indah Arvietrida, as lecturer members of Laboratory of Logistics and Supply
Chain Management (LSCM), whose motivating advices, inspiring guidance
and supportive coordination during the duty as laboratory assistant.
6.
All faculty lecturers, academic staffs, and members of Department of
Indus-trial Engineering of Institut Teknologi Sepuluh Nopember (ITS) Surabaya, for
all knowledge, experiences, and helps during the years of study.
7.
Assistants of LSCM laboratory alumni amd alumnae: Alvin, Mansur, Hendy,
Ratri, Evi, Ketut, Karina, Galuh, whose support always given to author;
friends: Gio, Reika, Gane, Putri, Kelvin, Ivana, Winda, Stefan, Erza, Rosa,
Khara, Octadella, Wahyu, Elsa, Doni, and Nurulita, whose cheers and jokes
always give fresh air to the laboratory; and three beloved pals who has been
graduated earlier: Aulia, Troy, and Reby who also have motivated author to
compose this research.
8.
Lintang, W
ilson, and Fefe, who have become author’s best friends since
junior high school; Andre, Richardus, Katherine, Vania, Bravo, and Felita,
who often hang out together during university life; Jessica Tjan, Chelsea,
Teddy, Tatum, Fransisca, Lui, Josephine, Vendy, Stephen Alvin and Vincent
G. who also always give supports and cheer author up during hard times. All
this life would not be as meaningful and colorful as it is if it was not because
of you all. Deepest gratitude also towards all of high school friends whom
author cannot say one by one.
9.
Fellow of International Class members, who have gone through hardships and
sufferings together from the very first semester. Studies, projects, practicums,
and exams are way easier to be gone through with all of you.
10.
Dear Veresis, Industrial Engineering students class of 2011, as best buddies,
who have always been there through happiness and sadness, during this
undergraduate study. Especially for people who always the author can count
Nofinda, Linggar, Nindya, Agustin, Satrio, Andre, Dazen, Chrisman, Ananda
Riska, Indah, Ovita, and Ines.
11.
All professors and friends, during exchange student programs to Malaysia and
South Korea who has helped author a lot, enriched author with tons of new
knowledge, and welcomed author to feel homey.
12.
All best friends during the study in Dankook University, South Korea. Global
Talent Network (GTN) community members, my buddies, classmates who
have awesome teamwork during the program, whom I could not mention
individually.
13.
My brothers and sisters from other mothers, Jang-Pyo Hong, Hong-Ki Kim,
Yong-Ki Kim, Hye-Min Sim, Byung-In Jung, Hee-Bum Yang, Ha-Yun Kim,
Jin-Byul Jang, Ye-Bin Kim, Ah-Rong Jang, Kyung-Seok Lee, Sang-Yeop
Dong, Eun-Young Park, Ji-Hyun Lim, Dong-San Han, Sung-Kyu Kim,
Ju-Won Park, Ha-Young Lee, Youn-Jung Lee, Hae-Young Lee, Seung-Hee Han,
and Hyo-Jae Jung, who always support and give countless love.
14.
Everyone else whom author cannot mention explicitly due to the limit of this
acknowledgement. The most sincere gratitude is expressed towards you all.
May success and happiness be with us all of the time.
Last of all, author realizes that this research is far from perfect. Therefore, the
author looks forward for positive suggestions and constructive critics from
anyone. May this research contribute to academic world and provide
improvements for better future.
Surabaya, Indonesia, 18 June 2015
TABLE OF CONTENTS
ABSTRACT ... i
ACKNOWLEDGEMENT ... iii
LIST OF TABLES ... xi
LIST OF FIGURES ... xiv
CHAPTER I INTRODUCTION ... 1
1.1
Background ... 1
1.2
Problem Formulation ... 4
1.3
Objectives ... 4
1.4
Benefits ... 5
1.5
Scope ... 5
1.5.1
Limitations ... 5
1.5.2
Assumptions ... 5
1.6
Report Outline ... 5
CHAPTER II LITERATURE REVIEW ... 7
2.1
Inventory ... 7
2.2
ABC Analysis ... 10
2.3
Monte Carlo Simulation ... 11
2.4
Customer Service Level ... 12
2.5
Inventory Control System ... 13
2.5.1
Continuous Review (s, Q System) ... 13
2.5.2
Periodic Review ... 15
2.6
Previous Researches ... 16
CHAPTER III RESEARCH METHODOLOGY ... 19
3.1
Data Collection Phase ... 20
3.2
Data Processing Phase... 20
3.2.1
Data Processing ... 20
3.2.2
Scenario Generation and Experiment ... 21
CHAPTER IV DATA COLLECTION AND PROCESSING ... 23
4.1
Data Collection ... 23
4.1.1
Demand History ... 23
4.1.2
Purchasing History ... 23
4.1.3
Material Usage History ... 23
4.2
Data Processing ... 24
4.2.1
Raw Material Classification ... 24
4.2.2
Cost Calculation ... 26
4.2.3
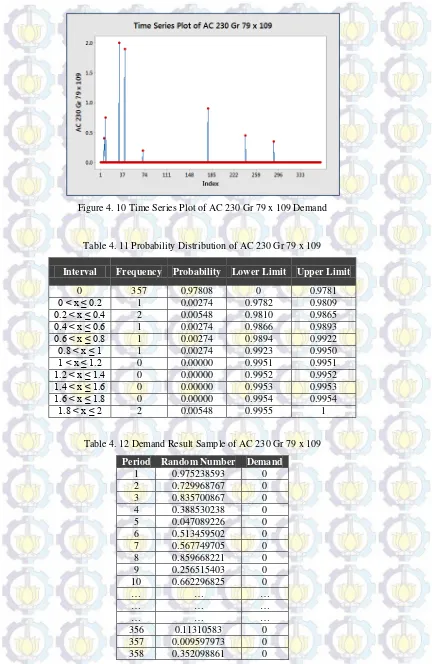
Generate Demand ... 28
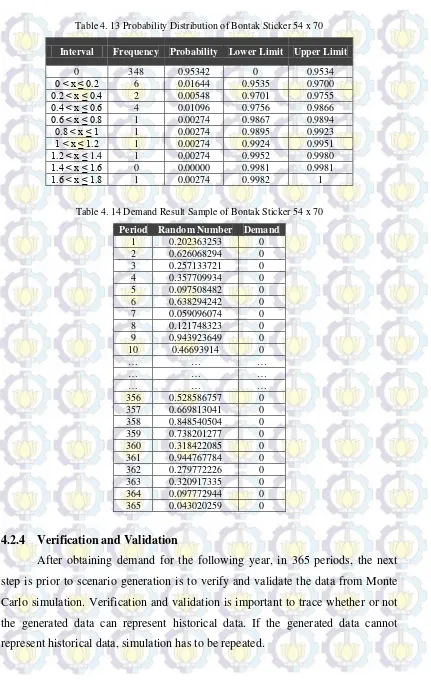
4.2.4
Verification and Validation ... 38
4.2.5
Generate Lead Time ... 40
4.3
Scenario Generation and Experiment ... 44
4.3.1
Number of Replication ... 45
4.3.2
Existing Inventory Control System ... 46
4.3.3
Continuous Review (s, Q System) ... 53
4.3.4
Periodic Review (R, s, S System) ... 61
4.3.5
Heuristic Method for Continuous Review (s, Q System) ... 67
4.3.6
Heuristic Method for Periodic Review (R, s, S System) ... 73
4.4
Holding Cost Justification ... 78
CHAPTER V ANALYSIS AND INTERPRETATION ... 79
5.1
Raw Material Classification ... 79
5.2
Inventory Control System for AC 260 Gr 79 x 109 ... 80
5.3
Inventory Control System for DC 400 Gr 79 x 109 ... 82
5.4
Inventory Control System for DC 250 Gr 89 x 120 ... 84
5.5
Inventory Control System for AC 360 Gr 79 x109 ... 85
5.6
Inventory Control System for AC 230 Gr 79 x 109 ... 87
5.7
Inventory Control System for Bontak Sticker 54 x 70 ... 89
5.8
Inventory Cost Reduction and Service Level Comparison ... 91
CHAPTER VI CONCLUSION AND RECOMMENDATION ... 93
6.1
Conclusion ... 93
BIBLIOGRAPHY ... xvii
APPENDIX A ... xix
APPENDIX B ... xxi
APPENDIX C ... lvii
APPENDIX D ... lix
APPENDIX E ... xcv
APPENDIX F ... xcvii
APPENDIX G ... cxxxiii
LIST OF TABLES
Table 2. 1 The Cost of Surplus Inventory ... 7
Table 2. 2 Comparison between Previous and Current Researches ... 17
Table 3. 1 Design of Scenarios
………..………
21
Table 4. 1 Raw Materials Classification ... 24
Table 4. 2 Daily Holding Cost per Unit for Each Sample ... 27
Table 4. 3 Probability Distribution of AC 260 Gr 79 x 109 ... 29
Table 4. 4 Demand Result Sample of AC 260 Gr 79 x 109 ... 30
Table 4. 5 Probability Distribution of DC 400 Gr 79 x 109 ... 31
Table 4. 6 Demand Result Sample of DC 400 Gr 79 x 109 ... 31
Table 4. 7 Probability Distribution of DC 250 Gr 89 x 120 ... 33
Table 4. 8 Demand Result Sample of DC 250 Gr 89 x 120 ... 33
Table 4. 9 Probability Distribution of AC 360 Gr 79 x109 ... 34
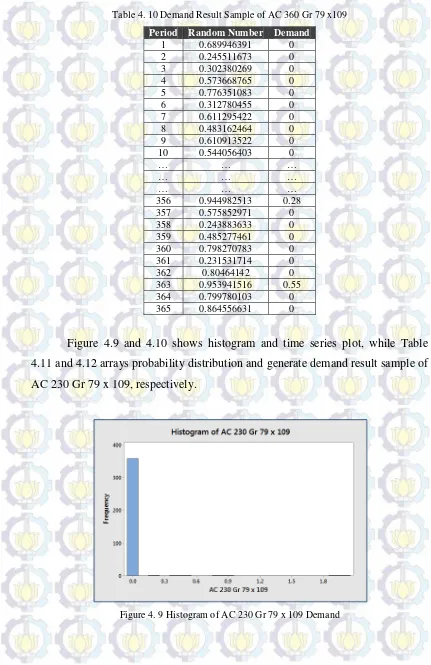
Table 4. 10 Demand Result Sample of AC 360 Gr 79 x109 ... 35
Table 4. 11 Probability Distribution of AC 230 Gr 79 x 109 ... 36
Table 4. 12 Demand Result Sample of AC 230 Gr 79 x 109 ... 36
Table 4. 13 Probability Distribution of Bontak Sticker 54 x 70 ... 38
Table 4. 14 Demand Result Sample of Bontak Sticker 54 x 70 ... 38
Table 4. 15 Validation Input Parameters ... 40
Table 4. 16 Recapitulation of Simulation Data Validation Results ... 40
Table 4. 17 Lead Time Probability Distribution of AC 260 Gr 79 x 109 ... 40
Table 4. 18 Lead Time Result Sample of AC 260 Gr 79 x 109 ... 41
Table 4. 19 Lead Time Probability Distribution of DC 400 Gr 79 x 109 ... 41
Table 4. 20 Lead Time Result Sample of DC 400 Gr 79 x 109 ... 41
Table 4. 21 Lead Time Probability Distribution of DC 250 Gr 89 x 120 ... 42
Table 4. 22 Lead Time Result Sample of DC 250 Gr 89 x 120 ... 42
Table 4. 23 Lead Time Probability Distribution of AC 360 Gr 79 x 109 ... 42
Table 4. 24 Lead Time Result Sample of AC 360 Gr 79 x 109 ... 43
Table 4. 25 Lead Time Probability Distribution of AC 230 Gr 79 x 109 ... 43
Table 4. 26 Lead Time Result Sample of AC 230 Gr 79 x 109 ... 43
Table 4. 27 Lead Time Probability Distribution of Bontak Sticker 54 x 70 ... 44
Table 4. 28 Lead Time Result Sample of Bontak Sticker 54 x 70 ... 44
Table 4. 29 Initial Recapitulation Demand Output ... 45
Table 4. 30 Required Number of Replication for Each Sample ... 46
Table 4. 31 Replication 1 of AC 260 Gr 79 x 109 Existing Inventory Control System ... 47
Table 4. 32 Recapitulation of AC 260 Gr 79 x 109 Existing Inventory Control System ... 47
Table 4. 34 Recapitulation of DC 400 Gr 79 x 109 Existing Inventory Control System ... 48
Table 4. 35 Replication 1 of DC 250 Gr 89 x 120 Existing Inventory Control System ... 49
Table 4. 36 Recapitulation of DC 250 Gr 89 x 120 Existing Inventory Control System ... 50
Table 4. 37 Replication 1 of AC 360 Gr 79 x 109 Existing Inventory Control System ... 50
Table 4. 38 Recapitulation of AC 360 Gr 79 x 109 Existing Inventory Control System ... 51
Table 4. 39 Replication 1 of AC 230 Gr 79 x 109 Existing Inventory Control System ... 51
Table 4. 40 Recapitulation of AC 230 Gr 79 x 109 Existing Inventory Control System ... 52
Table 4. 41 Replication 1 of Bontak Sticker 54 x 70 Existing Inventory Control System ... 52
Table 4. 42 Recapitulation of AC 230 Gr 79 x 109 Existing Inventory Control System ... 53
Table 4. 43 Parameters in Continuous Review for All Samples ... 54
Table 4. 44 Replication 1 of AC 260 Gr 79 x 109 Continuous Review ... 54
Table 4. 45 Recapitulation of AC 260 Gr 79 x 109 Continuous Review ... 55
Table 4. 46 Replication 1 of DC 400 Gr 79 x 109 Continuous Review ... 55
Table 4. 47 Recapitulation of DC 400 Gr 79 x 109 Continuous Review ... 56
Table 4. 48 Replication 1 of DC 250 Gr 89 x 120 Continuous Review ... 57
Table 4. 49 Recapitulation of DC 250 Gr 89 x 120 Continuous Review ... 57
Table 4. 50 Replication 1 of AC 360 Gr 79 x 109 Continuous Review ... 58
Table 4. 51 Recapitulation of AC 360 Gr 79 x 109 Continuous Review ... 58
Table 4. 52 Replication 1 of AC 230 Gr 79 x 109 Continuous Review ... 59
Table 4. 53 Recapitulation of AC 230 Gr 79 x 109 Continuous Review ... 59
Table 4. 54 Replication 1 of Bontak Sticker 54 x 70 Continuous Review ... 60
Table 4. 55 Recapitulation of Bontak Sticker 54 x 70 Continuous Review ... 61
Table 4. 56 Parameters in Periodic Review for All Samples ... 61
Table 4. 57 Replication 1 of AC 260 Gr 79 x 109 Periodic Review ... 62
Table 4. 58 Recapitulation of AC 260 Gr 79 x 109 Periodic Review... 62
Table 4. 59 Replication 1 of DC 400 Gr 79 x 109 Periodic Review ... 63
Table 4. 60 Recapitulation of DC 400 Gr 79 x 109 Periodic Review... 64
Table 4. 61 Replication 1 of DC 250 Gr 89 x 120 Periodic Review ... 64
Table 4. 62 Recapitulation of DC 250 Gr 89 x 120 Periodic Review... 65
Table 4. 63 Replication 1 of AC 360 Gr 79 x 109 Periodic Review ... 65
Table 4. 64 Recapitulation of AC 230 Gr 79 x 109 Periodic Review... 66
Table 4. 65 Replication 1 of Bontak Sticker 54 x 70 Periodic Review ... 66
Table 4. 66 Recapitulation of Bontak Sticker 54 x 70 Periodic Review ... 67
Table 4. 67 Recapitulation of AC 260 Gr 79 x 109 Continuous Review Heuristic Method ... 68
Table 4. 68 Recapitulation of DC 400 Gr 79 x 109 Continuous Review Heuristic Method ... 68
Table 4. 69 Recapitulation of DC 250 Gr 89 x 120 Continuous Review Heuristic Method ... 69
Table 4. 70 Recapitulation of AC 360 Gr 79 x 109 Continuous Review Heuristic Method ... 70
Table 4. 72 Recapitulation of Bontak Sticker 54 x 70 Continuous Review Heuristic Method ... 72
Table 4. 73 Recapitulation of AC 260 Gr 79 x 109 Periodic Review Heuristic Method ... 73
Table 4. 74 Recapitulation of DC 400 Gr 79 x 109 Periodic Review Heuristic Method ... 74
Table 4. 75 Recapitulation of DC 250 Gr 89 x 120 Periodic Review Heuristic Method ... 75
Table 4. 76 Recapitulation of AC 360 Gr 79 x 109 Periodic Review Heuristic Method ... 76
Table 4. 77 Recapitulation of AC 230 Gr 79 x 109 Periodic Review Heuristic Method ... 76
Table 4. 78 Recapitulation of Bontak Sticker 54 x 70 Periodic Review Heuristic Method ... 77
LIST OF FIGURES
Figure 1. 1 Indonesia Printing and Paper Craft Export Quantity ... 2
Figure 1. 2 Inventory Carrying Cost Distribution ... 3
Figure 2. 1 Inventory Costs Trade-
Off ………
9
Figure 2. 2 Continuous Review Inventory Control S
ystems ………
14
Figure 2. 3 Periodic Review Inventory Control Systems
………..
15
Figure 3. 1 Flowchart of Research Methodology
………..
19
Figure 5. 1 Scatter Plot of AC 260 Gr 79 x 109 Total Inventory Cost Comparison ...
81
Figure 5. 2 Scatter Plot of DC 400 Gr 79 x 109 Total Inventory Cost Comparison ...
83
Figure 5. 3 Scatter Plot of DC 250 Gr 89 x 120 Total Inventory Cost Comparison ...
85
Figure 5. 4 Scatter Plot of AC 360 Gr 79 x 109 Total Inventory Cost Comparison ...
87
Figure 5. 5 Scatter Plot of AC 230 Gr 79 x 109 Total Inventory Cost Comparison ...
89
AUTHOR’S BIOGRAPHY
The author, Robertus Willy Gunawan, was born in
Surabaya, Indonesia on 20
th
April 1993. The last child of
Antonius Herlambang Gunawan and Siany Yulianti,
author went to St. Clara Surabaya Elementary School
(1999-2005) and continued to St. Mary Surabaya Junior
High School (2005-2008). For senior high school, the
author completed the study in St. Louis I Surabaya
(2008-2011). During his high school years, the author
was actively involved in organizations and activities.
The author was in sports and arts department of school organization (2006-2007),
as well as became school magazine journalist and photographer (2007-2008). In
2010, the author represented Indonesia as a delegate in International
Environmental Caretakers conference. Several awards, such as second runner up
in Petra Christian University Industrial Competition (2010), second runner up in
University of Surabaya Industrial Games XIX (2010), and second runner up in
University of Surabaya Business Economics Challenge (2011) had encouraged the
author to study further in Industrial Engineering major in Institut Teknologi
Sepuluh Nopember (ITS) Surabaya.
As a university student, the author was selected for exchange student
program twice; one semester to Universiti Teknikal Melaka, Malaysia (2013), one
semester to Dankook University Cheonan Campus, South Korea (2014). After
returning to home country, the author had been actively engaged in several
projects with lecturers. The author was also a laboratory assistant in Laboratory of
Logistics and Supply Chain Management (LSCM) where he helped the faculty
members in laboratory activities for students and industrial practitioners
(2014-2015). With his interest in Logistics and Supply Chain Management field, the
author was an intern at Japanese company, Toyota Auto2000, Department of
CHAPTER I
INTRODUCTION
This chapter contains the background, problem formulation, objectives,
benefits, and research scope. In the last part of this chapter, report outline of the
research is explained.
1.1 Background
The issue of ASEAN Economic Community (AEC), which will start in
December 2015, gives influential impacts to national economic condition. In spite
of wide and numerous opportunities that could be enabled by AEC, in some
extents, this could be a huge threat for companies in Indonesia. This issue allows
countries in South East Asia to strive against each other without any barriers,
including free taxes and product flows. Since there are no taxes applied, it is
obvious that countries outside Indonesia would try to come and conquer national
market. Domestic companies have to be aware of this and they should also
strengthen and intensify their export activities.
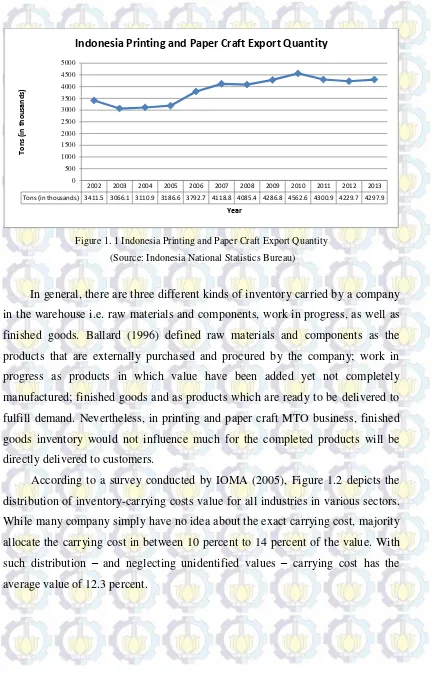
On the authority of Indonesia National Statistics Bureau (2015), annual
printing and paper craft export in Indonesia fluctuated with quite small deviation
for more than a decade starting from 2002. From Figure 1.1, it could be seen that
the trend, however, shows positive increase for the time period. Export quantity
reached its all-time peak in 2010 with almost 4600 tons delivered to foreign
countries, while only 300 tons less were exported in 2013.
Printing and paper craft company could be categorized either as make to
stock (MTS) or make to order (MTO) business. MTS printing and paper craft
companies deal with continuous production and distribution, while MTO
companies deal with customer orders. Owing to the fact that demand uncertainty
from customers is far more unforeseen, MTO businesses suffer worse in order to
design its appropriate inventory control system. In addition, up to this time, there
are very limited researches taking account of MTO businesses. On account of
some considerations explained earlier,
Karya Makmur Baru
Ltd., is chosen as the
Figure 1. 1 Indonesia Printing and Paper Craft Export Quantity
(Source: Indonesia National Statistics Bureau)
In general, there are three different kinds of inventory carried by a company
in the warehouse i.e. raw materials and components, work in progress, as well as
finished goods. Ballard (1996) defined raw materials and components as the
products that are externally purchased and procured by the company; work in
progress as products in which value have been added yet not completely
manufactured; finished goods and as products which are ready to be delivered to
fulfill demand. Nevertheless, in printing and paper craft MTO business, finished
goods inventory would not influence much for the completed products will be
directly delivered to customers.
According to a survey conducted by IOMA (2005), Figure 1.2 depicts the
distribution of inventory-carrying costs value for all industries in various sectors.
While many company simply have no idea about the exact carrying cost, majority
allocate the carrying cost in between 10 percent to 14 percent of the value. With
such distribution
–
and neglecting unidentified values
–
carrying cost has the
average value of 12.3 percent.
2002 2003 2004 2005 2006 2007 2008 2009 2010 2011 2012 2013 Tons (in thousands) 3411.5 3066.1 3110.9 3186.6 3792.7 4118.8 4085.4 4286.8 4562.6 4300.9 4229.7 4297.9
0 500 1000 1500 2000 2500 3000 3500 4000 4500 5000
To
ns
(i
n t
hous
ands
)
Year
Figure 1. 2 Inventory Carrying Cost Distribution
(Source:
“Inventory Carrying Cost: Critical Element in Purchasing Decisions, But Applied
Sparingly,” Supplier Selection & Management Report, (IOMA, New York, February,
2005.), p. 2)
Knowing the fact that carrying inventory in some sort is pricey; it is crucial
for the company to optimize the inventory quantity in order to ensure sufficient
inventory is available to fulfill anticipated demand at a certain service level
through several strategies. The drawback found is to design a strategy that would
minimize both inventory holding cost and backorder cost. Inventory holding cost
occurs when the inventory amount surpasses the requirement, while backorder
cost is found when inventory is unavailable and/or its amount could not fulfill the
demand. For the company, backorder cost is obtained from multiplication of profit
rate and average order value.
Karya Makmur Baru
Ltd. owns a profit rate of 20%
and average order cost of Rp.7,781,508.00, resulting one stock out cost of
Rp.1,556,301.60. An order will be lost once the raw material unavailability period
exceed the agreed tolerance time from the customers.
Currently,
Karya Makmur Baru
Ltd. orders high usage raw material
biweekly, normal usage raw material every month, every three months for low
usage raw material, and/or whenever on hand inventory cannot accommodate the
demand issued by customers. Besides, there is no such scientific calculation done
to determine the order size; company orders approximately five times of average
21.8 2.2
0
6.5
21.8 10.9
13 10.9 6.5
2.2 2.2 0
2.2
0 5 10 15 20 25
Not Specified 0 1 - 4 5 - 9 10 - 14 15 - 19 20 - 24 25 - 29 30 - 34 35 - 39 40 - 44 45 - 49 50 - 54
Number of Responses (%)
demand to cope with order on hand, projected order on hand, and projected order.
This strategy suffers the company for stocking too much raw materials in some
specific time, while losing orders in the others.
In controlling inventory, there are two major strategies that could be
implemented i.e. periodic and continuous review. As its name implies, periodic
review designates a company to check inventory level once every specified time.
In contrast, continuous review has no specific time period and replenishment is
done once the stock level is less than reorder point (ROP). In this research,
existing condition will be evaluated as well as compared to several inventory
control strategy scenarios to assess which strategy suit the company the best. On
top of that, the research also provides company with the total inventory cost
reduction when reccomended inventory control system is implemented.
1.2 Problem Formulation
Based on the background that has been explained in the previous
subchapter, this research is designed to evaluate existing inventory control system
in
Karya Makmur Baru
Ltd., as well as compare it with several other inventory
control systems in order to come up with most efficient inventory control system
for each raw material category. The chosen system should be able to diminish raw
material stock out yet keep the overstock at minimum, resulting the least total
inventory cost.
1.3
Objectives
This research aims at several objectives, which are to:
1.
Determine most efficient inventory control system for each raw material
category.
2.
Provide the company with the information of service level and inventory cost
1.4
Benefits
The benefits from this research are to:
1.
Enrich the company owner with the knowledge and understanding in which
inventory control is one activity that affects
company’s
strategic business.
2.
Minimize total inventory cost that is burdened to the company.
1.5
Scope
The scope of this research is defined by limitations and assumptions.
1.5.1 Limitations
Some limitations set for this research are:
1.
There are three different inventory control systems studied for the company,
which are existing inventory control system, continuous review with (s, Q
system), and periodic review with minimum and maximum stock level (R, s,
S system).
2.
Inventory control system scenarios are only conducted for raw material
inventory; work in process and finished goods inventory are neglected.
1.5.2 Assumptions
Some assumptions set for this research are:
1.
Every order arrives in full quantity with zero defect.
2.
Storage capacity is unlimited.
3.
Demand in the projected year follow
historical data demand’s behaviour.
4.
Raw material could not be added in the middle of production process.
5.
There is no delivery from the previous year that is not yet arrived.
1.6
Report Outline
The following systematic framework will be used in structuring the content of this
CHAPTER I INTRODUCTION
This chapter describes the background, problem formulation, objectives,
benefits, and scope of this research. In the last part of this chapter, report outline
of the research is explained.
CHAPTER II LITERATURE REVIEW
This chapter explains theories and concepts based on existing literatures
that have been developed and are used for the research. Some concepts and
theories provided in the literature reviews are inventory, ABC analysis, Monte
Carlo simulation, customer service level, as well as inventory control system.
CHAPTER III RESEARCH METHODOLOGY
This chapter describes all phases conducted in this research so that the
research could be done systematically. Generally, the research methodology
contains observation and literature study, data collection, data processing,
sensitivity analysis, data interpretation and analysis, and, lastly, conclusion and
recommendation.
CHAPTER IV DATA COLLECTION AND PROCESSING
This chapter includes all processes in order to prepare data to conduct the
experiment. Those processes are data collection, data processing, as well as
scenario generation and experiment.
CHAPTER V ANALYSIS AND INTERPRETATION
This chapter includes analysis and interpretation of the results of all
scenarios that conducted in the previous chapter. Several analyses regarding to
raw material classification and the inventory control system decision for each
sample will be carried out.
CHAPTER VI CONCLUSION AND RECCOMENDATION
This chapter concludes the whole research and contains recommendations
CHAPTER II
LITERATURE REVIEW
This chapter explains theories and concepts based on existing literatures
that have been developed and are used for the research. Some concepts and
theories provided in the literature reviews are inventory, ABC analysis, Monte
Carlo simulation, customer service level, as well as inventory control system.
2.1
Inventory
Inventory is defined as available material, or other tangible assets, stock
on hand, which can be calculated and measured in a specific period of time
(Tersine, 1994). Inventory control and management are common problems, which
are faced by various organizations in economic sector. Generally, inventory exists
in manufacturers, wholesalers, retailers, distributors, hospitals, and many others.
Inventory exists due to uncertainty, location differences, and economical motives
(Pujawan, 2010)
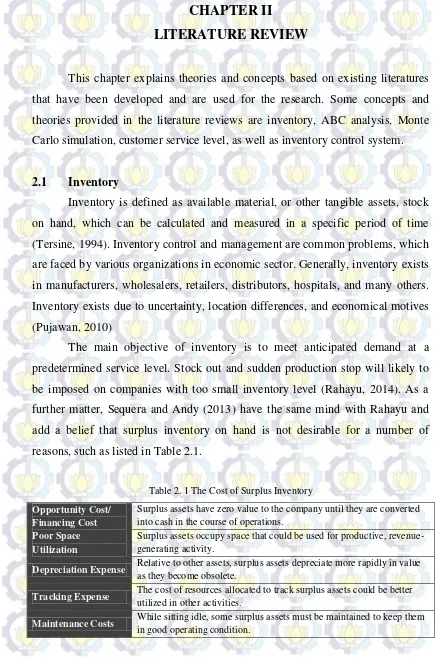
The main objective of inventory is to meet anticipated demand at a
predetermined service level. Stock out and sudden production stop will likely to
be imposed on companies with too small inventory level (Rahayu, 2014). As a
further matter, Sequera and Andy (2013) have the same mind with Rahayu and
add a belief that surplus inventory on hand is not desirable for a number of
reasons, such as listed in Table 2.1.
Table 2. 1 The Cost of Surplus Inventory
Opportunity Cost/
Financing Cost
Surplus assets have zero value to the company until they are converted
into cash in the course of operations.
Poor Space
Utilization
Surplus assets occupy space that could be used for productive,
revenue-generating activity.
Depreciation Expense
Relative to other assets, surplus assets depreciate more rapidly in value
as they become obsolete.
Tracking Expense
The cost of resources allocated to track surplus assets could be better
utilized in other activities.
Table 2.1 The Cost of Surplus Inventory (continued)
Damage and Repair
Surplus inventory is subject to damage in the warehouse resulting in
potential repair costs and potential write-off.
Shrinkage
Surplus inventory is subject to loss and shrinkage.
Insurance Costs
Surplus assets must be insured against damage.
Higher Taxes
Surplus assets may increase the company’s property tax.
Lower ROA
Surplus assets reduce a company’s ROA
(Return on Assets). A low
ROA represents inefficiencies and impacts stock price.
Source: (Sequera and Andy, 2013)
Tersine (1994) believes inventory has several key functions in fulfilling
company’s needs, including:
1.
Minimize the risk of raw materials, or any other desired goods, delivery
lateness which could disturb production process.
2.
Minimize the risk of accepting low quality raw materials, or any other
goods, which have been ordered.
3.
Minimize the risk of inflation.
4.
Minimize the risk of stock out that leads to lost sales.
5.
Maintain customer’s goodwill (opportunity cost).
6.
Increase customer service level, since availability of product gets higher.
7.
Can be allocated to stock seasonal raw material so that company will not
suffer from raw material scarcity in market.
According to Ballou (2004), there are three main costs that influence the
decision of inventory control system. Those costs are procurement cost, carrying
cost, and stock out cost. Those costs are co-relational and Figure 2.1 exhibits the
Figure 2. 1 Inventory Costs Trade-Off (Ballou, 2004)
a.
Procurement Cost
When an order is placed, there are several relevant costs related to
procurement costs, such as: setup order cost, delivery cost, and order cost.
Transportation cost can be categorized inside or outside procurement cost,
subject to each company. Costs included in procurement cost are mostly
fixed and not sensitive to order size. However, such costs as material
handling cost and transportation cost is not fixed because it depends of the
order size.
b.
Carrying Cost
There are four cost categories included in carrying cost, which are:
space cost, capital cost, inventory service cost, and inventory risk cost.
Each category is explained such as follows.
Space Cost
When company uses outsource warehouse, space cost is
measured based on materials weight and/or volume in certain period
of time. In case the company solely owns the warehouse, space cost
captures operational activity in the warehouse.
Capital Cost
Capital cost occurs because of goods value. Even though the
cost is intangible and very subjective compared to other carrying
inventory cost (Ballou, 2004). To some extent, capital cost is
relatively difficult to be measured and several approaches (e.g. hurdle
rate or average return on investment) are implemented to calculate
this.
Inventory Service Cost
Insurance and tax are covered in inventory service cost.
Insurance is an attempt to protect goods in warehouse from
combustion, natural disaster, and robbery. On the other hand, tax is
little part of the total cost in which company is responsible to pay for.
Inventory Risk Cost
Inventory risk cost is originated from depreciation value of the
goods, including ceasing to function. Inventory risk cost value is
estimated from expenditure burdened to company to rework the goods
as a means to make them functioned and can be used for production
process or sold to customers.
c.
Stock Out Cost
Stock out cost can be distinguished into two different
terminologies, which are lost sales and back order. Lost sales terminology
used when customers cannot obtain their desired good in a point of time
and they decided not to wait until when it is available. On the contrary,
back order is a condition when customers do not mind to long for goods
availability. In such case, sales is not lost but only postponed. As a result
of it, several additional transportation cost and inventory cost might be
found.
2.2
ABC Analysis
Product classification is essential in multi-product inventory system
(Nahmias, 2009). ABC classification, also known as ABC analysis, in fact, is an
efficient and most widely employed technique for inventory classification in
inventory items in one year. This analysis that is based on Pareto principal is an
easy to understand method (Torabi, et. al, 2012).
ABC Analysis divides the inventory items into the three classes (Ballou,
1998). Those classes are defined as such.
1.
A class (most important) is a class consists 20% of the total item number,
which contribute to 80% of the total value.
2.
B class (less important) is a class consists 30% of the total item number, which
contribute to 15% of the total value.
3.
C class (least important) is a class consists 50% of the total item number,
which contribute only to 5% of the total value.
ABC analysis method is carried out following several steps, such as
explained.
1.
Determine annual usage value by multiplying unit price and annual usage unit.
2.
Sort the items in descending order, starting from the item that has biggest
usage percentage relative to total annual spending.
3.
Calculate the relative cumulative annual spending.
4.
Determine items that categorized in class A, class B, and class C, based on the
specified bound.
2.3
Monte Carlo Simulation
Monte Carlo simulation is defined as a kind of simulation that relies on
repeated random sampling and statistical analysis to generate results. This method
of simulation is much related to random experiments, experiments for which the
specific result is not known in advance. Monte Carlo simulation is very helpful to
methodically investigate the complete range of risk associated with each risky
input variable (Raychaudhuri, 2008).
The following steps are commonly performed for the Monte Carlo
simulation of a physical process.
1.
Observing and recording variable inputs that are used for generating results.
2.
Defining probability distribution of main variables.
4.
Determining interval for each variable.
5.
Generating random value for cumulative distribution probability to obtain
variable value to be used in simulation.
6.
Reiterating the simulation continuously.
2.4
Customer Service Level
Customer service level is the desired probability not to face stock outs in
ordering cycle (Lee & Larry, 2004). In many cases, customer service level is one
of key performance indexes to measure supply chain reliability. Based on the
explanation of Yoo, et al. (2008), customer service level indicates the ability of
company to fulfill demand from customers using on hand stock. The higher
customer service level specified by a company, the more inventories needed to be
stocked. Indeed, this lead to extortionate inventory cost.
Two common service level parameters used are service per order cycle
and service per units demanded.
1.
Service per Order Cycle
Service level which is calculated from service per order cycle frequency
depicts the probability of stock out during lead time. This approach
emphasizes on how often service per order cycle occurs. In another word,
service per order cycle (SL
c
) is defined as the fraction of order cycle
without stock out.
SL
c
1
number of cycles with stockout
total number of order cycle
(2.1)
SL
c
1
P
(
M
B
)
Where P(M>B) is the probability of stock out during lead time.
2.
Service per Units Demanded
Service level which is calculated from service per units demanded
captures the number of stock outs during lead time. Service per units
SL
u
1
number of stockout units
total number of demand units
(2.2)
)
(
1
P
M
B
SL
u
Where P (M>B) is the probability of stock out during lead time.
2.5
Inventory Control System
In inventory control system, it is essential to determine several
fundamen-tals, such as: how often the inventory control has to be monitored, replenishment
time, and order size (Silver & Peterson, 1998). There are two inventory control
system are often used in practice, those are continuous review and periodic
review.
2.5.1 Continuous Review (s, Q System)
As the name implies, continuous review system, also referred to perpetual
system and fixed-order-quantity system, has an approach to continuously track
and check inventory level. An order is placed following certain order lot size (Q)
once the level is reached predetermined inventory reorder point (ROP); whenever
the inventory on hand decreases to ROP
,
a new order is placed to replenish the
stock of inventory (Russel and Taylor, 2000). In continuous review system, when
demand and lead-time are not uncertain, safety stock is added as a hedge against
stock out.
In this research, heuristic simulations for (s, Q) system are carried out in
order to obtain optimum decision variables. Reorder point is annotated as s, while
Figure 2. 2 Continuous Review Inventory Control Systems (Russel and Taylor, 2000)
Here are the inventory profiles in continuous review (Tersine, 1994):
√
(2.3)
SS
Z
(
d)
2L
(
L)
2d
2(2.4)
D
L
= d . L
(2.5)
ROP = SS + D
L
(2.6)
Where,
Q
*
= optimum order size
µ
= average annual demand
k
= order cost per lot
h
= holding cost per unit per year
SS
= safety stock
Z
= normsiv of service level
σ
d
= standard deviation of daily demand
σ
L
= standard deviation of lead time
D
L
= average demand during lead time
d
= average demand per period
L
= average lead time of replenishment
The advantage of continuous review is to address the situation where
demand is high but the disadvantage is variable order quantity. The supplier can
make mistakes more often and they would prefer the customers who ordered the
fixed order quantity.
2.5.2 Periodic Review
Periodic review, also referred to as a fixed-time-period system, indicates
that inventory status tracked at regular periodic intervals and reorder was made to
raise the inventory level to the point of a predefined (Russel and Taylor, 2000). In
other words, order size is flexible and placed every specified period of time.
Figure 2. 3 Periodic Review Inventory Control Systems (Russel and Taylor, 2000)
Here are the inventory profiles in periodic review (Tersine, 1994):
√
(2.7)
√
(2.8)
D
T+L
= d (T + L)
(2.9)
OUL
= SS + D
T+L
(2.10)
Where,
T
*
= optimum review interval
D
T+L
= average demand during T+L
In this system, the inventory level is not necessarily monitored at all time,
so it leads to less or even no record keeping required. In contrast, the main
drawback is limited direct control. This typically results in larger inventory levels
for a periodic inventory system compared to continuous system to guard against
unexpected stock outs early in the fixed period. Such a system also requires that a
new order quantity be determined each time a periodic order is made.
2.5.2.1 Order-up-to-Level (R, S) System
Order-up-to-level system reviews inventory level with the interval of R
period. In every review, replenishment is placed so that inventory level can be
arose to Rahayu (2014) states that order-up-to-level system is only suitable for
anticipating demand that follows normal or Poisson distribution.
2.5.2.2 Combination between (s, S) and (R, S) System: (R, s, S) System
In previous inventory control system, demand is assumed to follow normal
or Poisson distribution. Since the demand in make-to-order companies does not
show any trend or patterns (lumpy), order-up-to-level inventory control system is
not appropriate.
In this research, (R, s, S) system, is chosen for periodic review inventory
control system. Heuristic simulations are carried out as a means to find optimum
decision variables. R is defined as review period interval, s is reorder point, and S
is maximum level of inventory. In this system, once inventory level reach s point,
order is placed to bring the inventory level to S. Conversely, when it has not
reached s point, company does not replenish the inventory until the following
review period R.
2.6
Previous Researches
There have been several researches with inventory control system issue
conducted. However, inventory control system for make to stock company has
rarely been studied. In most cases, researches only focus on consumable products.
Table 2.2 summarizes and compares previous researches conducted with this
CHAPTER III
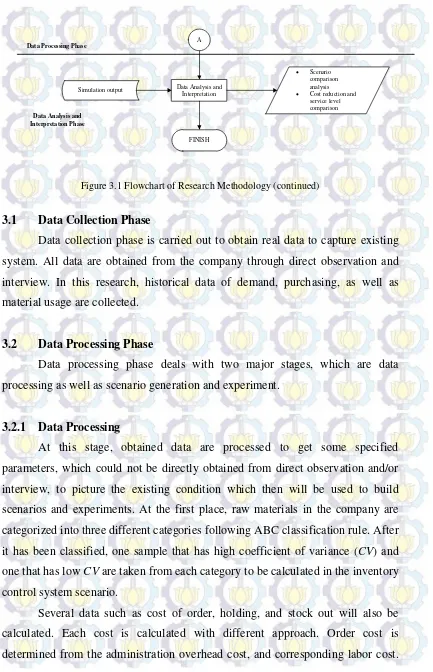
RESEARCH METHODOLOGY
This chapter describes all phases conducted in this research so that the
research could be done systematically. Generally, the research methodology
contains literature study, data collection, data processing, scenario generation and
experiment, data analysis and interpretation, and, lastly, conclusion and
recommendation.
The flowchart of this research methodology is given as follows.
START
Data Collection
Data Processing
Demand history
Purchasing history
Material usage history Data
needed
ABC analysis
Monte Carlo simulation
Demand history
Purchasing history
Material usage history
Raw material classification
Forecasted demand
Raw material lead time
Order cost
Holding cost
Stock out cost
Scenario Generation and Experiment
Continuous revew
Periodic review Existing inventory control
system
Raw material classification
Forecasted demand
Raw material lead time
Order cost
Holding cost
Stock out cost
Simulation output (total cost) Data Collection Phase
Data Processing Phase
A
Data Analysis and Interpretation Simulation output
Scenario comparison analysis
Cost reduction and service level comparison
FINISH Data Processing Phase
Data Analysis and Interpretation Phase
A