Editor-in-chief Further volumes of this series can be found on our homepage: springer.com
Vol. 86. Zbigniew Les and Mogdalena Les Shape Understanding Systems, 2008 ISBN 978-3-540-75768-9
Vol. 87. Yuri Avramenko and Andrzej Kraslawski Case Based Design, 2008
ISBN 978-3-540-75705-4
Vol. 88. Tina Yu, David Davis, Cem Baydar and Rajkumar Roy (Eds.)
Evolutionary Computation in Practice, 2008 ISBN 978-3-540-75770-2
Vol. 89. Ito Takayuki, Hattori Hiromitsu, Zhang Minjie and Matsuo Tokuro (Eds.)
Rational, Robust, Secure, 2008 ISBN 978-3-540-76281-2
Vol. 90. Simone Marinai and Hiromichi Fujisawa (Eds.) Machine Learning in Document Analysis
and Recognition, 2008 ISBN 978-3-540-76279-9
Vol. 91. Horst Bunke, Kandel Abraham and Last Mark (Eds.) Applied Pattern Recognition, 2008
ISBN 978-3-540-76830-2
Vol. 92. Ang Yang, Yin Shan and Lam Thu Bui (Eds.) Success in Evolutionary Computation, 2008 ISBN 978-3-540-76285-0
Vol. 93. Manolis Wallace, Marios Angelides and Phivos Mylonas (Eds.)
Advances in Semantic Media Adaptation and Personalization, 2008
ISBN 978-3-540-76359-8
Vol. 94. Arpad Kelemen, Ajith Abraham and Yuehui Chen (Eds.)
Computational Intelligence in Bioinformatics, 2008 ISBN 978-3-540-76802-9
Vol. 95. Radu Dogaru
Systematic Design for Emergence in Cellular Nonlinear Networks, 2008
ISBN 978-3-540-76800-5
Vol. 96. Aboul-Ella Hassanien, Ajith Abraham and Janusz Kacprzyk (Eds.)
Computational Intelligence in Multimedia Processing: Recent Advances, 2008
ISBN 978-3-540-76826-5
Vol. 97. Gloria Phillips-Wren, Nikhil Ichalkaranje and Lakhmi C. Jain (Eds.)
Intelligent Decision Making: An AI-Based Approach, 2008 ISBN 978-3-540-76829-9
Vol. 98. Ashish Ghosh, Satchidananda Dehuri and Susmita Ghosh (Eds.)
Multi-Objective Evolutionary Algorithms for Knowledge Discovery from Databases, 2008
ISBN 978-3-540-77466-2
Vol. 99. George Meghabghab and Abraham Kandel Search Engines, Link Analysis, and User’s Web Behavior, 2008
ISBN 978-3-540-77468-6
Vol. 100. Anthony Brabazon and Michael O’Neill (Eds.) Natural Computing in Computational Finance, 2008 ISBN 978-3-540-77476-1
Vol. 101. Michael Granitzer, Mathias Lux and Marc Spaniol (Eds.)
Multimedia Semantics - The Role of Metadata, 2008 ISBN 978-3-540-77472-3
Vol. 102. Carlos Cotta, Simeon Reich, Robert Schaefer and Antoni Ligeza (Eds.)
Knowledge-Driven Computing, 2008 ISBN 978-3-540-77474-7 Vol. 103. Devendra K. Chaturvedi
Soft Computing Techniques and its Applications in Electrical Engineering, 2008
ISBN 978-3-540-77480-8
Vol. 104. Maria Virvou and Lakhmi C. Jain (Eds.) Intelligent Interactive Systems in Knowledge-Based Environment, 2008
ISBN 978-3-540-77470-9 Vol. 105. Wolfgang Guenthner
Enhancing Cognitive Assistance Systems with Inertial Measurement Units, 2008
ISBN 978-3-540-76996-5
Vol. 106. Jacqueline Jarvis, Dennis Jarvis, Ralph R¨onnquist and Lakhmi C. Jain (Eds.)
Holonic Execution: A BDI Approach, 2008 ISBN 978-3-540-77478-5
Vol. 107. Margarita Sordo, Sachin Vaidya and Lakhmi C. Jain (Eds.)
Advanced Computational Intelligence Paradigms in Healthcare - 3, 2008
ISBN 978-3-540-77661-1 Vol. 108. Vito Trianni
Evolutionary Swarm Robotics, 2008 ISBN 978-3-540-77611-6
Vol. 109. Panagiotis Chountas, Ilias Petrounias and Janusz Kacprzyk (Eds.)
Intelligent Techniques and Tools for Novel System Architectures, 2008
Ilias Petrounias
Janusz Kacprzyk
(Eds.)
Intelligent Techniques
and Tools for Novel System
Architectures
With 192 Figures and 89 Tables
Harrow School of Computer Science The University of Westminster Watford Road
Northwick Park London HA1 3TP UK
Prof. Janusz Kacprzyk Systems Research Institute Polish Academy of Sciences Ul. Newelska 6
01-447 Warsaw Poland
School of Informatics The University of Manchester Oxford Road
Manchester M13 9PL UK
ISBN 978-3-540-77621-5 e-ISBN 978-3-540-77623-9
Studies in Computational Intelligence ISSN 1860-949X
Library of Congress Control Number: 2008920251
c
2008 Springer-Verlag Berlin Heidelberg
This work is subject to copyright. All rights are reserved, whether the whole or part of the material is concerned, specifically the rights of translation, reprinting, reuse of illustrations, recitation, broad-casting, reproduction on microfilm or in any other way, and storage in data banks. Duplication of this publication or parts thereof is permitted only under the provisions of the German Copyright Law of September 9, 1965, in its current version, and permission for use must always be obtained from Springer-Verlag. Violations are liable to prosecution under the German Copyright Law.
The use of general descriptive names, registered names, trademarks, etc. in this publication does not imply, even in the absence of a specific statement, that such names are exempt from the relevant protective laws and regulations and therefore free for general use.
Cover design: Deblik, Berlin, Germany Printed on acid-free paper
The purpose of this volume is to foster and present new directions and solu-tions in broadly perceived intelligent systems. The emphasis is on constructive approaches that can be of utmost important for a further progress and imple-mentability.
The volume is focused around a crucial prerequisite for developing and implementing intelligent systems, namely to computationally represent and manipulate knowledge (both theory and information), augmented by an abil-ity to operationally deal with large-scale knowledge bases, complex forms of situation assessment, sophisticated value-based modes of reasoning, and au-tonomic and autonomous system behaviours.
These challenges exceed the capabilities and performance capacity of cur-rent open standards, approaches to knowledge representation, management and system architectures. The intention of the editors and contributors of this volume is to present tools and techniques that can help in filling this gap. New system architectures must be devised in response to the needs of exhibiting intelligent behaviour, cooperate with users and other systems in problem solving, discovery, access, retrieval and manipulation of a wide variety of “data” and knowledge, and reason under uncertainty in the context of a knowledge-based economy and society.
triggered our editorial efforts to collect many valuable inspiring works written by both conference participants and other experts in this new and challenging field.
LONDON P. Chountas
2007 I. Petrounias
Part I Intelligent-Enterprises and Service Orchestration Applying Data Mining Algorithms to Calculate the Quality of Service of Workflow Processes
Jorge Cardoso . . . 3 Utilisation Organisational Concepts and Temporal Constraints for Workflow Optimisation
D.N. Wang and I. Petrounias . . . 19 Extending the Resource-Constrained Project Scheduling
Problem for Disruption Management
J¨urgen Kuster and Dietmar Jannach . . . 43
Part II Intelligent Search and Querying
On the Evaluation of Cardinality-Based Generalized Yes/No Queries
Patrick Bosc, Nadia Ibenhssaien, and Olivier Pivert. . . 65 Finding Preferred Query Relaxations in Content-Based
Recommenders
Dietmar Jannach . . . 81 Imprecise Analogical and Similarity Reasoning
about Contextual Information
Part III Fuzzy Sets and Systems
A Method for Constructing V. Young’s Fuzzy Subsethood Measures and Fuzzy Entropies
H. Bustince, E. Barrenechea, and M. Pagola . . . .123 An Incremental Learning Structure Using Granular
Computing and Model Fusion with Application to Materials Processing
George Panoutsos and Mahdi Mahfouf. . . .139 Switched Fuzzy Systems: Representation Modelling, Stability Analysis, and Control Design
Hong Yang, Georgi M. Dimirovski, and Jun Zhao . . . .155 On Linguistic Summarization of Numerical Time Series
Using Fuzzy Logic with Linguistic Quantifiers
Janusz Kacprzyk, Anna Wilbik, and Slawomir Zadro˙zny. . . .169
Part IV Biomedical and Health Care Systems
Using Markov Models for Decision Support in Management of High Occupancy Hospital Care
Sally McClean, Peter Millard, and Lalit Garg. . . .187 A Decision Support System for Measuring and Modelling
the Multi-Phase Nature of Patient Flow in Hospitals
Christos Vasilakis, Elia El-Darzi, and Panagiotis Chountas. . . .201 Real-Time Individuation of Global Unsafe Anomalies
and Alarm Activation
Daniele Apiletti, Elena Baralis, Giulia Bruno, and Tania Cerquitelli. . . .219 Support Vector Machines and Neural Networks as Marker
Selectors in Cancer Gene Analysis
Michalis E. Blazadonakis and Michalis Zervakis. . . .237 An Intelligent Decision Support System in Wireless-Capsule Endoscopy
Part V Knowledge Discovery and Management Formal Method for Aligning Goal Ontologies
Nacima Mellal, Richard Dapoigny, and Laurent Foulloy. . . .279 Smart Data Analysis Services
Martin Spott, Henry Abraham, and Detlef Nauck. . . .291 Indexing Evolving Databases for Itemset Mining
Elena Baralis, Tania Cerquitelli, and Silvia Chiusano. . . .305 Likelihoods and Explanations in Bayesian Networks
David H. Glass . . . .325 Towards Elimination of Redundant and Well Known Patterns in Spatial Association Rule Mining
Vania Bogorny, Jo˜ao Francisco Valiati, Sandro da Silva Camargo,
Paulo Martins Engel, and Luis Otavio Alvares. . . .343 Alternative Method for Incrementally Constructing
the FP-Tree
Muhaimenul, Reda Alhajj, and Ken Barker. . . .361
Part VI Intuitonistic Fuzzy Sets and Systems
On the Intuitionistic Fuzzy Implications and Negations
Krassimir T. Atanassov. . . .381 On the Probability Theory on the Atanassov Sets
Beloslav Rieˇcan. . . .395 Dilemmas with Distances Between Intuitionistic Fuzzy Sets: Straightforward Approaches May Not Work
Eulalia Szmidt and Janusz Kacprzyk. . . .415 Fuzzy-Rational Betting on Sport Games with Interval
Probabilities
Kiril I. Tenekedjiev, Natalia D. Nikolova, Carlos A. Kobashikawa,
and Kaoru Hirota. . . .431 Atanassov’s Intuitionistic Fuzzy Sets in Classification
of Imbalanced and Overlapping Classes
Representation of Value Imperfection with the Aid of Background Knowledge: H-IFS
Boyan Kolev, Panagiotis Chountas, Ermir Rogova,
and Krassimir Atanassov . . . .473
Part VII Tracking Systems
Tracking of Multiple Target Types with a Single Neural Extended Kalman Filter
Kathleen A. Kramer and Stephen C. Stubberud . . . .495 Tracking Extended Moving Objects with a Mobile Robot
Andreas Kr¨außling . . . .513 A Bayesian Solution to Robustly Track Multiple Objects
from Visual Data
M. Marr´on, J.C. Garc´ıa, M.A. Sotelo, D. Pizarro, I. Bravo,
the Quality of Service of Workflow Processes
Jorge Cardoso
Department of Mathematics and Engineering, 9000-390 Funchal, Portugal [email protected]
Summary. Organizations have been aware of the importance of Quality of Service (QoS) for competitiveness for some time. It has been widely recognized that workflow systems are a suitable solution for managing the QoS of processes and workflows. The correct management of the QoS of workflows allows for organizations to increase customer satisfaction, reduce internal costs, and increase added value services. In this chapter we show a novel method, composed of several phases, describing how organizations can apply data mining algorithms to predict the QoS for their run-ning workflow instances. Our method has been validated using experimentation by applying different data mining algorithms to predict the QoS of workflow.
1 Introduction
The increasingly global economy requires advanced information systems. Busi-ness Process Management Systems (BPMS) provide a fundamental infrastruc-ture to define and manage several types of business processes. BPMS, such as Workflow Management Systems (WfMS), have become a serious competi-tive factor for many organizations that are increasingly faced with the chal-lenge of managing e-business applications, workflows, Web services, and Web processes. WfMS allow organizations to streamline and automate business processes and re-engineer their structure; in addition, they increase efficiency and reduce costs.
One important requirement for BMPS and WfMS is the ability to manage the Quality of Service (QoS) of processes and workflows [1]. The design and composition of processes cannot be undertaken while ignoring the importance of QoS measurements. Appropriate control of quality leads to the creation of quality products and services; these, in turn, fulfill customer expectations and achieve customer satisfaction. It is not sufficient to just describe the logical or operational functionality of activities and workflows. Rather, design of workflows must include QoS specifications, such as response time, reliability, cost, and so forth.
J. Cardoso:Applying Data Mining Algorithms to Calculate the Quality of Service of Workflow Processes, Studies in Computational Intelligence (SCI)109, 3–18 (2008)
One important activity, under the umbrella of QoS management, is the prediction of the QoS of workflows. Several approaches can be identified to predict the QoS of workflows before they are invoked or during their execu-tion, including statistical algorithms [1], simulation [2], and data mining based methods [3, 4].
The latter approach, which uses data mining methods to predict the QoS of workflows, has received significant attention and has been associated with a recent new area coined as Business Process Intelligence (BPI). In this paper, we investigate the enhancements that can be made to previous work on BPI and business process quality to develop more accurate prediction methods.
The methods presented in [3, 4] can be extended and refined to provide a more flexible approach to predict the QoS of workflows. Namely, we intend to identify the following limitations that we will be addressing in this paper with practical solutions and empirical testing:
1. In contrast to [4], we carry out QoS prediction based on path mining and by creating a QoS activity model for each workflow activity. This combination increases the accuracy of workflow QoS prediction.
2. In [4], time prediction is limited since workflow instances can only be classified to “have” or “not to have” a certain behavior. In practice, it means that it is only possible to determine that a workflow instance will have, for example, the “last more than 15 days” behavior or will not have that behavior. This is insufficient since it does not give an actual estimate for the time a workflow will need for its execution. Our method is able to deduce that a workflow wi will probably take 5 days and 35 min to be completed with a prediction accuracy of 78%.
3. In [4], the prediction of the QoS of a workflow is done using decision trees. We will show that MultiBoost Na¨ıve Bayes outperforms the use of decision trees to predict the QoS of a workflow.
This chapter is structured as follows: In Sect. 2, we present our method of carrying out QoS mining based on path mining, QoS activity models, and workflow QoS estimation. Section 3 describes the set of experiments that we have carried out to validate the QoS mining method we propose. Section 4 presents the related work in this area. Finally, Sect. 5 presents our conclusions.
2 Motivation
Nowadays, a considerable number of organizations are adopting workflow management systems to support their business processes. The current systems available manage the execution of workflow instances without any quality of service management on important parameters such as delivery deadlines, re-liability, and cost of service.
be able to predict how long the workflow instance will take to be completed or the cost associated with its execution. Since workflows are non-deterministic and concurrent, the time it takes for a workflow to be completed and its cost depends not only on which activities are invoked during the execution of the workflow instance, but also depends on the time/cost of its activities. Predict-ing the QoS that a workflow instance will exhibit at runtime is a challenge because a workflow schema w can be used to generated n instances, and sev-eral instances wi (i ≤n) can invoke a different subset of activities from w. Therefore, even if the time and cost associated with the execution of activities were static, the QoS of the execution of a workflow would vary depending on the activities invoked at runtime.
For organizations, being able to predict the QoS of workflows has several advantages. For example, it is possible to monitor and predict the QoS of workflows at any time. Workflows must be rigorously and constantly moni-tored throughout their life cycles to assure compliance both with initial QoS requirements and targeted objectives. If a workflow management system iden-tifies that a running workflow will not meet initial QoS requirements, then adaptation strategies [5] need to be triggered to change the structure of a workflow instance. By changing the structure of a workflow we can reduce its cost or execution time.
3 QoS Mining
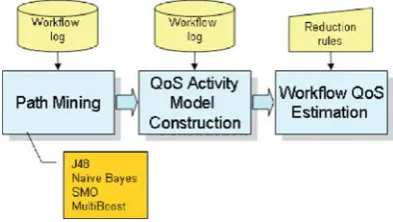
In this section we focus on describing a new method that can be used by organizations to apply data mining algorithms to historical data and predict QoS for their running workflow instances. The method presented in this paper constitutes a major and significant difference from the method described in [4]. The method is composed of three distinct phases (Fig. 1) that will be explained in the following sections.
In the first phase, the workflow log is analyzed and data mining algorithms are applied to predict the path that will be followed by workflow instances at
runtime. This is called path mining. Path mining identifies which activities will most likely be executed in the context of a workflow instance. Once we know the path, we also know the activities that will be invoked at runtime. For each activity we construct a QoS activity model based on historical data which describes the runtime behavior (duration and cost) of an activity. In the last phase, we compute the QoS of the overall workflow based on the path predicted and from the QoS activity models using a set of reduction rules.
3.1 Path Mining
As we have stated previously, the QoS of a workflow is directly dependent on which activities are invoked during its execution. Different sets of activities can be invoked at runtime because workflows are non-deterministic. Path mining [6,7] uses data mining algorithms to predict which path will be followed when executing a workflow instance.
Definition. (Path): A path P is a continuous mapping P: [a, b]→C◦,where P(a) is the initial point, P(b) is the final point, andC◦ denotes the space of continuous functions. A path on a workflow is a sequence{t1, t2, . . . , tn}such that {t1, t2}, {t2, t3}, . . . ,{tn−1, tn} are transitions of the workflow and the tiare distinct. Eachti is connected to a workflow activity.
A path is composed of a set of activities invoked and executed at runtime by a workflow. For example, when path mining is applied to the simple work-flow illustrated in Fig. 2, the workwork-flow management system can predict the probability of paths A, B, and C being followed at runtime. Paths A and B have each six activities, while path C has only four activities. In Fig. 2, the symbol⊕represented non-determinism (i.e., a xor-split or xor-join).
To perform path mining, current workflow logs need to be extended to store information indicating the values and the type of the input parameters
Table 1.Extended workflow log Workflow log extension
. . . Parameter/Value Path
. . . int SSN = 7774443333; string loan-type = “car-loan” . . .
. . .
. . . string name = [email protected]; . . .
{FillLoanRequest, CheckLoanType, CheckCarLoan, ApproveCarLoan, NotifyCarLoanClient, ArchiveApplication}
. . . .
passed to activities and the output parameters received from activities. The values of inputs/outputs are generated at runtime during the execution of workflow instances. Table 1 shows an extended workflow log which accommo-dates input/output values of activity parameters that have been generated at runtime. Each ‘Parameter/Value’ entry as a type, a parameter name, and a value (for example, string loan-type=“car-loan”).
Additionally, the log needs to include path information: a path describing the activities that have been executed during the enactment of a process. This information can easily be stored in the log. From the implementation perspective it is space efficient to store in the log only the relative path, relative to the previous activity, not the full path. Table 1 shows the full path approach because it is easier to understand how paths are stored in the log.
During this phase, and compared to [3,4], we only need to add information on paths to the log. Once enough data is gathered in the workflow log, we can apply data mining methods to predict the path followed by a process instance at runtime based on instance parameters. In Sect. 4.2, we will show how the extended workflow log can be transformed to a set of data mining instances. Each data mining instance will constitute the input to machine learning algorithm.
3.2 QoS Activity Model Construction
After carrying out path mining, we know which activities a workflow instance will be invoking in the near future. For each activity that will potentially be invoked we build what we call a QoS activity model. The model includes information about the activity behavior at runtime, such as its cost and the time the activity will take to execute [1].
future the reliability of applications. The idea is to test the activity based on specific inputs. In an operational profile, the input space is partitioned into domains, and each input is associated with a probability of being selected dur-ing operational use. The probability is employed in the input domain to guide input generation. The density function built from the probabilities is called the operational profile of the activity. At runtime, activities have a probability associated with each input. Musa [9] described a detailed procedure for devel-oping a practical operational profile for testing purposes. In our case, we are interested in predicting, not the reliability, but the cost and time associated with the execution of workflow activities.
During the graphical design of a workflow, the business analyst and domain expert construct a QoS activity model for each activity using activity profiles and empirical knowledge about activities. The construction of a QoS model for activities is made at design time and re-computed at runtime, when activities are executed. Since the initial QoS estimates may not remain valid over time, the QoS of activities is periodically re-computed, based on the data of previous instance executions stored in the workflow log.
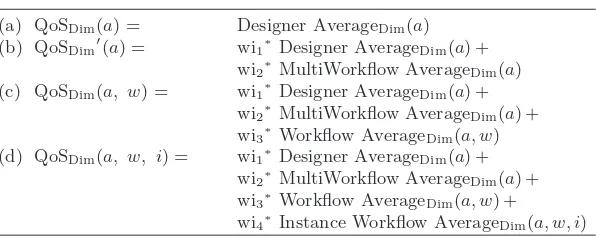
The re-computation of QoS activity metrics is based on data coming from designer specifications (i.e. the initial QoS activity model) and from the work-flow log. Depending on the workwork-flow data available, four scenarios can occur (Table 2) (a) For a specific activity a and a particular dimensionDim (i.e., time or cost), the average is calculated based only on information introduced by the designer (Designer AverageDim(a)); (b) the average of an activity a dimension is calculated based on all its executions independently of the work-flow that executed it (MultiWorkwork-flow AverageDim(a)); (c) the average of the dimension Dim is calculated based on all the times activity a was executed in any instance from workflow w (Workflow AverageDim(t, w)); and (d) the average of the dimension of all the times activitytwas executed in instancei of workfloww(Instance AverageDim(t, w, i)).
Let us assume that we have an instanceiof workflowwrunning and that we desire to predict the QoS of activitya∈w. The following rules are used to choose which formula to apply when predicting QoS. If activitya has never
Table 2.QoS dimensions computed at runtime (a) QoSDim(a) = Designer AverageDim(a) (b) QoSDim′(a) = wi1∗Designer AverageDim(a) +
wi2∗MultiWorkflow AverageDim(a) (c) QoSDim(a, w) = wi1∗Designer AverageDim(a) +
wi2∗MultiWorkflow AverageDim(a) + wi3∗Workflow AverageDim(a, w) (d) QoSDim(a, w, i) = wi1∗Designer AverageDim(a) +
wi2∗MultiWorkflow AverageDim(a) + wi3∗Workflow AverageDim(a, w) +
been executed before, then formula (a) is chosen to predict activity QoS, since there is no other data available in the workflow log. If activity a has been executed previously, but in the context of workflowwn, andw ! =wn, then formula (b) is chosen. In this case we can assume that the execution of a in workflow wn will give a good indication of its behavior in workfloww. If activitya has been previously executed in the context of workfloww, but not from instancei, then formula (c) is chosen. Finally, if activityahas been previously executed in the context of workflow w, and instance i, meaning that a loop has been executed, then formula (d) is used.
The workflow management system uses the formulae from Table 2 to pre-dict the QoS of activities. The weights wik are manually set. They reflect the degree of correlation between the workflow under analysis and other work-flows for which a set of common activities is shared. At this end of this second phase, we already know the activities of a workflow instance that will most likely be executed at runtime, and for each activity we have a model of its QoS, i.e. we know the time and cost associated with the invocation of the activity.
3.3 Workflow QoS Estimation
Once we know the path, i.e. the set of activities which will be executed by a workflow instance, and we have a QoS activity model for each activity, we have all the elements required to predict the QoS associated with the execution of a workflow instance.
To compute the estimated QoS of a process in execution, we use a variation of the Stochastic Workflow Reduction (SWR) algorithm [1]. The variation of the SWR algorithm that we use does not include probabilistic information about transitions. The SWR is an algorithm for computing aggregate QoS properties step-by-step. At each step a reduction rule is applied to shrink the process. At each step the time and cost of the activities involved is computed. This is continued until only one activity is left in the process. When this state is reached, the remaining activity contains the QoS metrics corresponding to the workflow under analysis. For the reader interested in the behavior of the SWR algorithm we refer to [1].
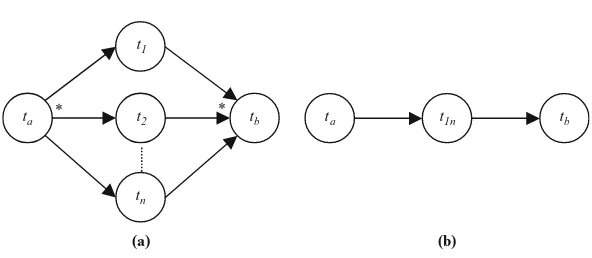
For example, if the path predicted in the first phase of our QoS mining method includes a parallel system, as show in Fig. 3, the parallel system reduction rule is applied to a part of the original workflow (Fig. 3a) and a new section of the workflow is created (Fig. 3b).
t b t
a *
(a) (b)
* ta t1n tb
t 1
t 2
tn
Fig. 3.Parallel system reduction
The QoS of the new workflow is computed using the following formulae (the QoS of tasksta andtb remain unchanged):
Time(t1n) = Maxi∈{1..n} {Time(ti)} and Cost(t1n) =
1≤i≤.n
Cost(ti)
Reduction rules exist for sequential, parallel, conditional, loop, and network systems [1]. These systems or pattern are fundamental since a study on fifteen major workflow management systems [10] showed that most systems support the reduction rules presented. Nevertheless, additional reduction rules can be developed to cope with the characteristics and features of specific workflow systems.
Our approach to workflow QoS estimation – which uses a variation of the SWR algorithm – addresses the third point that we raised in the introduction and shows that the prediction of workflow QoS can be used to obtain actual metrics (e.g. the workflow instancewwill take 3 days and 8 h to execute) and not only information that indicates if an instance takes “more” thanD days or “less” thanD days to execute.
4 Experiments
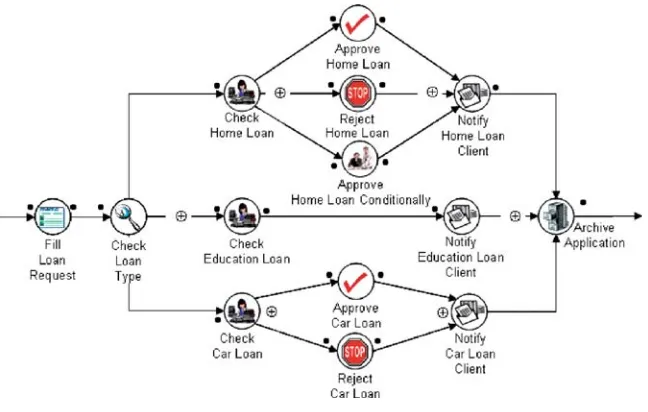
Fig. 4.The loan process
4.1 Workflow Scenario
A major bank has realized that to be competitive and efficient it must adopt a new and modern information system infrastructure. Therefore, a first step was taken in that direction with the adoption of a workflow management system to support its processes. One of the services supplied by the bank is the loan process depicted in Fig. 4. While the process is simple to understand, a complete explanation of the process can be found in [6].
4.2 Path Mining
To carry out path mining we need to log information about the execution of workflow instances. But before storing workflow instances data we need to extended our workflow management log system, as explained in Sect. 3.1, to store information indicating the values of the input parameters passed to activities and the output parameters received from activities (see [6, 7] for an overview of the information typically stored in the workflow log). The information also includes the path that has been followed during the execution of workflow instances.
To apply data mining algorithms to carry out path mining, the data present in the workflow log need to be converted to a suitable format to be processed by data mining algorithms. Therefore, we extract data from the workflow log to construct data mining instances. Each instance will constitute an input to machine learning and is characterized by a set of six attributes:
The attributes are input and output parameters from the workflow activ-ities. The attributes income, loan amount, loan years and SSN are numeric, whereas the attributes loan type and name are nominal. Each instance is also associated with a class (named [path]) indicating the path that has been fol-lowed during the execution of a workflow when the parameters were assigned specific values. Therefore, the final structure of a data mining instance is:
income,loan type,loan amount,loan years,Name,SSN,[path] In our scenario, the path class can take one of six possible alternatives indicating the path followed during the execution of a workflow when activity parameters were assigned specific values (see Fig. 4 to identify the six possible paths that can be followed during the execution of a loan workflow instance). Having our extended log ready, we have executed the workflow from Fig. 4 and logged a set of 1,000 workflow instance executions. The log was then con-verted to a data set suitable to be processed by machine learning algorithms, as described previously.
We have carried out path mining to our data set using four distinct data mining algorithms: J48 [11], Na¨ıve Bayes (NB), SMO [12], and Multi-Boost [13]. J48 was selected as a good representative of a symbolic method, Na¨ıve Bayes as a representative of a probabilistic method, and the SMO al-gorithm as representative of a method that has been successfully applied in the domain of text-mining. Multiboost is expected to improve performance of single classifiers with the introduction of meta-level classification.
Since when we carry out path mining to a workflow not all the activity input/ouput parameters may be available (some activities may not have been invoked by the workflow management system when path mining is started), we have conducted experiments with a variable number of parameters (in our scenario, the parameters under analysis are: income, loan type, loan amount, loan years, name, and SSN) ranging from 0 to 6. We have conducted 64 exper-iments (26); analyzing a total of 64000 records containing data from workflow instance executions.
Accuracy of Path Mining
The first set of experiments was conducted using J48, Na¨ıve Bayes, and SMO methods with and without the Multiboost (MB) method. We obtained a large number of results that are graphically illustrated in Fig. 5. The chart indicates for each of the 64 experiments carried out, the accuracy of path mining.
Path Mining Accuracy Analyzis
0,2 0,4 0,6 0,8 1,0
1 6 11 16 21 26 31 36 41 46 51 56 61 Experiment
Accuracy
J48 NB SMO MB J48 MB NB MB SMO
Fig. 5.Accuracy analysis of path mining
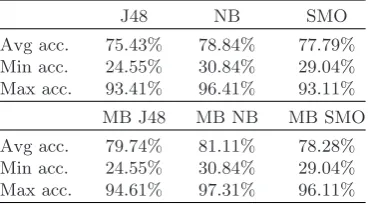
Table 3.Summary results of accuracy analysis of path mining
J48 NB SMO
Avg acc. 75.43% 78.84% 77.79% Min acc. 24.55% 30.84% 29.04% Max acc. 93.41% 96.41% 93.11%
MB J48 MB NB MB SMO
Avg acc. 79.74% 81.11% 78.28% Min acc. 24.55% 30.84% 29.04% Max acc. 94.61% 97.31% 96.11%
For reasons of simplicity and as a summary, we computed the average, the minimum, and the maximum accuracy for each method for all the experiments carried out. The results are shown in Table 3.
On average the Na¨ıve Bayes approach performs better than all other sin-gle methods when compared to each other. When the number of parameters is increased, the accuracy of Na¨ıve Bayes improves. It can be seen that all the methods produced more accurate results when a more appropriate set of parameters was proposed. The worst results were produced by the J48 and SMO algorithms. It is safe to assume that these algorithms overfitted and were not able to find a generalized concept. That is probably a result of the nature of the dataset that contains parameters and that introduced noise. These results address the third point that was raised in the introduction and show that path prediction using MultiBoost Na¨ıve Bayes outperforms the use of decision trees.
4.3 QoS Activity Model Construction
Once we have determined the most probable path that will be followed by a workflow at runtime, we know which activities a workflow instance will be invoking. At this stage, we need to construct a QoS activity model from each activity of the workflow. Since this phase is independent of the previous one, in practice it can be carried out before path mining.
Since we have 14 activities in the workflow illustrated in Fig. 4, we need to construct fourteen QoS activity models. Each model is constructed using a profiling methodology (profiling was described in Sect. 3.2). When carrying out activity profiling we determine the time an activity will take to be executed (i.e. Activity Response Time (ART)) and its cost (i.e. Activity cost (AC)). Table 4 illustrates the QoS activity model constructed for the Check Home Loan activity in Fig. 4 using profiling.
This static QoS activity model was constructed using activity profiling. When a sufficient number of workflows have been executed and the log has a considerable amount of data, we re-compute the static QoS activity at run-time, originating a dynamic QoS activity model. The re-computation is done based on the functions presented in Table 2. Due to space limitations we do not show the dynamic QoS activity model. It has exactly the same structure as the model presented in Table 4, but with more accurate values since they reflect the execution of activities in the context of several possible workflows.
4.4 Workflow QoS Estimation
As we have already mentioned, to compute the estimated QoS of a workflow in execution, we use a variation of the Stochastic Workflow Reduction (SWR) algorithm. The SWR aggregates the QoS activity models of each activity step-by-step. At each step a reduction rule is applied to transform and shrink the process and the time and cost of the activities involved is computed. This is continued until only one activity is left in the process. When this state is reached, the remaining activity contains the QoS metrics corresponding to the workflow under analysis. A graphical simulation of applying the SWR algorithm to our workflow scenario is illustrated in Fig. 6.
The initial workflow (a) is transformed to originate workflow (b) by apply-ing the conditional reduction rule to two conditional structures identified in the figure with a box (dashed line). Workflow (b) is further reduced by apply-ing the sequential reduction rule to three sequential structures also identified
Table 4. QoS activity model for the Check Home Loan activity Static QoS model
Min value Avg value Max value
Time (min) 123 154 189
Fig. 6.SWR algorithm applied to our workflow example Time Prediction (MB NB)
0 2 4 6 8
1 15 29 43 57 71 85 99
Process Instance #
Time
Real Time DM Time
DM Time Real Time
Fig. 7.QoS prediction for time
with a box (dashed line). The resulting workflow, workflow (c), is transformed several times to obtain workflow (d) and, finally, workflow (e). The final work-flow (e) is composed of only one activity. Since at each transformation step SWR algorithm aggregates the QoS activity models involved in the transfor-mation, the remaining activity contains the QoS metrics corresponding to the initial workflow under analysis.
4.5 QoS Experimental Results
Our experiments have been conducted in the following way. We have selected 100 random workflow instances from our log. For each instance, we have com-puted the real QoS (time and cost) associated with the instance. We have also computed the predicted QoS using our method. The results of QoS prediction for the loan process are illustrated in Fig. 7.
Cost Prediction (MB NB)
20 25 30 35 40 45 50 55 60
1 15 29 43 57 71 85 99
Process Instance #
Cost
Real Cost DM Cost
DM Cost Real Cost
Fig. 8.QoS prediction for cost
5 Related Work
Process and workflow mining is addressed in several papers and a detailed survey of this research area is provided in [14]. In [3, 4], a Business Process Intelligence (BPI) tool suite that uses data mining algorithms to support process execution by providing several features, such as analysis and prediction is presented. In [15] and [16] a machine learning component able to acquire and adapt a workflow model from observations of enacted workflow instances is described. Agrawal et al. [17] propose an algorithm that allows the user to use existing workflow execution logs to automatically model a given business process presented as a graph. Chandrasekaran et al. [2] describe a simulation coupled with a Web Process Design Tool (WPDT) and a QoS model [1] to automatically simulate and analyze the QoS of Web processes. While the research on QoS for BMPS is limited, the research on time management, which is under the umbrella of QoS process, has been more active and productive. Eder et al. [18] and Pozewaunig et al. [19] present an extension of CMP and PERT frameworks by annotating workflow graphs with time, in order to check the validity of time constraints at process build-time.
6 Conclusions
QoS estimation, we can obtain very good prediction accuracy. Our second conclusion indicates that the MultiBoost (MB) Na¨ıve Bayes approach is the data mining algorithm that yields the best workflow QoS prediction results.
References
1. Cardoso, J. et al.,Modeling Quality of Service for workflows and Web Service Processes. Web Semantics: Science, Services and Agents on the World Wide Web Journal, 2004.1(3): pp. 281–308
2. Chandrasekaran, S. et al.,Service Technologies and Their Synergy with Simula-tion. inProceedings of the 2002 Winter Simulation Conference (WSC’02). 2002. San Diego, California. pp. 606–615
3. Grigori, D. et al., Business Process Intelligence. Computers in Industry, 2004. 53: pp. 321–343
4. Grigori, D. et al.,Improving Business Process Quality through Exception Under-standing, Prediction, and Prevention. in27th VLDB Conference. 2001. Roma, Italy
5. Cardoso, J. and A. Sheth. Adaptation and Workflow Management Systems. in International Conference WWW/Internet 2005. 2005. Lisbon, Portugal. pp. 356–364
6. Cardoso, J.,Path Mining in Web processes Using Profiles, in Encyclopedia of Data Warehousing and Mining, J. Wang, Editor. 2005, Idea Group Inc. pp. 896–901
7. Cardoso, J. and M. Lenic. Web Process and Workflow Path mining Using the multimethod approach. Journal of Business Intelligence and Data Mining (IJBIDM). submitted
8. Musa, J.D.,Operational Profiles in Software-Reliability Engineering. IEEE Soft-ware, 1993.10(2): pp. 14–32
9. Musa, J.D.,Software reliability engineering: more reliable software, faster dev-elopment and testing. 1999, McGraw-Hill, New York
10. van der Aalst, W.M.P., et al., Workflow patterns homepage. 2002, http://tmitwww.tm.tue.nl/research/patterns
11. Weka,Weka. 2004
12. Platt, J., Fast Training of Support Vector Machines Using Sequential Mini-mal Optimization, inAdvances in Kernel Methods – Support Vector Learning, B. Scholkopf, C.J.C. Burges, and A.J. Smola, Editors. 1999, MIT, Cambridge, MA. pp. 185–208
13. Webb, I.G.,MultiBoosting: A Technique for Combining Boosting and Wagging. Machine Learning, 2000.40(2): pp. 159–196
14. van der Aalst, W.M.P. et al., Workflow Mining: A Survey of Issues and Ap-proaches. Data and Knowledge Engineering (Elsevier), 2003.47(2): pp. 237–267 15. Herbst, J. and D. Karagiannis. Integrating Machine Learning and Workflow Management to Support Acquisition and Adaption of Workflow Models. inNinth International Workshop on Database and Expert Systems Applications. 1998. pp. 745–752
17. Agrawal, R., D. Gunopulos, and F. Leymann. Mining Process Models from Workflow Logs. inSixth International Conference on Extending Database Tech-nology. 1998. Springer, Valencia, Spain. pp. 469–483
18. Eder, J. et al.,Time Management in Workflow Systems. in BIS’99 3rd Inter-national Conference on Business Information Systems. 1999. Springer Verlag, Poznan, Poland. pp. 265–280
and Temporal Constraints for Workflow
Optimisation
D.N. Wang and I. Petrounias
School of Informatics, University of Manchester, UK
Summary. Workflow systems have been recognised as a way of modelling business processes. The issue of workflow optimisation has received a lot of attention, but the issue of temporal constraints in this area has received significantly less. Issues that come from the enterprise, such as actors performing tasks, resources that these tasks utilise, etc. have not been taken into account. This chapter proposes a combination of utilisation of enterprise modelling issues and temporal constraints in order to produce a set of rules that aid workflow optimisation and therefore, business process improvement.
1 Introduction
Business processes are the key elements to achieving competitive advantage. Organisational effectiveness is depending on them. To meet new business chal-lenges and opportunities, improving existing business processes is an impor-tant issue for organisations. A Business Process is the execution of a series of tasks leading to the achievement of business results, such as creation of a prod-uct or service. Workflows have been considered as a means to model business processes. Time and cost constraints are measurements for business process performance. The execution time of a single business task can be improved, but, the overall performance of the business process is hard to optimise. This is further complicated by the following factors:
– There are different types of workflow instances and if any task changes in a workflow, this may or may not effect other tasks, depending upon the before mentioned types.
– The execution time of each task can be fixed, not fixed or even indefinite. – An actor is somebody (or something) that will perform business tasks. The actor’s workload and availability are hard to compute. The actor may participate in multiple workflow tasks, have different availability schedules and the business task may not be executed straight away.
Thus, it is necessary to consider these factors, and also the interrelation-ships between tasks also need to be observed.
This chapter is proposing a new approach to the overall improvement of business processes that addresses the limitations of existing workflow solu-tions. It attempts to answer the following questions: How do we find what can be improved? When can a task and whole process be improved? The first question is answered by looking at each task within a workflow and examining the concepts related to them with an enterprise model. The second question is answered by a set of general rules proposed by this study and they address the cases in which processes can be improved and tasks executed in parallel. These questions have not been explicitly addressed in previous studies. The rest of the chapter is organised as follows. Section 2 discusses existing work in business process improvement. Section 3 reviews the enterprise modelling concepts. Section 4 identifies the possible workflow routings by using Allen’s temporal interval inferences. Section 5 describes the approach used to exam-ine the concepts of tasks and processes within an enterprise model. Section 6 describes a set of possible cases in which processes can be improved and tasks executed in parallel. Section 7 describes a case study by applying these rules. Section 8 summarises the proposed approach and suggests further work.
2 An Overview of Existing Work
Business process improvement involves optimising the process in workflow specification. Previous studies are based on two categories: workflow optimi-sation and modelling temporal constraints for workflow systems.
Workflow optimisation has received a lot of attention in the area of work-flow scheduling, elimination of handoffs and job shop scheduling. [1] proposed a new methodology designed to optimally consolidate tasks in order to reduce the overall cycle time. This methodology takes into account the following pa-rameters: precedence of information flow, loss of specification, alignment of decision rights, reduction in handoffs and technology support costs. Conse-quently, the organisation could achieve better results due to the elimination of handoffs. Baggio et al. [2] suggest a new approach: ‘the Guess and Solve Technique’. The approach applies scheduling techniques to workflows by map-ping a workflow situation into a job-shop scheduling problem. As a result, it minimises the number of late jobs in workflow systems. Dong et al. [3] present a framework for optimising the physical distribution of workflow schemes. The approach focuses on compile-time analysis of workflow schemas and mapping of parallel workflows into flowcharts. The total running time for processing a workflow instance and maximum throughput have been considered in this approach.
calculus axioms, timed workflow graphs and project management tools have been purposed to represent the time structure [4–6]. [4] presents a tech-nique for modelling, checking and enforcing temporal constraints by using the Critical Path Method (CPM) in workflow processes containing conditionally executed tasks. This ensures that the workflow execution avoids violating tem-poral constraints. Two enactment schedules: ‘free schedules’ and ‘restricted due-time schedules’ are purposed in [7]. In a free schedule, an agent may use any amount of time between a minimum and a maximum time to finish the task; in a restricted due-time one, an agent can only use up to the declared maximum time. [7] also proposed to enhance the capabilities of workflow sys-tems to specify quantitative temporal constraints on the duration of activities and their synchronisation requirements. [5] introduced a new concept for time management in workflow systems consisting of calculating internal deadlines for all tasks within a workflow, checking time constraints and monitoring time at run-time. PERT diagrams are used to support the calculation of internal deadlines. Previous approaches in optimising workflow systems haven’t taken enough consideration of process complexity, the interrelationships between tasks and temporal constraints. To the authors’ knowledge, no previous ap-proach considers the use of an enterprise model to optimise workflow systems. We propose such an approach to improve the process, looking at the concepts within each process, the interrelationships among tasks, and the management of tasks cross-functionally. In the rest of the chapter, we discuss how processes can be improved by using the enterprise modelling technique.
3 Enterprise Modelling
4 Identifying Possible Workflow Routings
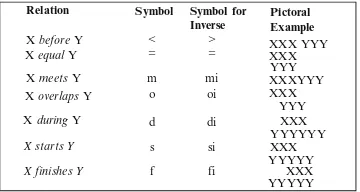
Workflow specification addresses business requirements. It can be addressed from a number of different perspectives [10, 11]. The control-flow perspective describes tasks and their execution routings. The data perspective defines business and processing data on the control-flow perspective. The resource perspective addresses the roles part within the workflow. The operational perspective describes the elementary actions executed by activities. The control-flow perspective provides a big picture of workflow execution orders, addressing what we believe identify the workflow specification’s effectiveness. These workflow execution orders need to be addressed in order to support business requirements from simple to complex. [12] describes possible work-flow routing constructs from basic to complex to meet business requirements. A time interval is an ordered pair of points with the first point less than the second. In these workflow routings, [12] provides an insight into the relations of different intervals. [13] describes a temporal representation that takes the notion of a temporal interval as primitive and provides an inference algebra to combine two different measures of the relation of two points. [13] also describes the possible relations between unknown intervals. In the workflow routings, described by [12], some relations between tasks, e.g. sequence routing, are al-ready provided. We use the possible relations between the parallel activities that can be identified by applying Allen’s 13 possible temporal interval infer-ences [13] (see Fig. 1) to existing workflow routings. In addition, three types of workflow patterns are identified: sequential routing, single task triggering multiple tasks routing, multiple tasks triggering single task routing.
• Sequential Routing: Sequence, Exclusive choice, Simple merge, Arbitrary cycles, Cancellation patterns. In a sequential routing (Fig. 2), task C is always executed after task A. Both exclusive choice pattern and simple merge pattern can be considered as sequential routing: task C (B) always meets or will be after the previously executed task. In Multiple Merge, Syn-chronizing Merge and Discriminator patterns, if only one task is chosen, this workflow’s flow can be considered as a sequential routing [Routing 1].
A B C
A
B
C or
A
B
or C
Fig. 2.(a) Sequence (b) Or-Split (c) Or-Join
A
B
C and
Fig. 3.And-Split
A
B
and C
Fig. 4.And-Join
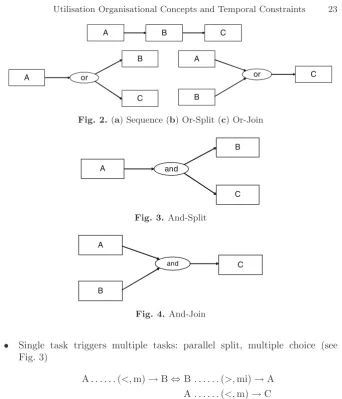
• Single task triggers multiple tasks: parallel split, multiple choice (see Fig. 3)
A. . . .(<,m)→B⇔B. . . .(>,mi)→A A. . . .(<,m)→C
Using Allen’s temporal interval, B. . .. . .(<, >,o,oi,m,mi,d,di,s,si,=
,f,fi)→C
If the relation between A and B, and A and C are already given, A may meet or be before B and C. Then, by using Allen’s temporal interval in-ference, the relation between its output B and C could be any of those 13 intervals above [Routing 2].
• Multiple tasks trigger single task: Synchronization (see Fig. 4) B. . . .(<,m)→C⇔C. . . .(>,mi)→B
A. . . .(<,m)→C
Using Allen’s temporal intervals, A. . . .(<, >,o,oi,m,mi,d,di,s,si,=
If the relations between A and C, and B and C are already given, C may meet or be after the execution of A and B and by using Allen’s temporal interval inference, the relation between its inputs A and B could be any of the 13 intervals above [Routing 3].
5 Examining Concepts Related to the Processes
Within an Enterprise Model
The enterprise model is used for modelling the organisation and examining concepts related to business processes. A high level enterprise metamodel is defined with the following concepts: actor, resource, product, goal and duration (Fig. 5). These will be examined within the three types of routings identified above. One should note the ‘recursive’ link on the concept ‘process’. This means that processes can consist of other processes. At a lower level of decomposition processes will be reduced to tasks (making up an overall process), which can also, using this metamodel, consist of subtasks.
• Actor: Actors are the people who perform the process. An actor can be a single person or a group, who plays more than one roles.
An actor has three possibilities to work on a process [14]: – Direct work: Actor works directly on the whole process.
– Delegation: A process can be delegated by an actor; this can be done by delegating the whole process or dividing the process into sub-process and eventually tasks to other actors (this is shown by the ‘recursive’ link to process in Fig. 5).
– Sub-processes: An actor can initialise another workflow model to fulfill the task/process (again Fig. 5).
These cases are analysed with the existing workflow routings:
– Direct Work: For the sequential execution (see Fig. 6), if these tasks are being performed by the same actor, task B can be executed after task A finishes, and task C can be executed after task B finishes. Even
Product
Process
Goal Resource
Actor
Duration
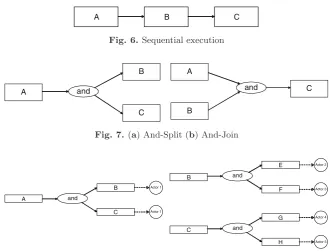
A B C Fig. 6.Sequential execution
A
B
C and
A
B
and C
Fig. 7.(a) And-Split (b) And-Join
B
E
F and
Actor 2
Actor 3 A
B
C and
Actor 1
Actor 1 C
G
H and
Actor 4
Actor 5 Fig. 8.(a) And-Split with same actors (b) (c) And-Split with different actors
if tasks A, B and C are being performed by different actors, these tasks are still executed sequentially.
Task B and task C can be executed in parallel only if they are being performed by different actors (see Fig. 7).
– Delegation: If an actor delegates a task, this task can be divided into sub-tasks to other actors. If these sub-tasks are being performed by different actors, then, task B and task C can be executed parallel. And the sub-tasks of process B and C can be executed in parallel if they are being performed by different actors (see Fig. 8).
– Read only access: Shared resources can be accessed by different tasks simultaneously.
– Read and write access: Shared resources can only be accessed by a single task at one time.
– Private resources can only be accessed by a specified task at one time. 1. Single task triggers single thread of tasks, such as sequential routing.
Task B is always executed after task A completes, and task C always executed after task B completes.
A. . .(<,=)→B B. . .(<,=)→C
If tasks A, B and C need to access the same shared resource R1, there are no resource conflicts. If tasks A, B and C need to access different private resources R1, R2 and R3, there are no resource conflicts. 2. Single task triggers multiple tasks, such as parallel split, multiple
choices.
If tasks A, B and C need to access different private resources R1, R2 and R3,R1(A)∩R2(B)∩R3(C) =∅, there are no resource conflicts. The relation between B and C can be any of those 13 possible intervals
B. . .. . .(<, >, o, oi, m, mi, d, di, s, si,=, f, f i) → C. If tasks B and C are resource dependent,R2(B)∩R3(C)=∅, and both tasks acquire exclusive access (read and write accesses), then task B cannot execute simultaneously with task C, in order to avoid the resource conflict, the possible relations can only beB. . ...(<, >, m, mi)→C. If tasks B and C are resource dependent,R2(B)∩R3(C)=∅, and both tasks acquire access (read only access), then task B can be executed simultaneously with task C; there is no resource conflict. The possible relations can be
B. . .. . .(<, >, o, oi, m, mi, d, di, s, si,=, f, f i)→C.
3. Multiple tasks trigger single task, such as synchronisation.
If tasks A, B and C need to access different private resources R1, R2 and R3,R1(A)∩R2(B)∩R3(C) =∅, these are no resource conflicts. The relation between A and B and be any of those 13 possible intervals,
A. . .. . .(<, >, o, oi, m, mi, d, di, s, si,=, f, f i) → B. If tasks A and B are resource dependent,R1(A)∩R2(B)=∅, and both tasks acquire exclusive access (read and write accesses), then task A cannot execute simultaneously with task B, in order to avoid the resource conflict. The possible relations can only beA. . ...(<, >, m, mi)→B. If tasks A and B are resource dependent,R1(A)∩R2(B)=∅, and both tasks acquire access (read only access), then task A can be executed simultaneously with task B; there is no resource conflict. The possible relations can be
A. . .. . .(<, >, o, oi, m, mi, d, di, s, si,=, f, f i)→B.
• Goal. The goal is the objective of the task and is not affected by the
relationship with other tasks.
• Product. If the output of one task is not the input of another one, then
If the output of one task is the input of another one, these two tasks can only be executed sequentially.
• Time. The time of a task can be a time point or time interval [13]. Time point is a precise point in time, e.g. “12 o’clock”. Time interval is a time period, which could be fixed, fuzzy or indefinite [16].
– Fixed duration has exact beginning and end, for example, my semester started on the 15th of January and finished on the 28th of March. – Fuzzy duration, the duration is known (3–5 days) and it has an earliest
and latest start time and an earliest and latest finish time.
– Indefinite duration, the end of the interval cannot be determined or estimated. By examining Allen’s interval algebra (the 13 basic rela-tions), the rule is: If the finish time of one task is after the start time of another one, then these tasks can be executed in parallel. A. . ...(d,di,s,si,f,fi,o,oi,=)→B.
• Parallelism conditions. The parallelism heuristic is a way of optimising
the workflow [17]. We believe if the tasks can be executed in parallel, the throughput time may be reduced. From the three workflow routings identi-fied above, the possible relations between two tasks A and B could be any of these 13 possible relations A. . .(<, >,o,oi,m,mi,d,di,s,si,=,f,fi)→B that can be divided into two categories:
– Parallel execution relations A. . ...(o,oi,d,di,s,si,f,fi =)→B – Sequential execution relations A. . ...(<, >,m, mi)→B
As mentioned above, a process can be quite complex. It may consist of different actors performing different tasks; it may also need to access different resources etc. An enterprise model can be used to model the organisation and examine the five concepts related to processes/tasks. We use a reverse reasoning method to address the conditions in which tasks can be executed in parallel, and those in which tasks can be only executed sequentially. (See Tables 1 and 2: X = different,√= same)
Table 1.Parallel execution relations
Actor Resource Goal Product Time
Shared Private
Read-only Read and write
O x √ X √or x √ x √
Oi x √ X √or x √ x √
D x √ X √or x √ x √
Di x √ X √or x √ x √
= x √ X √or x √ x √
S x √ X √or x √ x √
Si x √ X √or x √ x √
F x √ X √or x √ x √
Table 2.Sequential executions relations
Actor Resource Goal Product Time
Shared Private
Read-only Read and write
< √ √ √ √or x √ √ x
> √ √ √ √or x √ √ x
M √ √ √ √or x √ √ x
mi √ √ √ √or x √ √ x
From the above, to execute tasks in parallel, five conditions have to be satisfied:
1. These tasks need to be performed by different actors.
2. These tasks can only acquire read-only access to the shared resource or acquire access to different private resources.
3. These tasks can address the same or different goals.
4. The product of the task cannot be the input of other tasks. 5. The task finishing time is after the start time of other tasks.
6 General Rules of Process Improvement
By examining the concepts of the process/task with an enterprise model, a set of rules is derived in which processes can be improved and tasks can be executed in parallel:
1. If two or more tasks are being performed by different actors, then these tasks can be executed in parallel.
2. If two or more tasks are being performed by the same actor, and the sub-tasks of these have different actors, then these sub-tasks can be executed in parallel.
3. In a composite relationship, if sub-tasks are being performed by different actors, then these sub-tasks can be executed in parallel.
4. If two or more tasks need to access different private resources, then these tasks can be executed in parallel.
5. If two or more tasks acquire read only access to the same shared resources, then these tasks can be executed in parallel.
6. If two or more tasks acquire read and write access to different shared resources, then these tasks can be executed in parallel.
7. In a composite relationship, if sub-tasks acquire access to different private resources, then these sub-tasks can be executed in parallel.
9. In a composite relationship, if sub-tasks acquire read and write access to different shared resources, then these sub-tasks can be executed in parallel. 10. If the output of one task is not the input of another task, then these tasks
can be executed in parallel.
11. If the output of a sub-task is not the input of another sub-task, then these sub-tasks can be executed in parallel.
12. If the finish time of one task is after the start time of another one, then these tasks can be executed in parallel.
7 Case Study on Electricity Utility System
Improvement Process
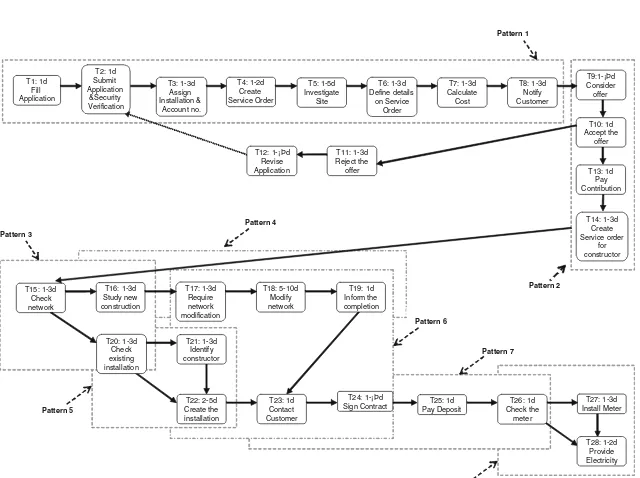
To illustrate the improvement rules identified above, an electricity installa-tion process is used, which is based on the Electricity Supply Industry Case Study [18]. It is the process of receiving customer applications and providing electricity. In it there are four actors: customer, customer service department (service administration), studies department (service provision) and construc-tion department. Each task has a unique number so that it can be identified and it has assigned an appropriate time constraint expressed in time units, i.e. days (d). We assume that in some cases, tasks have a definite duration, e.g. the duration of submitting an application is 1 day. In other cases, tasks have an associated time-interval, e.g. the duration of investigating a site is between 1 and 3 days. This is due to the existence of different workflow instances: different sites require different time to investigate, i.e. a local site takes 1 day to investigate and a site in another city may take more than 1 day. Other tasks may never be completed, e.g. customers may never notify the customer service department with their decision. These have an infinite interval; dead-lines are assigned, i.e.∞= 14 days. In this case study, we assume customers accept the offer. Figure 9 shows the logical view of existing task executions in this process. In order to illustrate the process improvement procedures, the workflow model of existing execution process is divided into eight execution patterns for analysis (Fig. 10).
Step 1. Pattern 1 follows sequential routing [Routing 1]. In order to opti-mise the sequential tasks, the parallel execution rules identified in the previous section are used to examine these tasks (see Table 3). The improved tasks are shown in Fig. 11.
Step 2. Pattern 2 follows sequential routing [Routing 1]. In order to opti-mise the sequential tasks, the parallel execution rules identified in the previous section are used to examine these tasks (see Table 4). The improved tasks are shown in Fig. 12.
T14: 1-3d
Fig. 9.Existing process of electricity installation
T14: 1-3d
Sign Contract Pay DepositT25: 1d
T26: 1d
U
Enterprise model Actor Resource Product Goal Time
T1 Customer Application form Application form Apply electricity
installation
T1. . . .(<, m)→T2
T2 Customer Application form and
security info
Installation account Installation account Assign installation and account no.
T3. . . .(<, m)→T4
T4 Customer service dept: Staff 2
Service order Service order Create service order T4. . . .(<, m)→T5 TaskT5 Studies dept:Staff 3 Installation account Installation details Investigate site T5. . . .(<, m)→T6
T6 Studies dept:Staff 4 Service order Service order details Define details on service order
and
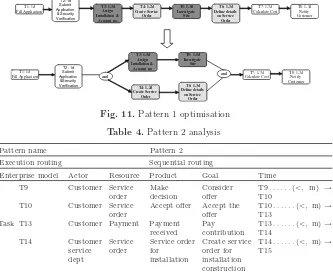
Fig. 11.Pattern 1 optimisation
Table 4.Pattern 2 analysis
Pattern name Pattern 2
Execution routing Sequential routing
Enterprise model Actor Resource Product Goal Time T9 Customer Service
Task T13 Customer Payment Payment received
Interpretation: In the existing process, customer responsibles to execute task T9, T10 and task T13; Since customer can and accept the offer after the consideration, and he/she only need to pay contribution after accept the offer, Thus, task T9, T10 and task T13 need to executed in sequential order. Customer Service Dept is the actor, who is responsible to execute task T14; it requires access to different resource from task T13 and is not dependant on the output of task T13. Therefore, these two tasks can be executed in parallel, parallel execution rules [Rule 1, 4, 10] are applied.
and
and
Fig. 13.Pattern 3 analysis
Table 5.Pattern 4 analysis (a)
Pattern name Pattern 4
Execution routing Sequential Routing
Enterprise model Actor Resource Product Goal Time T16 Studies dept Service
Interpretation: Tasks T16, T17, T18 and T20 are require the same shared access, the input of task T17 is depend on the output of task T16, the input of task T18 is depend on the output of task T17, the input of T19 is depend on the output of T18, which don’t satisfy with parallel executions rules.These tasks can only be executed in sequential order.
Step 4. Pattern 4 follows sequential routing [Routing 1]. In order to opti-mise the sequential tasks, the parallel execution rules identified in the previous section are used to examine these tasks (see Table 5). The improved tasks are shown in Fig. 14.
Step 5. Pattern 5 is mapped into an OR-Split construct, which follows sequential routing [Routing 1]. Task T20 triggers either task T21 or task T22, which is dependent on the condition, the execution routing can not be changed (Fig. 15).
and
Fig. 15.Pattern 5 analysis
Step 7. Pattern 7 follows sequential routing [Routing 1]. In order to opti-mise the sequential tasks, the parallel execution rules identified in the previous section are used to examine these tasks (see Table 6). The improved tasks are shown in Fig. 17.
and
or T17: 1-3dRequire network
Fig. 16.Pattern 6 analysis
7.1 Execution Time Comparisons
Existing Process
The six possible task execution paths and the throughput time are shown below (see Tables 7 and 8).
Due to the conditional execution of activities, the following time informa-tion can be associated with the end event of activity:EBS, EW S, EBF, EW F, LBS, LW S, LBF,andLW F [19]:
– EBF The earliest point the process can finish when the shortest condition
and alternative path are chosen.
– EBS The earliest point the process can finish when the longest condition
and alternative path are chosen.
– EW F The earliest point when the longest condition and the shortest
al-ternative path are chosen.
– EW S The earliest point when the longest condition and the longest
alter-native path are chosen.
– LBF The latest point the process can finish when the shortest condition
and alternative path are chosen.
– LBS The latest point the process can finish when the longest condition
and alternative path are chosen.
– LW S The latest point when the longest condition and the longest
alter-native path are chosen.
– LW F The latest point when the longest condition and the shortest
D.
N
.
W
a
ng
a
nd
I.
P
et
ro
uni
a
s
Table 6.Pattern 7 analysis
Pattern name Pattern 7
Execution routing Sequential Routing
Enterprise model Actor Resource Product Goal Time
T23 Customer
service dept – Staff 7
Construction details
Network installa-tion/completion
Contact customer
T23. . . .(<, m)→T24
Task T24 Customer Contract Contract signed Sign contract T24. . . .(<, m)→T25 T25 Customer Deposit Deposit paid Pay deposit T25. . . .(<, m)→T26
T26 Customer
service dept – Staff 8
Meter Meter checked Check the meter
and
and
Fig. 18.Pattern 8 analysis
Improved Process
The six possible task execution paths and the throughput time are shown below (see Tables 9 and 10).
The following formulae represent how throughput time is improved in the process.
f(n) represents the duration of task, n is the number of the task. If we don’t know the duration variables of each task, the existing execution time (in sequence) can be represented as,
Total timesequentialexecution=
n
k=1
f(k)
If two or more tasks are executed in parallel, the throughput time of these tasks is max(
til
D.
N
.
W
a
ng
a
nd
I.
P
et
ro
uni
a
s
Table 9.Six possible task execution paths improved process
Path 1: T1→T2→(T3→T5||T4→T6)→T7→T8→T9→T10→(T13→T24→T25||T14→T15→T16→T17→
T18→T19→T23)→T26→T27→T28
Path 2: T1→T2→(T3→T5||T4→T6)→T7→T8→T9→T10→(T13→T24→T25||T14→T15→T16→T17→
T18→T19→T23)→T26→T28
Path 3: T1→T2→(T3→T5||T4→T6)→T7→T8→T9→T10→(T13→T24→T25||T14→T15→T20→T21→
T22→T23)→T26→T27→T28
Path 4: T1→T2→(T3→T5||T4→T6)→T7→T8→T9→T10→(T13→T24→T25||T14→T15→T20→T21→
T22→T23)→T26→T28
Path 5: T1→T2→(T3→T5||T4→T6)→T7→T8→T9→T10→(T13→T24→T25||T14→T15→T20→T22→
T23)→T26→T27→T28
Path 6: T1→T2→(T3→T5||T4→T6)→T7→T8→T9→T10→(T13→T24→T25||T14→T15→T20→T22→