LAMPIRAN A
HASIL RANDEMEN AMILUM KULIT PISANG
Berat kulit pisang
(setelah disortasi) Berat amilum % Perolehan amilum
A1 50 kg 0,61 kg 1,22
A2 75 kg 0,90 kg 1,20
A3 44 kg 0,59 kg 1,34
LAMPIRAN B
HASIL KARAKTERISASI AMILUM KULIT PISANG
Hasil Uji Kualitatif Amilum
Replikasi Uji/Pemeriksaan Hasil Pemeriksaan
A1 Uji Kualitatif
(Identifikasi Amilum dengan Iodin)
Warna Ungu Kebiruan
A2 Warna Ungu Kebiruan
A3 Warna Ungu Kebiruan
Hasil Uji Mutu Fisik dan Kimia Amilum
Replikasi Uji/Pemeriksaan Hasil Pemeriksaan
A1 Organoleptik Bentuk Warna Bau Rasa Serbuk Kecokelatan Tidak berbau Tidak berasa Mikroskopik Terdapat hilus dan lamela
Pengukuran pH 6,3
Kelembaban Amilum 6,79
A2 Organoleptik Bentuk Warna Bau Rasa Serbuk Kecokelatan Tidak berbau Tidak berasa Mikroskopik Terdapat hilus dan lamela
Pengukuran pH 6,4
Kelembaban Amilum 7,56
A3 Organoleptik Bentuk Warna Bau Rasa Serbuk Kecokelatan Tidak berbau Tidak berasa Mikroskopik Terdapat hilus dan lamela
Pengukuran pH 5,6
Hasil Uji Mikroskopis Amilum
Uji distribusi ukuran partikel :
ditimbang A1 = 100,070 gram
ditimbang A2 = 100,030 gram
ditimbang A3 = 100,010 gram
Zat diayak selama 10 menit
Hasil distribusi ukuran partikel amilum A1
% kehilangan = 0,060 (<0.5%) distribusi berat :
ln d vs nilai Z dari FKA a = 4,781 diameter geometris dg 50% = 4,494 b = -1.064 SD geometris σg = 0,791 r = -0.930
Hasil distribusi ukuran partikel amilum A2
% kehilangan = 0,060 (<0.5%)
ln d vs nilai Z dari FKA a = 4,970 distribusi berat :
b = -1.109 diameter geometris dg 50% = 4,481
Hasil distribusi ukuran partikel A3
% kehilangan = 0,090 (<0.5%) distribusi berat :
ln d vs nilai Z dari FKA a = 3,898 diameter geometris dg 50% = 4,261 b = -0.915 SD geometris σg = 0,743
r = -0.972
Hasil Uji Viskositas Muchilago Amilum Kulit Pisang
Hasil Kadar Abu, Kadar Amilosa, Derajat Putih dan Susut Pengeringan Amilum
LAMPIRAN C
HASIL UJI MUTU FISIK GRANUL
Hasil Uji Kelembaban Granul
Hasil Uji Hausner ratio
LAMPIRAN D
HASIL UJI KESERAGAMAN BOBOT TABLET METFORMIN HCl
Formula 1
No Replikasi 1 Replikasi 2 Replikasi 3
Bobot Tablet Pb (%) Bobot Tablet Pb (%) Bobot Tablet Pb (%)
1 0,70 0,19 0,72 1,55 0,70 1,18
2 0,69 1,19 0,71 0,65 0,73 2,25
3 0,71 0,99 0,71 0,56 0,71 0,61
4 0,71 1,16 0,71 0,00 0,71 0,31
5 0,71 1,30 0,71 0,13 0,71 0,15
6 0,71 1,41 0,72 1,46 0,71 0,07
7 0,69 1,26 0,71 0,39 0,71 0,46
8 0,70 0,70 0,72 1,68 0,72 1,61
9 0,70 0,66 0,71 0,44 0,70 0,89
10 0,71 1,16 0,72 1,62 0,71 0,35
11 0,70 0,17 0,71 0,63 0,73 2,49
12 0,70 0,16 0,73 2,20 0,72 1,75
13 0,70 0,13 0,71 0,44 0,72 1,83
14 0,70 0,19 0,72 1,69 0,72 1,23
15 0,70 0,23 0,71 0,69 0,72 0,93
16 0,70 0,31 0,70 1,34 0,72 1,97
17 0,70 0,07 0,71 0,20 0,72 2,10
18 0,70 0,00 0,73 2,39 0,71 0,56
19 0,70 0,00 0,72 1,35 0,71 0,31
20 0,70 0,00 0,72 1,97 0,71 0,63
Rata-rata 0,70 0,25 0,71 0,66 0,71 0,68
Formula 2
No Replikasi 1 Replikasi 2 Replikasi 3
Bobot Tablet Pb (%) Bobot Tablet Pb(%) Bobot Tablet Pb (%)
1 0,71 0,32 0,71 0,46 0,71 0,45
2 0,73 2,37 0,71 0,69 0,70 0,85
3 0,71 0,44 0,71 0,39 0,71 0,49
4 0,72 1,63 0,70 1,01 0,70 1,14
5 0,70 0,97 0,70 0,82 0,70 0,72
6 0,71 0,21 0,71 0,31 0,71 0,37
7 0,71 0,20 0,71 0,37 0,71 0,14
8 0,70 0,83 0,70 0,73 0,70 0,94
9 0,72 0,72 0,71 0,32 0,72 0,70
10 0,70 0,79 0,70 0,93 0,71 0,69
11 0,73 2,54 0,72 1,39 0,72 1,27
12 0,72 1,39 0,70 1,73 0,70 0,76
13 0,72 0,99 0,71 0,17 0,71 0,24
14 0,71 0,62 0,70 1,83 0,72 1,65
15 0,71 0,44 0,71 0,42 0,70 1,15
16 0,71 0,65 0,71 0,49 0,72 1,56
17 0,72 0,96 0,69 2,20 0,70 1,20
18 0,71 0,69 0,70 0,76 0,70 1,01
19 0,70 1,24 0,71 0,17 0,70 0,80
20 0,70 1,03 0,71 0,55 0,70 0,73
Rata-rata 0,71 0,14 0,71 0,48 0,71 1,16
SD 0,01 1,12 0,01 0,47 0,01 0,59
Formula 3
No Replikasi I Replikasi 2 Replikasi 3
Bobot Tablet Pb(%) Bobot Tablet Pb(%) Bobot Tablet Pb(%)
1 0,70 1,20 0,70 1,10 0,70 1,01
2 0,70 0,92 0,71 0,62 0,72 1,83
3 0,72 1,59 0,70 0,86 0,70 0,96
4 0,71 0,49 0,72 1,65 0,69 2,97
5 0,71 0,58 0,71 0,68 0,71 0,55
6 0,71 0,32 0,71 0,30 0,71 0,21
7 0,71 0,41 0,71 0,18 0,73 2,66
8 0,70 0,85 0,72 1,62 0,70 0,92
9 0,70 0,76 0,70 0,83 0,70 0,92
10 0,70 0,94 0,70 0,94 0,70 1,03
11 0,72 2,03 0,72 1,56 0,72 1,97
12 0,71 0,18 0,72 0,79 0,72 1,86
13 0,72 1,55 0,71 0,66 0,72 1,96
14 0,71 0,08 0,71 0,31 0,72 1,63
15 0,71 0,56 0,72 0,92 0,72 1,82
16 0,72 0,79 0,72 1,58 0,73 2,11
17 0,72 1,25 0,72 1,77 0,72 1,55
18 0,71 0,46 0,72 1,55 0,72 1,93
19 0,71 0,49 0,72 1,52 0,71 0,66
20 0,71 0,58 0,71 0,31 0,72 0,93
Rata-rata 0,71 0,04 0,71 0,41 0,71 0,62
Formula 4
No Replikasi I Replikasi 2 Replikasi 3
Bobot Tablet Pb (%) Bobot Tablet Pb (%) Bobot Tablet Pb (%)
1 0,71 1,16 0,71 1,11 0,71 1,03
2 0,71 1,03 0,71 0,94 0,71 1,06
3 0,71 0,90 0,71 1,01 0,71 0,93
4 0,71 1,57 0,71 1,37 0,71 1,61
5 0,70 0,40 0,70 0,43 0,70 0,31
6 0,70 0,63 0,70 0,57 0,70 0,46
7 0,70 0,00 0,70 0,44 0,72 3,09
8 0,70 0,69 0,71 0,73 0,73 4,26
9 0,70 0,47 0,70 0,53 0,70 0,61
10 0,70 0,63 0,70 0,69 0,70 0,57
11 0,71 1,43 0,69 1,43 0,71 1,60
12 0,69 1,43 0,69 1,43 0,71 2,10
13 0,70 0,00 0,70 0,00 0,71 1,00
14 0,70 0,00 0,71 1,43 0,70 0,44
15 0,69 1,43 0,70 0,00 0,69 1,26
16 0,70 0,00 0,71 1,43 0,69 1,71
17 0,69 1,43 0,69 1,43 0,69 1,71
18 0,70 0,00 0,71 1,43 0,68 2,69
19 0,70 0,00 0,71 1,43 0,70 0,03
20 0,70 0,00 0,69 1,43 0,70 0,17
Rata-rata 0,70 0,75 0,70 0,78 0,70 1,39
SD 0,01 0,44 0,01 0,32 0,01 1,29
Formula 5
No Replikasi I Replikasi 2 Replikasi 3
Bobot Tablet Pb (%) Bobot Tablet Pb (%) Bobot Tablet Pb (%)
1 2
0,70 0,21 0,70 1,11 0,70 1,87
0,72 2,83 0,72 1,65 0,72 4,20
3 0,70 0,47 0,70 0,85 0,70 1,72
4 0,71 0,71 0,71 0,55 0,71 3,25
5 0,71 1,40 0,70 0,87 0,71 2,71
6 0,70 0,31 0,72 1,77 0,72 4,61
7 0,70 0,21 0,70 1,15 0,70 1,83
8 0,70 0,67 0,70 0,86 0,70 1,58
9 0,70 0,54 0,70 0,97 0,71 3,09
10 0,70 0,40 0,70 1,10 0,72 4,93
11 0,72 3,00 0,73 2,80 0,72 4,97
12 0,70 0,17 0,69 3,10 0,71 3,04
13 0,69 1,27 0,68 4,04 0,73 5,94
14 0,68 2,84 0,70 1,54 0,73 5,61
15 0,69 1,01 0,69 2,61 0,72 4,93
16 0,72 3,00 0,70 1,38 0,71 2,32
17 0,71 1,59 0,70 1,52 0,70 1,67
18 0,70 0,33 0,72 1,58 0,70 1,46
19 0,68 2,29 0,70 1,32 0,70 1,38
20 0,69 1,19 0,71 0,15 0,71 3,09
Rata-rata 0,70 0,78 0,71 0,29 0,71 2,98
SD 0,01 0,80 0,01 1,17 0,01 1,26
Formula 6
No Replikasi I Replikasi 2 Replikasi 3
Bobot Tablet Pb (%) Bobot Tablet Pb (%) Bobot Tablet Pb (%)
1 0,70 0,30 0,70 2,42 0,70 0,97
2 0,71 0,87 0,71 1,51 0,71 0,42
3 0,71 1,07 0,71 1,79 0,71 0,28
4 0,71 1,20 0,71 0,99 0,71 0,11
5 0,71 1,63 0,72 0,47 0,71 0,13
6 0,72 2,71 0,71 1,19 0,70 1,03
7 0,70 0,64 0,73 1,11 0,72 1,68
8 0,70 0,33 0,72 0,14 0,70 0,93
9 0,70 0,59 0,71 0,78 0,71 0,68
10 0,70 0,70 0,73 1,11 0,71 0,62
11 0,72 3,50 0,73 1,15 0,73 2,68
12 0,69 1,26 0,72 0,14 0,72 0,73
13 0,69 1,26 0,72 0,58 0,70 1,24
14 0,71 1,57 0,72 0,17 0,72 1,25
15 0,69 1,21 0,72 0,56 0,72 1,55
16 0,69 1,59 0,71 1,86 0,71 0,42
17 0,69 1,26 0,71 0,81 0,72 1,68
18 0,68 2,66 0,70 2,50 0,73 2,80
19 0,73 4,10 0,71 1,67 0,74 3,66
20 0,71 1,71 0,72 0,14 0,71 0,28
Rata-rata 0,70 1,00 0,72 0,61 0,71 0,29
SD 0,01 0,72 0,01 1,22 0,01 0,81
Formula 7
No Replikasi I Replikasi 2 Replikasi 3
Bobot Tablet Pb (%) Bobot Tablet Pb (%) Bobot Tablet Pb (%)
1 0,70 0,41 0,70 1,10 0,70 1,18
2 0,72 2,84 0,70 0,77 0,70 1,00
3 0,71 0,99 0,72 1,27 0,71 0,69
4 0,71 1,16 0,71 0,20 0,71 0,20
5 0,70 0,21 0,70 1,11 0,70 1,01
6 0,70 0,27 0,70 1,10 0,70 0,79
7 0,70 0,41 0,72 1,69 0,72 1,27
8 0,71 1,41 0,72 1,55 0,72 1,59
9 0,71 1,70 0,72 1,32 0,71 0,46
10 0,71 1,84 0,70 1,07 0,71 0,17
11 0,69 0,94 0,71 0,70 0,71 0,46
12 0,69 1,26 0,70 1,11 0,70 0,79
13 0,68 2,71 0,71 0,17 0,70 1,13
14 0,69 0,99 0,71 0,54 0,70 0,87
15 0,70 0,17 0,72 1,52 0,71 0,18
16 0,70 0,16 0,72 1,27 0,70 1,35
17 0,71 2,10 0,71 0,49 0,73 2,68
18 0,73 3,57 0,70 1,39 0,73 2,90
19 0,71 1,71 0,71 0,46 0,72 1,97
20 0,71 1,91 0,72 1,59 0,73 2,83
Rata-rata 0,70 1,13 0,71 0,05 0,71 0,26
Formula 8
No Replikasi I Replikasi 2 Replikasi 3
Bobot Tablet Pb (%) Bobot Tablet Pb (%) Bobot Tablet Pb (%)
1 0,70 0,79 0,70 0,92 0,70 0,79
2 0,70 1,07 0,70 1,14 0,70 1,01
3 0,71 0,49 0,71 0,56 0,71 0,59
4 0,71 0,27 0,71 0,17 0,71 0,11
5 0,71 0,08 0,71 0,14 0,71 0,20
6 0,70 0,96 0,70 1,01 0,71 0,45
7 0,70 1,06 0,72 1,55 0,70 0,90
8 0,70 1,24 0,70 0,75 0,71 0,70
9 0,70 0,86 0,70 0,96 0,70 0,79
10 0,70 0,83 0,70 0,75 0,70 0,86
11 0,71 0,31 0,72 1,27 0,72 1,55
12 0,71 0,27 0,72 1,55 0,72 2,10
13 0,73 2,25 0,71 0,20 0,72 1,25
14 0,72 1,54 0,72 1,06 0,71 0,32
15 0,70 2,11 0,72 1,41 0,70 1,61
16 0,70 1,32 0,72 1,35 0,69 2,25
17 0,71 0,03 0,72 1,06 0,69 2,65
18 0,70 1,23 0,72 1,17 0,71 0,42
19 0,72 1,97 0,72 1,27 0,71 0,65
20 0,71 0,03 0,72 1,61 0,70 0,79
Rata-rata 0,71 0,76 0,71 -0,48 0,71 0,55
LAMPIRAN E
HASIL UJI KEKERASAN TABLET METFORMIN HCl
Replikasi 1
No Kekerasan Tablet (kp)
F1 F2 F3 F4 F5 F6 F7 F8
1 4,8 7,7 5,9 7,2 6,9 7,5 6,3 6,7
2 4,8 7,8 5,9 7,3 6,9 7,5 6,3 6,7
3 4,8 7,7 5,9 7,3 7,0 7,5 6,3 6,7
4 4,8 7,8 5,8 7,3 7,0 7,5 6,3 6,7
5 4,9 7,8 5,9 7,2 6,9 7,6 6,3 6,8
6 4,9 7,8 5,9 7,3 6,9 7,6 6,5 6,8
7 4,8 7,8 5,8 7,2 6,9 7,5 6,5 6,8
8 4,8 7,7 5,9 7,2 7,0 7,5 6,3 6,7
9 4,9 7,8 5,8 7,2 7,0 7,6 6,5 6,8
10 4,9 7,8 5,8 7,3 7,0 7,6 6,3 6,8
Rata-rata 4,84 7,77 5,86 7,25 6,95 7,54 6,36 6,75
SD 0,05 0,05 0,05 0,05 0,05 0,05 0,09 0,05
Replikasi 2
Kekerasan Tablet (kp)
F1 F2 F3 F4 F5 F6 F7 F8
1 4,8 7,7 5,8 7,2 7,1 7,5 6,4 6,7
2 4,7 7,7 5,8 7,3 7,1 7,5 6,4 6,7
3 4,8 7,7 5,7 7,3 7,0 7,5 6,4 6,7
4 4,7 7,8 5,8 7,3 7,0 7,5 6,4 6,7
5 4,9 7,8 5,7 7,2 7,1 7,6 6,4 6,6
6 4,9 7,8 5,8 7,3 7,1 7,6 6,5 6,6
7 4,8 7,8 5,7 7,2 7,1 7,5 6,5 6,6
8 4,8 7,7 5,8 7,2 7,0 7,5 6,4 6,6
9 4,9 7,8 5,7 7,2 7,0 7,6 6,5 6,7
10 4,9 7,9 5,7 7,3 7,0 7,6 6,4 6,6
Rata-rata 4,82 7,77 5,70 7,25 7,05 7,54 6,43 6,65
SD 0,08 0,06 0,05 0,05 0,05 0,05 0,04 0,05
Replikasi 3
No Kekerasan Tablet (kp)
F1 F2 F3 F4 F5 F6 F7 F8
1 4,7 7,7 5,9 7,2 6,9 7,5 6,3 6,7
2 4,8 7,8 5,9 7,3 6,9 7.7 6,3 6,7
3 4,8 7,7 5,7 7,3 7,0 7,5 6,3 6,7
4 4,8 7,8 5,8 7,3 7,0 7.6 6,3 6,7
5 4,9 7,8 5,9 7,2 6,9 7,6 6,3 6,8
6 4,9 7,8 5,9 7,3 6,9 7,6 6,5 6,8
7 4,8 7,8 5,7 7,3 6,9 7,5 6,3 6,7
8 4,8 7,7 5,9 7,2 7,0 7,5 6,3 6,7
9 4,7 7,9 5,8 7,2 6,9 7,6 6,5 6,8
10 4,9 7,9 5,8 7,3 7,0 7,6 6,3 6,8
Rata-rata 4,81 7,79 5,83 7,26 6,94 7,55 6,34 6,74
LAMPIRAN F
HASIL UJI KERAPUHAN TABLET METFORMIN HCl
Formula Replikasi Berat Awal (gram)
Berat Akhir (gram)
Kerapuhan
(%) Rata-rata ± SD
1 1 13,96 13,88 0,5731 0,57 ± 0,01
2 13,92 13,84 0,5747
3 13,94 13,86 0,5739
2 1 13,93 13,90 0,2154 0,21 ± 0,01
2 13,95 13,92 0,2151
3 13,96 13,93 0,2149
3 1 13,73 13,63 0,7283 0,73 ± 0,01
2 13,77 13,67 0,7262
3 13,79 13,69 0,7252
4 1 13,98 13,90 0,5722 0,57 ± 0,01
2 13,89 13,81 0,5760
3 13,88 13,80 0,5764
5 1 14,14 14,08 0,4243 0,42 ± 0,01
2 14,17 14,11 0,4234
3 14,11 14,05 0,4252
6 1 14,23 14,17 0,4216 0,42 ± 0,01
2 14,28 14,22 0,4202
3 14,29 14,23 0,4199
7 1 13,96 13,87 0,6447 0,64 ± 0,01
2 13,94 13,85 0,6456
3 13,93 13,84 0,6461
8 1 14,28 14,21 0,4902 0,49 ± 0,01
2 14,26 14,19 0,4909
LAMPIRAN G
HASIL UJI WAKTU HANCUR TABLET METFORMIN HCL
Batch
Waktu Hancur (menit)
F1 F2 F3 F4 F5 F6 F7 F8
1 3,25 6,62 1,58 5,50 6,20 5,65 4,88 5,37
2 3,33 6,67 1,63 5,55 6,23 5,60 4,97 5,43
3 3,37 6,70 1,62 5,58 6,28 5,68 4,92 5,45
Rata-rata 3,32 6,66 1,61 5,54 6,24 5,64 4,92 5,42
LAMPIRAN H
HASIL VALIDASI METODE PENETAPAN KADAR METFORMIN
HCl
Hasil penentuan linieritas metformin HCl dalam larutan akuades
Hari No. C (µg/ml) Absorbansi Persamaan Regresi Linier
1 1 3,009 0,280 y= 0,078x + 0,039
2 4,513 0,381 a= 0,039
3 6,018 0,511 b= 0,078
4 7,522 0,629 r= 0,999
5 9,027 0,744 r hitung > r tabel
2 1 3,003 0,250 y= 0,080x + 0,031
2 4,504 0,370 a= 0,031
3 6,006 0,579 b= 0,080
4 7,507 0,635 r= 0,978
5 9,009 0,717 r hitung > r tabel
3 1 3,006 0,251 y= 0,081x + 0,024
2 4,509 0,370 a= 0,024
3 6,012 0,532 b= 0,081
4 7,515 0,615 r= 0,983
5 9,018 0,737 r hitung > r tabel
LAMPIRAN I
HASIL UJI PENETAPAN KADAR METFORMIN HCl
Formula Replikasi Absorbansi C Sampel
(µg/ml)
C Teoritis
(µg/ml)
Kadar (%)
Rata-rata Kadar (%) ± SD
1 1 0,509 6,018 6,002 100,26 100,27 ± 0,43
2 0,511 6,044 6,001 100,71
3 0,507 5,992 6,002 99,85
2 1 0,517 6,120 6,003 101,96 101,42 ± 0,62
2 0,515 6,095 6,002 101,55
3 0,511 6,044 5,999 100,74
3 1 0,506 5,980 5,998 99,70 100,16 ± 0,41
2 0,509 6,018 5,999 100,31
3 0,510 6,031 6,002 100,47
4 1 0,503 5,941 5,997 99,06 99,73 ± 0,61
2 0,507 5,992 6,001 99,86
3 0,509 6,018 6,002 100,27
5 1 0,504 5,954 5,996 99,30 99,71 ± 0,54
2 0,505 5,967 5,998 99,49
3 0,509 6,018 5,998 100,33
6 1 0,510 6,031 5,999 100,53 101,20 ± 0,72
2 0,513 6,070 6,002 101,12
3 0,517 6,120 6,002 101,96
7 1 0,511 6,044 5,990 100,90 101,23 ± 0,51
2 0,512 6,056 5,997 100,98
3 0,516 6,108 5,998 101,82
8 1 0,517 6,120 6,003 101,95 101,28 ± 0,60
2 0,513 6,069 6,002 101,12
LAMPIRAN J
HASIL UJI F KURVA BAKU PENETAPAN KADAR
Replikasi C (ppm) Abs X2 Y2 XY
1 3,009 0,280 9,054 0,079 0,843
4,513 0,381 20,372 0,145 1,720
6,018 0,511 36,216 0,261 3,075
7,522 0,629 56,588 0,396 4,732
9,027 0,744 81,487 0,553 6,716
Total 203,717 1,434 17,085
2 3,003 0,250 9,018 0,062 0,751
4,504 0,370 20,290 0,137 1,667
6,006 0,579 36,072 0,335 3,477
7,507 0,635 56,363 0,403 4,767
9,009 0,717 81,162 0,514 6,459
Total 202,905 1,452 17,122
3 3,006 0,251 9,0360 0,063 0,754
4,509 0,370 20,331 0,137 1,668
6,012 0,532 36,144 0,283 3,198
7,515 0,615 56,475 0,378 4,622
9,018 0,737 81,324 0,543 6,646
Total 203,311 1,404 16,889
Jumlah X2
Jumlah XY
Jumlah
Y2 n Residual SS
Residual DF Pers.Reg 1 203,717 17,085 1,434 5 1,0253E-03 4 Pers.Reg 2 202,905 17,122 1,452 5 7,2406E-03 4 Pers.Reg 3 203,312 16,889 1,404 5 1,2999E-03 4
Pooled reg. 9,5659E-03 12
Common reg. 609,933 51,096 4,290 9,7432E-03 11
SS1 0,0010
SS2 0,0072
SS3 0,0013
SSe 0,0097
F hitung 0,1112
LAMPIRAN K
HASIL VALIDASI METODE DISOLUSI TABLET METFORMIN
HCl
Hasil penentuan linieritas metformin HCl dalam larutan dapar fosfat pH 6,8
Hari No. C (µg/ml) Absorbansi Persamaan Regresi Linier
1 1 3,009 0,273 y= 0,087x - 6,333x10-3
2 4,513 0,328 a= -6,333 x 10-3
3 6,018 0,571 b= 0,087
4 7,522 0,645 r= 0,981
5 9,027 0,769 r hitung > r tabel
2 1 3,006 0,250 y= 0,080x + 0,031
2 4,509 0,370 a= 0,031
3 6,012 0,579 b= 0,080
4 7,515 0,635 r= 0,978
5 9,018 0,717 r hitung > r tabel
3 1 3,003 0,243 y= 0,086x + 0,001
2 4,504 0,351 a= 0,001
3 6,006 0,579 b= 0,086
4 7,507 0,685 r= 0,972
5 9,009 0,723 r hitung > r tabel
LAMPIRAN L
HASIL UJI DISOLUSI TABLET METFORMIN HCL
Formula 1
Replikasi t Absorbansi C (µg/ml) Wt (mg) % Obat Terlarut %ED 1 5 0,492 5,728 396,463 79,09 991,16 85,00
10 0,503 5,855 405,211 80,83 2004,18 15 0,517 6,016 416,347 83,06 2053,89 20 0,522 6,073 420,326 83,85 2091,68 30 0,555 6,452 446,577 89,09 4334,52 45 0,584 6,786 469,645 93,69 6871,67 60 0,613 7,119 492,713 98,29 7217,69
25564,79
2 5 0,496 5,774 399,639 79,36 999,10 84,76 10 0,506 5,889 407,598 80,94 2018,09 15 0,519 6,039 417,938 83,00 2063,84 20 0,525 6,108 422,707 83,94 2101,61 30 0,551 6,406 443,394 88,05 4330,50 45 0,587 6,820 472,026 93,74 6865,65 60 0,612 7,108 491,917 97,69 7229,57
25608,37
3 5 0,493 5,740 397,258 79,57 993,15 85,45 10 0,507 5,901 408,394 81,80 2014,13 15 0,511 5,947 411,571 82,44 2049,91 20 0,521 6,062 419,530 84,04 2077,75 30 0,553 6,429 444,986 89,13 4322,58 45 0,588 6,832 472,822 94,71 6883,56 60 0,615 7,142 494,305 99,01 7253,45
Formula 2
Replikasi t Absorbansi C (µg/ml) Wt (mg) % Obat Terlarut % ED 1 5 0,480 5,590 386,912 75,89 967,28 80,18
10 0,491 5,717 395,667 77,61 1956,45 15 0,508 5,912 409,190 80,26 2012,14 20 0,511 5,947 411,571 80,73 2051,90 30 0,525 6,108 422,707 82,91 4171,39 45 0,553 6,429 444,986 87,28 6507,70 60 0,584 6,786 469,645 92,12 6859,73
24526,59
2 5 0,484 5,636 390,095 76,83 975,24 80,77 10 0,495 5,763 398,843 78,55 1972,35
15 0,501 5,832 403,619 79,49 2006,16 20 0,514 5,981 413,959 81,53 2043,94 30 0,528 6,142 425,095 83,72 4195,27 45 0,555 6,452 446,577 87,95 6537,54 60 0,585 6,797 470,434 92,65 6877,59
24608,08
3 5 0,487 5,671 392,483 77,92 981,21 81,60 10 0,499 5,809 402,027 79,81 1986,28
15 0,505 5,878 406,802 80,76 2022,07 20 0,518 6,027 417,142 82,82 2059,86 30 0,529 6,154 425,891 84,55 4215,17 45 0,551 6,406 443,394 88,03 6519,63 60 0,589 6,843 473,618 94.03 6877,59
24661,81
Formula 3
Replikasi t Absorbansi C(µg/ml) Wt (mg) % Obat Terlarut %ED 1 5 0,499 5,809 402,027 80,65 1005,07 85,60
10 0,501 5,832 403,619 80,97 2014,11 15 0,519 6,039 417,938 83,84 2053,89 20 0,526 6,119 423,503 84,95 2103,60 30 0,553 6,429 444,986 89,26 4342,44 45 0,582 6,763 468,053 93,89 6847,79 60 0,618 7,176 496,686 99,63 7235,54
2 25602,46
5 0,496 5,774 399,639 79,68 999,10 85,51 10 0,507 5,901 408,394 81,42 2020,08 15 0,513 5,970 413,163 82,37 2053,89 20 0,529 6,154 425,891 84,91 2097,63 30 0,557 6,475 448,162 89,35 4370,27 45 0,583 6,774 468,849 93,48 6877,59 60 0,617 7,165 495,897 98,87 7235,59 25654,16 3 5 0,497 5,786 400,435 79,71 1001,09 85,01
Formula 4
Replikasi t Absorbansi C (µg/ml) Wt (mg) % Obat Terlarut %ED 1 5 0,493 5,740 397,258 80,20 993,15 86,29
10 0,506 5,889 407,598 82,29 2012,14 15 0,517 6,016 416,347 84,06 2059,86 20 0,528 6,142 425,094 85,82 2103,60 30 0,559 6,498 449,754 90,80 4374,25 45 0,582 6,763 468,053 94,50 6883,56 60 0,615 7,142 494,305 99,80 7217,69 25644,24 2 5 0,495 5,763 398,843 78,99 997,11 84,92
10 0,509 5,924 409,986 81,20 2022,07 15 0,517 6,016 416,347 82,46 2065,83 20 0,523 6,085 421,122 83,41 2093,67 30 0,558 6,487 448,958 88,92 4350,40 45 0,589 6,843 473,618 93,80 6919,32 60 0,618 7,176 496,686 98,37 7277,28 25725,69 3 5 0,492 5,705 394,871 78,76 987,18 85,33
10 0,506 5,843 404,415 80,66 1998,21 15 0,519 6,039 417,938 83,36 2055,88 20 0,525 6,096 421,918 84,15 2099,64 30 0,55 6,452 446,577 89,07 4342,48 45 0,589 6,843 473,618 94,47 6901,47 60 0,619 7,188 497,481 99,23 7283,25 25668,10
Formula 5
Replikasi T Absorbansi C (µg/ml) Wt (mg) % Obat Terlepas
%ED 1 5 0,493 5,740 397,258 78,74 993,15 84,70
10 0,503 5,855 405,211 80,32 2006,17 15 0,514 5,981 413,959 82,05 2047,92 20 0,521 6,062 419,530 83,16 2083,72 30 0,559 6,498 449,754 89,15 4346,42 45 0,587 6,820 472,026 93,56 6913,35 60 0,615 7,142 494,305 97,98 7247,48 25638,22 2 5 0,495 5,763 398,843 78,99 997,11 84,92
10 0,509 5,924 409,986 81,20 2022,07 15 0,517 6,016 416,347 82,46 2065,83 20 0,523 6,085 421,122 83,41 2093,67 30 0,558 6,487 448,958 88,92 4350,40 45 0,589 6,843 473,618 93,80 6919,32 60 0,618 7,176 496,6856 98,37 7277,28 25725,69 3 5 0,492 5,728 496,463 77,87 991,16 83,96
Formula 6
Replikasi t Absorbansi C (µg/ml) Wt (mg) % Obat Terlarut %ED 1 5 0,474 5,521 382,143 76,03 955,36 80,34
10 0,492 5,728 396,463 78,88 1946,51 15 0,506 5,889 407,598 81,09 2010,15 20 0,512 5,958 412,367 82,04 2049,91 30 0,523 6,085 421,122 83,78 4167,45 45 0,544 6,326 437,822 87,11 6442,08 60 0,559 6,498 449,754 89,48 6656,83 24228,29 2 5 0,471 5,487 379,755 75,11 949,39 80,03
10 0,495 5,763 398,843 78,88 1946,50 15 0,503 5,855 405,211 80,14 2010,14 20 0,517 6,016 416,347 82,34 2053,89 30 0,525 6,108 422,707 83,60 4195,27 45 0,546 6,349 439,414 86,91 6465,91 60 0,557 6,475 448,162 88,64 6656,83 24277,92 3 5 0,477 5,556 384,531 75,43 961,33 79,24
10 0,496 5,774 399,639 78,39 1960,43 15 0,501 5,832 403,619 79,17 2008,15 20 0,515 5,993 414,755 81,35 2045,93 30 0,528 6,142 425,095 83,38 4199,25 45 0,541 6,291 435,435 85,41 6453,97 60 0,554 6,441 445,775 87,44 6609,07 24238,12
Formula 7
Replikasi t Absorbansi C (µg/ml) Wt (mg) % Obat Terlarut % ED 1 5 0,497 5,786 400,435 80,65 1001,09 85,82
10 0,504 5,866 406,007 81,77 2016,10 15 0,511 5,947 411,571 82,89 2043,94 20 0,527 6,131 424,299 85,45 2089,67 30 0,557 6,475 448,162 90,26 4362,31 45 0,581 6,751 467,257 94,11 6865,65 60 0,611 7,096 491,121 98,91 7187,84 25566,61 2 5 0,495 5,763 398,843 80,18 997,11 85,71
10 0,501 5,832 403,619 81,14 2006,16 15 0,513 5,970 413,163 83,06 2041,95 20 0,529 6,154 425,891 85,62 2097,65 30 0,558 6,487 448,958 90,25 4374,25 45 0,580 6,740 466,162 93,77 6865,65 60 0,614 7,131 493,509 99,21 7199,78 25582,52 3 5 0,497 5,786 400,435 79,83 1001,09 84,99
Formula 8
Replikasi t Absorbansi C (µg/ml) Wt (mg) % Obat Terlepas
%ED
1 5 0,494 5,751 398,054 78,09 995,136 83,76 10 0,502 5,843 404,415 79,34 2006,17
15 0,518 6,027 417,142 81,84 2053,89 20 0,527 6,131 424,299 83,24 2103,60 30 0,551 6,406 443,394 86,99 4338,46 45 0,586 6,809 471,237 92,45 6859,73 60 0,618 7,176 496,686 97,44 7259,42 25616,4
2 5 0,496 5,774 399,639 79,04 999,098 84,60 10 0,507 5,901 408,394 80,77 2020,08
15 0,516 6,004 415,551 82,19 2059,86 20 0,524 6,096 421,918 83,45 2093,67 30 0,554 6,441 445,782 88,17 4338,50 45 0,587 6,820 472,026 93,36 6883,56 60 0,619 7,188 497,481 98,39 7271,31 25666,1
3 5 0,490 5,705 394,871 77,47 987,177 84,65 10 0,504 5,866 406,007 79,65 2002,19
LAMPIRAN M
HASIL UJI F KURVA BAKU DISOLUSI
Replikasi C (ppm) Abs X2 Y2 XY
1 3,009 0,273 9,054 0,074 0,821
4,513 0,328 20,372 0,108 1,480
6,018 0,571 36,216 0,326 3,436
7,522 0,645 56,588 0,416 4,852
9,027 0,769 81,487 0,591 6,942
Total 203,717 1,515 17,531
2 3,006 0,270 9,036 0,073 0,812
4,509 0,328 20,331 0,108 1,479
6,012 0,564 36,144 0,318 3,391
7,515 0,635 56,475 0,403 4,772
9,018 0,717 81,324 0,514 6,466
Total 203,311 1,416 16,919
3 3,003 0,243 9,018 0,059 0,730
4,504 0,351 20,290 0,123 1,581
6,006 0,579 36,072 0,335 3,477
7,507 0,685 56,363 0,469 5,143
9,009 0,723 81,162 0,523 6,513
Total 202,905 1,509 17,444
Jumlah X2
Jumlah XY
Jumlah
Y2 n Residual SS
Residual DF Pers.Reg 1 203,7168 17,0531 1,5154 5 8,7888E-02 4 Pers.Reg 2 203,3108 16,9193 1,4159 5 7,8946E-03 4 Pers.Reg 3 202,9052 17,4444 1,5094 5 9,6499E-03 4
Pooled reg. 1,0543E-01 12
Common reg. 609,9328 51,4168 4,4407 1,0631E-01 11
SS1 0,0879
SS2 0,0079
SS3 0,0096
SSe 0,1063
F hitung 0,0499
LAMPIRAN N
CONTOH PERHITUNGAN
Contoh Perhitungan Akurasi Presisi
Replikasi 1:
Persamaan regresi yang digunakan: y = 0,078x + 0,039 Absorbansi (y) = 0,408
Csampel (x) = 4,726 ppm (hasil dari substitusi y)
Wbahan aktif = 400,3 mg (baku induk = 4003 ppm)
Wmatriks = 300,5 mg
Cteoritis = (0,012 : 10) x 4003 ppm = 4,8036
Perolehan kembali (%) = (Csampel : Cteoritis) x 100%
= (4,726 : 4,8036) x 100% = 98,38%
KV (%) = (SD :
X
) x 100% = (0,39 : 98,73) x 100 % = 0,39%Contoh Perhitungan Penetapan Kadar
Formula 1 replikasi 1:
Persamaan regresi yang digunakan: y = 0,078x + 0,039 Absorbansi (y) = 0,509
Csampel (x) = 6,018 ppm (hasil dari substitusi y)
Cteoritis = 700,3 mg : 700 mg x 500 mg = 500,21 mg (jumlah metformin HCl dalam tablet)
= 0,012/10 x 5002,1 = 6,002 ppm
Kadar (%) = (Csampel : Cteoritis) x 100% = (6,018 : 6,002) x 100% = 100,26%
Contoh Perhitungan % Obat Terlepas
Replikasi t Absorbansi C (µg/ml) Wt (mg) % Obat Terlarut %ED
1 5 0,492 5,728 396,463 79,09 991,16 85,00 10 0,503 5,855 405,211 80,83 2004,18 15 0,517 6,016 416,347 83,06 2053,89 20 0,522 6,073 420,326 83,85 2091,68 30 0,555 6,452 446,577 89,09 4334,52 45 0,584 6,786 469,645 93,69 6871,67 60 0,613 7,119 492,713 98,29 7217,69
25564,79
Formula 1 replikasi 1: t = 60 menit
Persamaan regresi yang digunakan: y = 0,087x – 0,006 Absorbansi (y) = 0,613
Csampel (x) = 7,119 ppm (hasil dari substitusi y)
Wt = (900 : 1000) x 76,9 (FP) x 7,119 ppm = 492,713 mg Kadar (mg) hasil penetapan kadar = 501,29
Persen obat terlepas (%) = (492,713 mg : 501,29 mg) x 100% = 98,29 %
Contoh Perhitungan Efisiensi Disolusi Pada t=60 Menit Formula 1 replikasi 1:
tn = 60 menit ; tn-1 = 45 menit
Wtn = 492,713 mg ; Wtn-1 = 469,645 mg
= ((Wtn + Wtn-1): 2 ) x (tn – tn-1) = 2096,75 µg menit/mL
= ((492,713 + 469,645): 2 ) x (60 – 45) = 7217,69 µg menit/mL Kadar (mg) pada PK = 501,29 mg
Σ = 25564,79 µg menit/mL (hasil penjumlahan AUC t=5 hingga t=60)
ED60 (%) = (Σ : L. persegi) x 100%
LAMPIRAN O
HASIL UJI MUTU FISIK TABLET FORMULA OPTIMUM
Kekerasan Tablet
Kerapuhan Tablet
Waktu Hancur Tablet
Keterangan : F1 : hasil uji mutu fisik tablet formula optimum
LAMPIRAN P
HASIL UJI DISOLUSI TABLET FORMULA OPTIMUM
Tablet Formula Optimum
Replikasi t (menit) Absorbansi C (µg/ml) Wt (mg) %wt %ED 1 5 0,492 5,728 396,463 79,12 991,16 84,97
10 0,503 5,855 405,211 80,86 2004,18 15 0,517 6,016 416,347 83,08 2053,89 20 0,533 6,200 429,074 85,62 2113,55 30 0,584 6,786 469,645 93,72 4493,60 45 0,575 6,682 462,482 92,29 6990,95 60 0,569 6,613 457,713 91,34 6901,47
25548,80
2 5 0,496 5,774 399,639 79,74 999,10 84,97 10 0,505 5,878 406,802 81,17 2016,10 15 0,514 5,981 413,959 82,59 2051,90 20 0,539 6,269 433,850 86,56 2119,52 30 0,580 6,740 466,462 93,07 4501,56 45 0,579 6,728 465,666 92,91 6990,95 60 0,560 6,510 450,550 89,89 6871,62
25550,76
3 5 0,497 5,786 400,435 79,89 1001,09 85,04 10 0,508 5,912 409,190 81,63 2024,06 15 0,516 6,004 415,537 82,90 2061,82 20 0,538 6,257 433,054 86,39 2121,48 30 0,580 6,740 466,462 93,06 4497,58 45 0,576 6,694 463,278 92,42 6973,05 60 0,567 6,590 456,122 91,00 6895,50
Tablet Inovator Metformin HCl
Replikasi t Absorbansi C (µg/ml) Wt (mg) % Obat Terlarut %ED 1 5 0,288 3,384 234,186 46,64 585,46 70,05
10 0,365 4,269 295,437 58,84 1324,06 15 0,408 4,763 329,640 65,65 1562,69 20 0,438 5,108 353,504 70,40 1707,86 30 0,509 5,924 409,986 81,65 3817,45 45 0,511 5,947 411,571 81,96 6161,68 60 0,473 5,510 381,340 75,94 5946,83 21106,04 2 5 0,283 3,326 230,206 45,85 575,52 69,83
10 0,361 4,223 292,253 58,20 1306,15 15 0,402 4,694 324,865 64,70 1542,79 20 0,433 5,050 349,524 69,61 1685,97 30 0,509 5,924 409,986 81,65 3797,55 45 0,514 5,981 413,959 82,44 6179,59 60 0,471 5,487 379,755 75,63 5952,86 21040,43 3 5 0,285 3,349 231,798 46,15 579,50 69,78
10 0,368 4,303 297,824 59,30 1324,06 15 0,405 4,728 327,253 65,16 1562,69 20 0,435 5,073 351,116 69,91 1695,92 30 0,502 5,843 404,415 80,52 3777,65 45 0,512 5,958 412,367 82,10 6125,86 60 0,474 5,521 382,143 76,08 5958,83 21024,51
Tablet Formula Pembanding
Replikasi t (menit) Absorbansi C (µg/ml) Wt (mg) %wt %ED 1 5 0,510 5,935 410,775 81,70 1026,94 83,78
10 0,521 6,062 419,530 83,44 2075,76 15 0,552 6,418 444,183 88,34 2159,28 20 0,584 6,786 469,645 93,41 2284,57 30 0,57 6,625 458,502 91,19 4640,74 45 0,543 6,314 437,026 86,92 6716,47 60 0,512 5,958 412,367 82,02 6370,45 25274,21 2 5 0,513 5,970 413,163 82,24 1032,91 84,09
10 0,529 6,154 425,891 84,77 2097,63 15 0,553 6,429 444,986 88,57 2177,19 20 0,586 6,809 471,237 93,80 2290,56 30 0,571 6,636 459,305 91,42 4652,71 45 0,541 6,291 435,435 86,67 6710,55 60 0,515 5,993 414,755 82,55 6376,42 25337,97 3 5 0,518 6,027 417,142 83,02 1042,86 84,01
LAMPIRAN Q
HASIL UJI ANAVA KEKERASAN TABLET
DESIGN EXPERT
Response 1 KEKERASAN
ANOVA for selected factorial model
Analysis of variance table [Partial sum of squares - Type III]
Sum of Mean F p-value
Source Squares Df Square Value Prob > F
Model 20,0492 7 2,8642 1324,476 < 0.0001 significant A-Konsentrasi AKP 10,5603 1 10,5603 4883,360 < 0.0001
B-Konsentrasi Ac-Di-Sol 0,3651 1 0,3651 168,817 < 0.0001 C-Konsentrasi MgS 1,4406 1 1,4406 666,173 < 0.0001 AB 1,1180 1 1,1180 517,002 < 0.0001 AC 4,6288 1 4,6288 2140,493 < 0.0001 BC 1,3348 1 1,3348 617,256 < 0.0001 ABC 0,6017 1 0,6017 278,227 < 0.0001 Pure Error 0,0346 16 0,0022
Cor Total 20,0838 23
The Model F-value of 1324.48 implies the model is significant. There is only a 0.01% chance that a "Model F-Value" this large could occur due to noise. Values of "Prob > F" less than 0.0500 indicate model terms are significant. In this case A, B, C, AB, AC, BC, ABC are significant model terms. Values greater than 0.1000 indicate the model terms are not significant.
If there are many insignificant model terms (not counting those required to support hierarchy), model reduction may improve your model.
Std. Dev. 0,0465 R-Squared 0,9983
Mean 6,6575 Adj R-Squared 0,9975
C.V. % 0,6985 Pred R-Squared 0,9961
PRESS 0,0778 Adeq Precision 110,0006
Coefficient Standard 95% CI 95% CI
Factor Estimate Df Error Low High
Intercept 6,6575 1 0,0095 6,6374 6,6776
A-Konsentrasi AKP 0,6633 1 0,0095 0,6432 0,6835 B-Konsentrasi Ac-Di-Sol -0,1233 1 0,0095 -0,1435 -0,1032 C-Konsentrasi MgS 0,2450 1 0,0095 0,2249 0,2651
AB -0,2158 1 0,0095 -0,2360 -0,1957
AC -0,4392 1 0,0095 -0,4593 -0,4190
BC -0,2358 1 0,0095 -0,2560 -0,2157
ABC 0,1583 1 0,0095 0,1382 0,1784
Final Equation in Terms of Coded Factors: KEKERASAN =
6,6575
0,6633 * A -0,1233 * B 0,2450 * C -0,21583 * A * B
-0,4392 * A * C -0,2358 * B * C
0,1583 * A * B * C
Final Equation in Terms of Actual Factors: KEKERASAN =
6,6575
0,6633 * Konsentrasi AKP -0,1233 * Konsentrasi Ac-Di-Sol
0,2450 * Konsentrasi MgS
-0,2158 * Konsentrasi AKP * Konsentrasi Ac-Di-Sol -0,4392 * Konsentrasi AKP * Konsentrasi MgS -0,2358 * Konsentrasi Ac-Di-Sol * Konsentrasi MgS
0,1583 * Konsentrasi AKP * Konsentrasi Ac-Di-Sol * Konsentrasi MgS The Diagnostics Case Statistics Report has been moved to the Diagnostics Node.
In the Diagnostics Node, Select Case Statistics from the View Menu. Proceed to Diagnostic Plots (the next icon in progression). Be sure to look at the: 1) Normal probability plot of the studentized residuals to check for normality of residuals. 2) Studentized residuals versus predicted values to check for constant error.
3) Externally Studentized Residuals to look for outliers, i.e., influential values. 4) Box-Cox plot for power transformations.
LAMPIRAN R
HASIL UJI ANAVA KERAPUHAN TABLET
DESIGN EXPERT
Response 2 KERAPUHAN
ANOVA for selected factorial model
Analysis of variance table [Partial sum of squares - Type III]
Sum of Mean F p-value Source Squares Df Square Value Prob > F
Model 0,5286 7 0,0755 55022,43 < 0.0001 significant A-Konsentrasi AKP 0,1680 1 0,1680 122406,30 < 0.0001
B-Konsentrasi Ac-Di-Sol 0,2420 1 0,2420 176323,60 < 0.0001 C-Konsentrasi MgS 0,0045 1 0,0045 3294,00 < 0.0001
AB 0,0011 1 0,0011 846,66 < 0.0001
AC 0,0463 1 0,0463 33776,66 < 0.0001 BC 0,0183 1 0,0184 13400,95 < 0.0001 ABC 0,0482 1 0,0482 35108,84 < 0.0001 Pure Error 2,2E-05 16 1,37E-06
Cor Total 0,52865 23
The Model F-value of 55022.43 implies the model is significant. There is only a 0.01% chance that a "Model F-Value" this large could occur due to noise. Values of "Prob > F" less than 0.0500 indicate model terms are significant. In this case A, B, C, AB, AC, BC, ABC are significant model terms. Values greater than 0.1000 indicate the model terms are not significant.
If there are many insignificant model terms (not counting those required to support hierarchy), model reduction may improve your model.
Std. Dev. 0,0012 R-Squared 0,9999
Mean 0,5089 Adj R-Squared 0,9999
C.V. % 0,2302 Pred R-Squared 0,9999
PRESS 4,94E-05 Adeq Precision 756,1248
Coefficient Standard 95% CI 95% CI
Factor Estimate Df Error Low High
Intercept 0,5089 1 0,000239 0,5084 0,5094 A-Konsentrasi AKP -0,0837 1 0,000239 -0,0842 -0,0832 B-Konsentrasi Ac-Di-Sol 0,1004 1 0,000239 0,0999 0,1009 C-Konsentrasi MgS -0,0137 1 0,000239 -0,0142 -0,0132 AB 0,0069 1 0,000239 0,0064 0,0075
AC 0,0439 1 0,000239 0,0434 0,0444
BC -0,0277 1 0,000239 -0,0282 -0,0272
ABC -0,0448 1 0,000239 -0,0453 -0,0443 Final Equation in Terms of Coded Factors:
KERAPUHAN = 0,5089 -0,0837 * A
0,1004 * B -0,0137 * C
0,0069 * A * B 0,0439 * A * C -0,0277 * B * C -0,0448 * A * B * C
Final Equation in Terms of Actual Factors: KERAPUHAN =
0,5089
-0,0837 * Konsentrasi AKP 0,1004 * Konsentrasi Ac-Di-Sol -0,0137 * Konsentrasi MgS
0,0069 * Konsentrasi AKP * Konsentrasi Ac-Di-Sol 0,0439 * Konsentrasi AKP * Konsentrasi MgS -0,0277 * Konsentrasi Ac-Di-Sol * Konsentrasi MgS
-0,0448 * Konsentrasi AKP * Konsentrasi Ac-Di-Sol * Konsentrasi MgS The Diagnostics Case Statistics Report has been moved to the Diagnostics Node.
In the Diagnostics Node, Select Case Statistics from the View Menu. Proceed to Diagnostic Plots (the next icon in progression). Be sure to look at the: 1) Normal probability plot of the studentized residuals to check for normality of residuals. 2) Studentized residuals versus predicted values to check for constant error.
3) Externally Studentized Residuals to look for outliers, i.e., influential values. 4) Box-Cox plot for power transformations.
LAMPIRAN S
HASIL UJI ANAVA WAKTU HANCUR TABLET
DESIGN EXPERT
Response 3 WAKTU HANCUR
ANOVA for selected factorial model
Analysis of variance table [Partial sum of squares - Type III]
Sum of Mean F p-value Source Squares Df Square Value Prob > F
Model 58,3741 7 8,3392 4528,05 < 0.0001 Significant A-Konsentrasi AKP 19,3321 1 19,3321 10497,10 < 0.0001
B-Konsentrasi Ac-Di-Sol 7,1504 1 7,1504 3882,57 < 0.0001 C-Konsentrasi MgS 9,7028 1 9,7028 5268,50 < 0.0001 AB 1,0500 1 1,0500 570,14 < 0.0001 AC 20,4241 1 20,4241 11090,04 < 0.0001 BC 0,6208 1 0,6208 337,09 < 0.0001 ABC 0,0937 1 0,0937 50,90 < 0.0001 Pure Error 0,0295 16 0,0018
Cor Total 58,4036 23
The Model F-value of 4528.05 implies the model is significant. There is only a 0.01% chance that a "Model F-Value" this large could occur due to noise. Values of "Prob > F" less than 0.0500 indicate model terms are significant. In this case A, B, C, AB, AC, BC, ABC are significant model terms. Values greater than 0.1000 indicate the model terms are not significant.
If there are many insignificant model terms (not counting those required to support hierarchy), model reduction may improve your model.
Std. Dev. 0,0429 R-Squared 0,9994
Mean 4,9192 Adj R-Squared 0,9993
Coefficient Standard 95% CI 95% CI Factor Estimate Df Error Low High Intercept 4,9192 1 0,00876 4,9006 4,9377 A-Konsentrasi AKP 0,8975 1 0,00876 0,8789 0,9161 B-Konsentrasi Ac-Di-Sol -0,5458 1 0,00876 -0,5644 -0,5273 C-Konsentrasi MgS 0,6358 1 0,00876 0,6173 0,6544 AB 0,2092 1 0,00876 0,1906 0,2277 AC -0,9225 1 0,00876 -0,9411 -0,9039 BC 0,1608 1 0,00876 0,1423 0,1794 ABC 0,0625 1 0,00876 0,0439 0,0811 Final Equation in Terms of Coded Factors:
WAKTU HANCUR = 4,9192 0,8975 * A -0,5458 * B 0,6358 * C 0,2092 * A * B -0,9225 * A * C 0,1608 * B * C 0,0625 * A * B * C
Final Equation in Terms of Actual Factors: WAKTU HANCUR =
4,9192
0,8975 * Konsentrasi AKP -0,5458 * Konsentrasi Ac-Di-Sol
0,6358 * Konsentrasi MgS
0,2092 * Konsentrasi AKP * Konsentrasi Ac-Di-Sol -0,9225 * Konsentrasi AKP * Konsentrasi MgS
0,1608 * Konsentrasi Ac-Di-Sol * Konsentrasi MgS
0,0625 * Konsentrasi AKP * Konsentrasi Ac-Di-Sol * Konsentrasi MgS
The Diagnostics Case Statistics Report has been moved to the Diagnostics Node. In the Diagnostics Node, Select Case Statistics from the View Menu.
Proceed to Diagnostic Plots (the next icon in progression). Be sure to look at the: 1) Normal probability plot of the studentized residuals to check for normality of residuals. 2) Studentized residuals versus predicted values to check for constant error.
3) Externally Studentized Residuals to look for outliers, i.e., influential values. 4) Box-Cox plot for power transformations.
LAMPIRAN T
HASIL UJI ANAVA EFISIENSI DISOLUSI
DESIGN EXPERT
Response 4 ED 60
ANOVA for selected factorial model
Analysis of variance table [Partial sum of squares - Type III]
Sum of Mean F p-value
Source Squares Df Square Value Prob > F
Model 106,7158 7 15,2451 60,5726 < 0.0001 Significant A-Konsentrasi AKP 35,2595 1 35,2595 140,0947 < 0.0001
B-Konsentrasi Ac-Di-Sol 42,3207 1 42,3207 168,1506 < 0.0001 C-Konsentrasi MgS 2,8912 1 2,8912 11,4875 0.0037 AB 24,3412 1 24,3412 96,7136 < 0.0001
AC 1,4357 1 1,4357 5,7044 0.0296
BC 0,0273 1 0,0273 0,1086 0.7460
ABC 0,44010 1 0,4401 1,7486 0.2046
Pure Error 4,0269 16 0,2517
Cor Total 110,7427 23
The Model F-value of 60.57 implies the model is significant. There is only a 0.01% chance that a "Model F-Value" this large could occur due to noise. Values of "Prob > F" less than 0.0500 indicate model terms are significant. In this case A, B, C, AB, AC are significant model terms.
Values greater than 0.1000 indicate the model terms are not significant.
If there are many insignificant model terms (not counting those required to support hierarchy), model reduction may improve your model.
Std. Dev. 0,5017 R-Squared 0,9636
Mean 83,9071 Adj R-Squared 0,9477
Coefficient Standard 95% CI 95% CI
Factor Estimate Df Error Low High
Intercept 83,9071 1 0,102405 83,6899 84,1242 A-Konsentrasi AKP -1,2121 1 0,102405 -1,4291 -0,9949 B-Konsentrasi Ac-Di-Sol 1,3279 1 0,102405 1,11083 1,5450 C-Konsentrasi MgS -0,3471 1 0,102405 -0,5642 -0,1299
AB 1,0070 1 0,102405 0,7899 1,2242
AC -0,2446 1 0,102405 -0,4617 -0,0275
BC 0,0337 1 0,102405 -0,1833 0,2508
ABC -0,1354 1 0,102405 -0,3525 0,0817
Final Equation in Terms of Coded Factors: ED 60 =
83,9071 -1,2121 * A
1,3279 * B -0,3471 * C
1,0070 * A * B -0,2446 * A * C 0,0337 * B * C -0,1354 * A * B * C Final Equation in Terms of Actual Factors:
ED 60 = 83,9071
-1,2121 * Konsentrasi AKP 1,3279 * Konsentrasi Ac-Di-Sol -0,3471 * Konsentrasi MgS
1,0070 * Konsentrasi AKP * Konsentrasi Ac-Di-Sol -0,2446 * Konsentrasi AKP * Konsentrasi MgS
0,0337 * Konsentrasi Ac-Di-Sol * Konsentrasi MgS
-0,1354 * Konsentrasi AKP * Konsentrasi Ac-Di-Sol * Konsentrasi MgS The Diagnostics Case Statistics Report has been moved to the Diagnostics Node.
In the Diagnostics Node, Select Case Statistics from the View Menu. Proceed to Diagnostic Plots (the next icon in progression). Be sure to look at the: 1) Normal probability plot of the studentized residuals to check for normality of residuals. 2) Studentized residuals versus predicted values to check for constant error.
3) Externally Studentized Residuals to look for outliers, i.e., influential values. 4) Box-Cox plot for power transformations.
LAMPIRAN U
HASIL UJI ANAVA KEKERASAN TABLET METFORMIN HCl
ANOVA
Kekerasan
Sum of Squares df Mean Square F Sig. Between Groups 20.027 7 2.861 1398.470 .000
Within Groups .033 16 .002
Total 20.060 23
Keterangan :
F
hitung(1398,470) > F
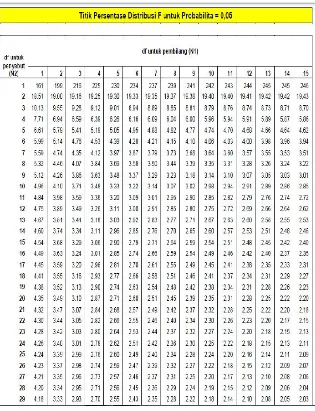
tabel (0,05)(7,16)(2,66) maka H0 ditolak dan ada perbedaan
bermakna antar formula. Rata-rata kekerasan dari kedelapan formula tablet
metformin HCl menunjukkan ada perbedaan yang signifikan antar formula.
Kekerasan
Tukey HSDa formula N
Subset for alpha = 0.05
1 2 3 4 5 6 7 8
1 3 4.8233
3 3 5.7967
7 3 6.3900
8 3 6.7100
5 3 6.9800
4 3 7.2533
6 3 7.5433
2 3 7.7767
Sig. 1.000 1.000 1.000 1.000 1.000 1.000 1.000 1.000 Means for groups in homogeneous subsets are displayed.
Keterangan :
LAMPIRAN V
HASIL UJI ANAVA KERAPUHAN TABLET METFORMIN HCl
ANOVA
Kerapuhan
Sum of Squares Df Mean Square F Sig. Between Groups .529 7 .076 55022.434 .000
Within Groups .000 16 .000
Total .529 23
Keterangan :
F
hitung(55022,434) > F
tabel (0,05)(7,16)(2,66) maka H0 ditolak dan ada perbedaan
bermakna antar formula. Rata-rata kerapuhan dari kedelapan formula tablet
metformin HCl menunjukkan ada perbedaan yang signifikan antar formula.
Kerapuhan
Tukey HSDa
formula N
Subset for alpha = 0.05
1 2 3 4 5 6 7
2 3 .215133
6 3 .420567
5 3 .424300
8 3 .490333
1 3 .573900
4 3 .574867
7 3 .645467
3 3 .726567
Sig. 1.000 1.000 1.000 1.000 .966 1.000 1.000 Means for groups in homogeneous subsets are displayed.
Keterangan :
LAMPIRAN W
HASIL UJI ANAVA WAKTU HANCUR TABLET METFORMIN
HCl
ANOVA
waktu_hancur
Sum of Squares Df Mean Square F Sig. Between Groups 51.458 7 7.351 21.630 .000
Within Groups 5.438 16 .340
Total 56.895 23
Keterangan :
F
hitung(21,630) > F
tabel(0,05)(7,16)(2,66) maka H0 ditolak dan ada perbedaan bermakna
antar formula. Rata-rata waktu hancur dari kedelapan formula tablet metformin HCl
menunjukkan ada perbedaan yang signifikan antar formula.
waktu_hancur
Tukey HSDa
formula N Subset for alpha = 0.05
1 2 3 4
3 3 1.6100
1 3 4.3000
7 3 4.9233 4.9233
8 3 5.4167 5.4167 5.4167
4 3 5.5433 5.5433 5.5433
6 3 5.6433 5.6433 5.6433
5 3 6.2367 6.2367
2 3 6.6633
Sig. 1.000 .157 .174 .218
Keterangan :
LAMPIRAN X
HASIL UJI ANAVA EFISIENSI DISOLUSI TABLET METFORMIN
HCl
ANOVA
ED_60
Sum of Squares Df Mean Square F Sig. Between Groups 105.243 7 15.035 60.534 .000
Within Groups 3.974 16 .248
Total 109.217 23
Keterangan :
F
hitung(60,534) > F
tabel(0,05)(7,16)(2,66) maka H0 ditolak dan ada perbedaan bermakna
antar formula. Rata-rata efisiensi disolusi dari kedelapan formula tablet metformin
HCl menunjukkan ada perbedaan yang signifikan antar formula.
ED_60
Tukey HSDa
formula N
Subset for alpha = 0.05
1 2
6 3 79.8700
2 3 80.8500
8 3 84.3367
5 3 84.5267
1 3 85.0700
3 3 85.1967
7 3 85.5067
4 3 85.7233
Sig. .300 .055
Means for groups in homogeneous subsets are displayed.
Keterangan :
LAMPIRAN Y
LAMPIRAN Z
HASIL PENGUJIAN SUSUT PENGERINGAN AMILUM KULIT
PISANG
LAMPIRAN AB
LAMPIRAN AE
SERTIFIKAT ANALISIS BAHAN